
Supply and Demand Trading in 2026
We have been trading supply and demand strategies for over ten years, and they have stood the test of time remarkably well. Supply and demand is...
When it comes to price action trading, understanding candlestick patterns is one of the most important building blocks of your chart reading. These candlestick patterns offer visual cues that help traders anticipate market movements. One of the most powerful and frequently observed patterns is the pinbar candlestick. In this guide, we'll dive into what a pinbar candlestick is, how to identify it, and, most importantly, how to trade it effectively.
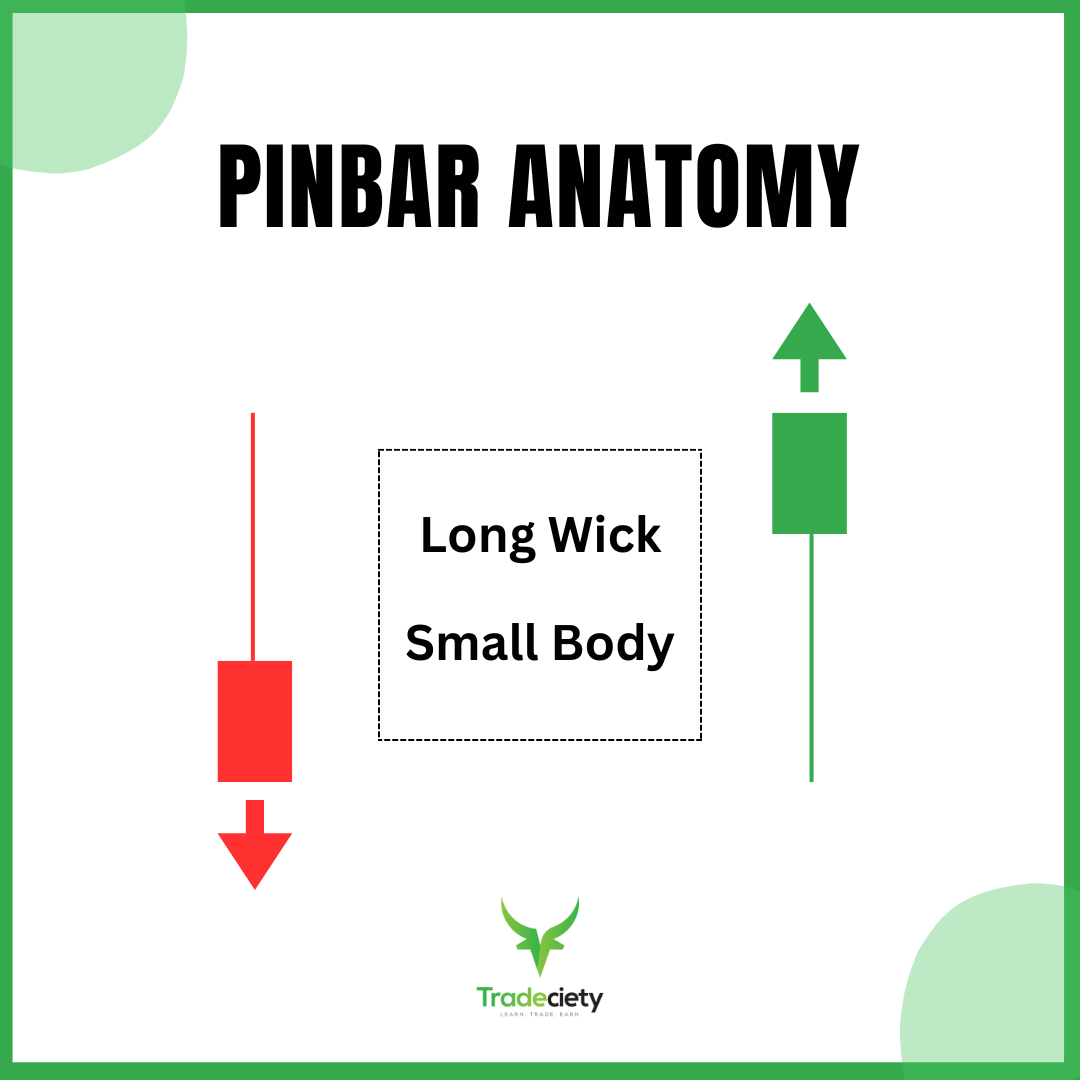
To fully understand the power of the pinbar, it’s essential to dissect its structure. A typical pinbar has three main components:
Long Wick (Shadow): The wick is the most prominent feature of a pinbar. It indicates the price level that the market rejected. In a bullish pinbar, this wick is at the bottom, while in a bearish pinbar, it’s at the top.
Small Real Body: The body of the pinbar, which represents the open and close of the candle, is small in comparison to the wick. This small body is crucial because it shows that there was little agreement between buyers and sellers at the extremes tested by the wick.
Shorter Opposite Wick: The opposite wick is much shorter or may even be non-existent, further highlighting the dominance of the rejection represented by the long wick.

The psychology behind the pinbar is straightforward: it’s a battle between buyers and sellers, where one side momentarily takes control but ultimately fails, leading to a sharp reversal. This failure to maintain control creates a strong signal for traders, away from the long wick and into the direction of the body.
A pinbar candlestick is a single candlestick pattern characterized by one long wick, a small body, and another much shorter wick (or a completely missing wick) on the opposite side, which together resemble a "pin." The long wick shows that the market tested a certain price level but was quickly rejected, causing the price to move back. This rejection wick is what makes the pinbar a powerful signal in trading.
Pinbars can be bullish or bearish, depending on where they form and the direction of the market. A bullish pinbar has a long lower wick and forms in a downtrend, signaling that the sellers tried to push the price lower but failed, leading to a potential upward reversal.
Conversely, a bearish pinbar has a long upper wick and forms in an uptrend, indicating that buyers tried to push the price higher but were rejected, suggesting a potential downward reversal.

Spotting a pinbar candlestick on a chart is relatively simple once you know what to look for. Here are the key criteria:
Wick Length: The wick must be at least two-thirds of the entire candlestick's length. This means the longer the wick relative to the body, the stronger the signal.
Body Position: The body of the pinbar should be at one end of the candlestick. For bullish pinbars, the body should be near the top of the candlestick, while for bearish pinbars, it should be near the bottom.
Market Context: A valid pinbar should form at a significant level on the chart, such as a support or resistance zone, trendline, or moving average. This context is essential for determining the pinbar’s reliability as a trading signal.
Pinbars are more effective on higher timeframes, such as the daily or weekly charts, but they can also be used on lower timeframes. The key is to ensure that the context supports the pinbar’s signal.

Once you’ve identified a pinbar, the next step is to interpret what it means for your trading. The interpretation will depend on whether the pinbar is bullish or bearish.
Bullish Pinbar Interpretation: A bullish pinbar suggests that the downtrend may be ending and that buyers are stepping in. This type of pinbar is often found at the bottom of a downtrend or at a key support level. When you see a bullish pinbar, it’s a signal that the market may reverse to the upside.
For example, suppose you’re analyzing a stock that has been in a downtrend and suddenly a bullish pinbar forms at a strong support level. This pinbar indicates that the sellers tried to push the price lower, but buyers stepped in forcefully, rejecting the lower prices and driving the price back up. This could be a sign to consider a long position as a reversal trading strategy, with a stop loss below the low of the pinbar.
Bearish Pinbar Interpretation: A bearish pinbar, on the other hand, indicates potential downside movement. It typically appears at the top of an uptrend or near a resistance level. This pinbar signals that buyers attempted to push the price higher, but were met with strong selling pressure, causing the price to drop back down.
Let’s say you’re observing a stock that has been trending upward. A bearish pinbar forms near a significant resistance level or a triple top like in the screenshot below. This pinbar suggests that the uptrend may be losing steam and that sellers are taking control. In this scenario, you might consider a short position, with a stop loss placed above the high of the pinbar.

Pinbars are versatile and can be used in various trading strategies. Here are two popular strategies that utilize the pinbar candlestick pattern:
Trend Continuation Strategy: In a trend continuation strategy, pinbars are used to confirm that the existing trend is likely to continue. For example, in an uptrend, you might look for bullish pinbars that form during retracements or pullbacks. These pinbars signal that the pullback is likely over and that the uptrend will resume.
Example Setup:

Reversal Strategy: The reversal strategy is based on the idea that pinbars can signal the end of a trend and the beginning of a new one. This strategy is particularly useful when trading near key support or resistance levels.
Example Setup:

Both strategies can be enhanced by combining pinbars with other technical indicators, such as moving averages, RSI, or Fibonacci levels, to increase the probability of a successful trade.
While pinbars are a powerful tool, they are not infallible. Here are some common mistakes traders make when using pinbars and how to avoid them:
Misinterpreting Pinbars: Not all candlesticks with long wicks are pinbars. It’s important to ensure that the candlestick meets the specific criteria of a pinbar before trading it. Additionally, the context in which the pinbar forms is crucial. A pinbar that forms in the middle of a trend without any significant support or resistance level nearby may not be reliable.
Overtrading Based on Pinbars Alone: Relying solely on pinbars for trading decisions can lead to overtrading and poor results. It’s essential to consider other factors, such as overall market conditions, other technical indicators, and risk management strategies, before making a trade.
The pinbar candlestick is a powerful tool in a trader’s arsenal. Whether you’re looking to capitalize on trend continuations or reversals, understanding how to identify and trade pinbars can significantly enhance your trading strategy. However, like any trading tool, pinbars should be used in conjunction with other analyses and indicators to maximize their effectiveness.
By mastering the pinbar candlestick pattern and integrating it into your trading plan, you can improve your ability to anticipate market movements and make more informed trading decisions. Remember, practice and experience are key—so take the time to backtest your strategies and refine your approach before risking real capital. Happy trading!
external link:


We have been trading supply and demand strategies for over ten years, and they have stood the test of time remarkably well. Supply and demand is...

3 min read
Choosing the right trading journal is essential for traders wanting to analyze performance, refine strategies, and improve consistency. In this...

3 min read
“95% of all traders fail” is the most commonly used trading related statistic around the internet. But no research paper exists that proves this...