Supply and Demand Trading in 2026
We have been trading supply and demand strategies for over ten years, and they have stood the test of time remarkably well. Supply and demand is...
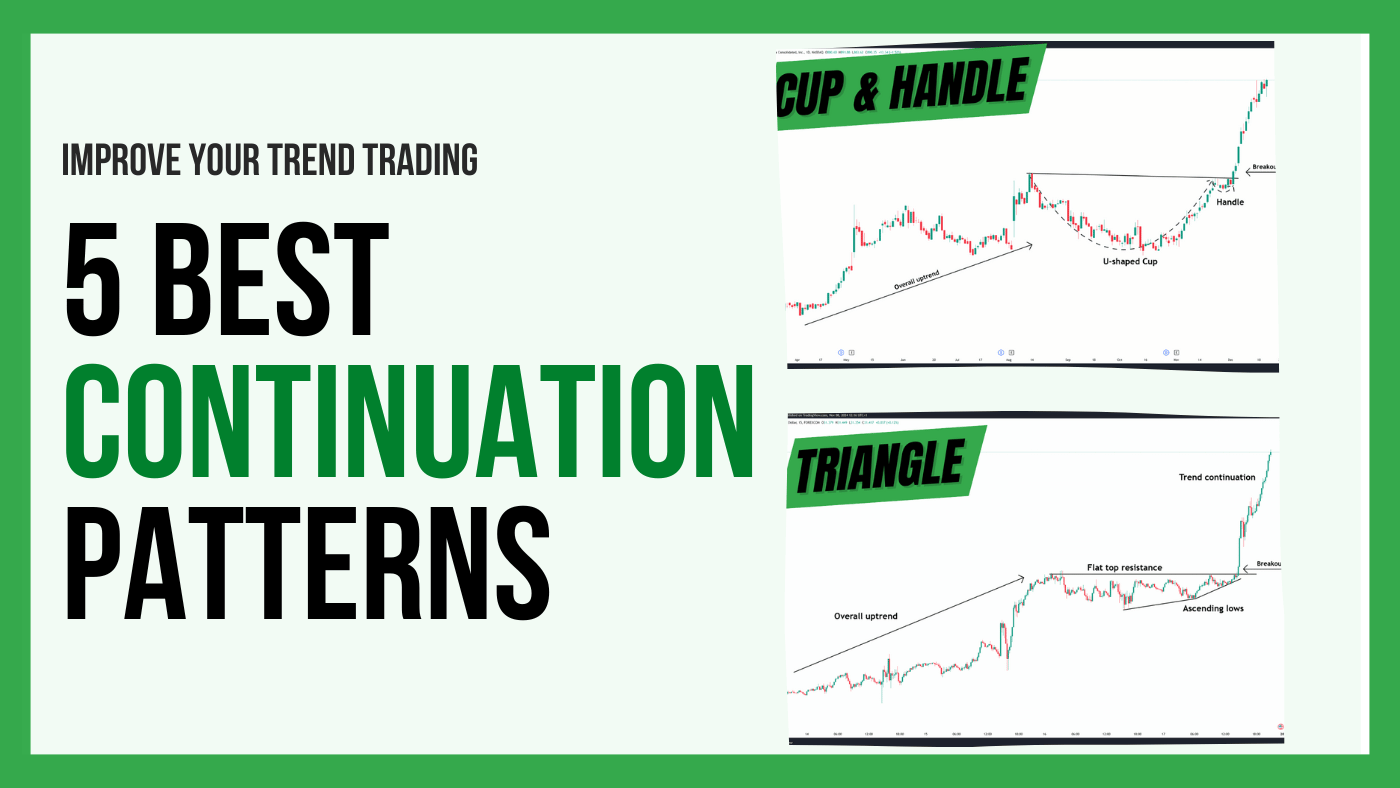
Trading successfully depends on recognizing market structures and patterns that indicate whether an existing trend will continue. Trend continuation patterns are important for traders looking to capitalize on ongoing market momentum. This guide will cover the most effective trend continuation patterns, shedding light on how traders can use them to identify lucrative trading opportunities.
Trend continuation patterns are chart formations that signal a temporary pause in a prevailing trend, suggesting that the trend will likely resume after the pattern completes. These patterns matter because they help traders spot opportunities to join a trend after a brief consolidation phase, improving entry timing and minimizing the risk of buying or selling at the wrong time.
In the following we are going to cover the most important and most popular continuation patterns. The key for finding the best continuation pattern is the overall trend context in which the patterns occur. When you spot an ascending triangle, for example, you want it to form after a previous bullish trending phase. Most traders forget this important aspect and then run into problems with their pattern trading because they trade patterns in the wrong context. Thus, making sure you analyze the overall trend context during which patterns form is the most important aspect of finding the best continuation patterns.
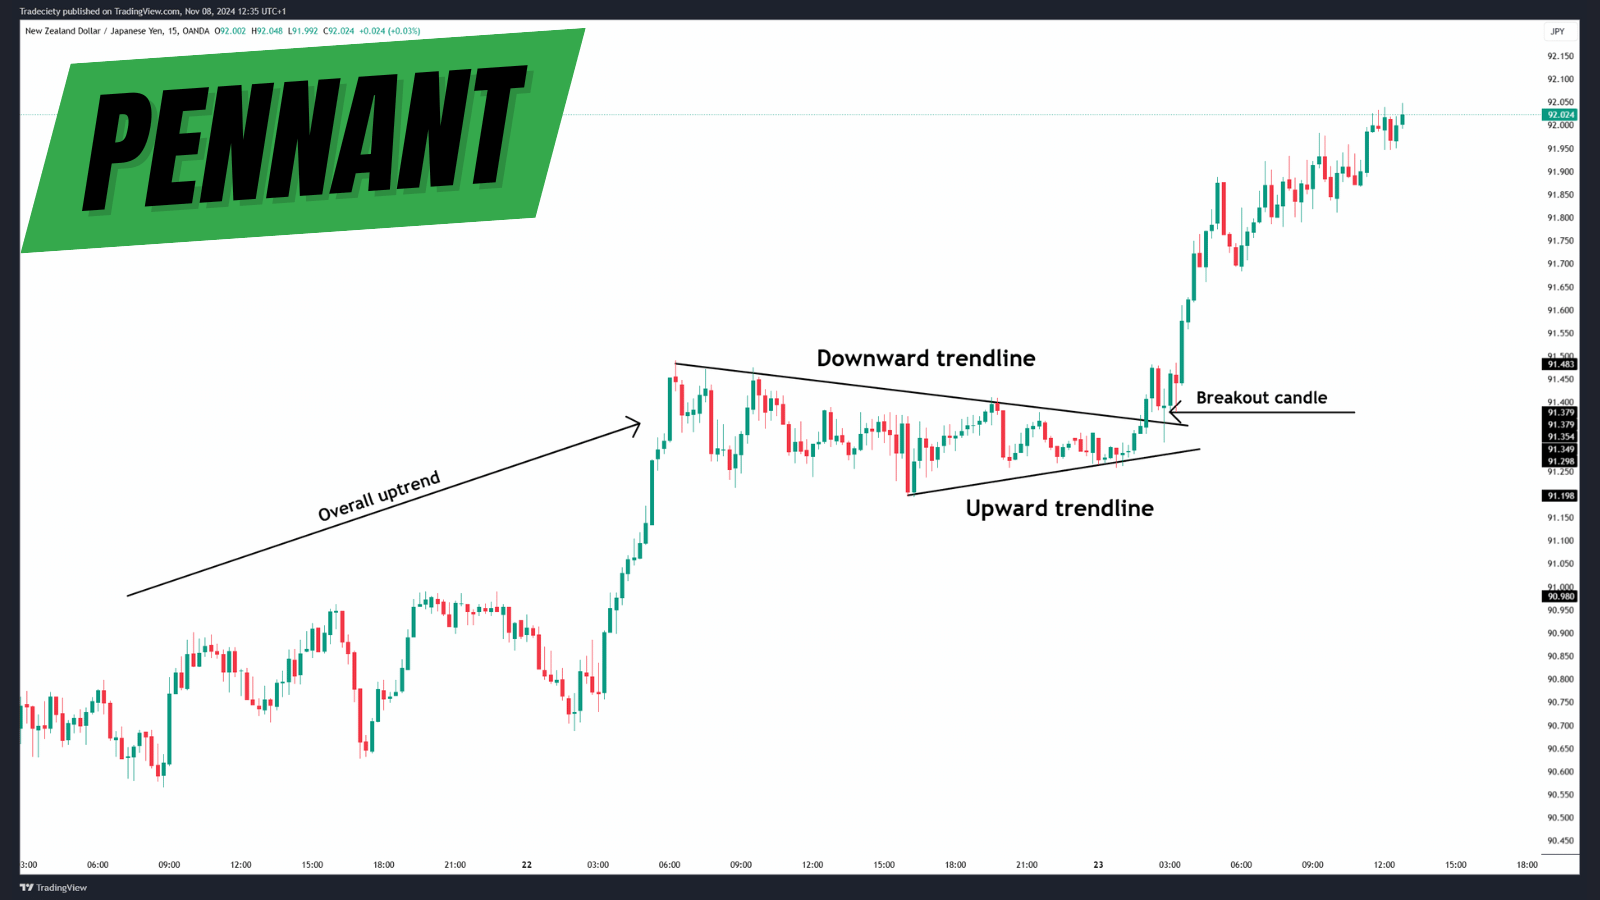
Description: Flags and pennants are short-term continuation patterns that form after a sharp price movement, known as the flagpole. Flags are marked by parallel support and resistance trend lines, while pennants feature converging trendlines, resembling a small symmetrical triangle.
Visual Characteristics:
Flags: A pullback in the form of parallel trend lines.

Pennants: A smaller, converging shape resembling a wedge, or a symmetrical triangle.
Entry and Exit Points:
Entry: Traders typically enter a trade when the price breaks out of the flag or pennant in the direction of the prior trend.
Exit: A common strategy is to set the profit target equal to the length of the flagpole.
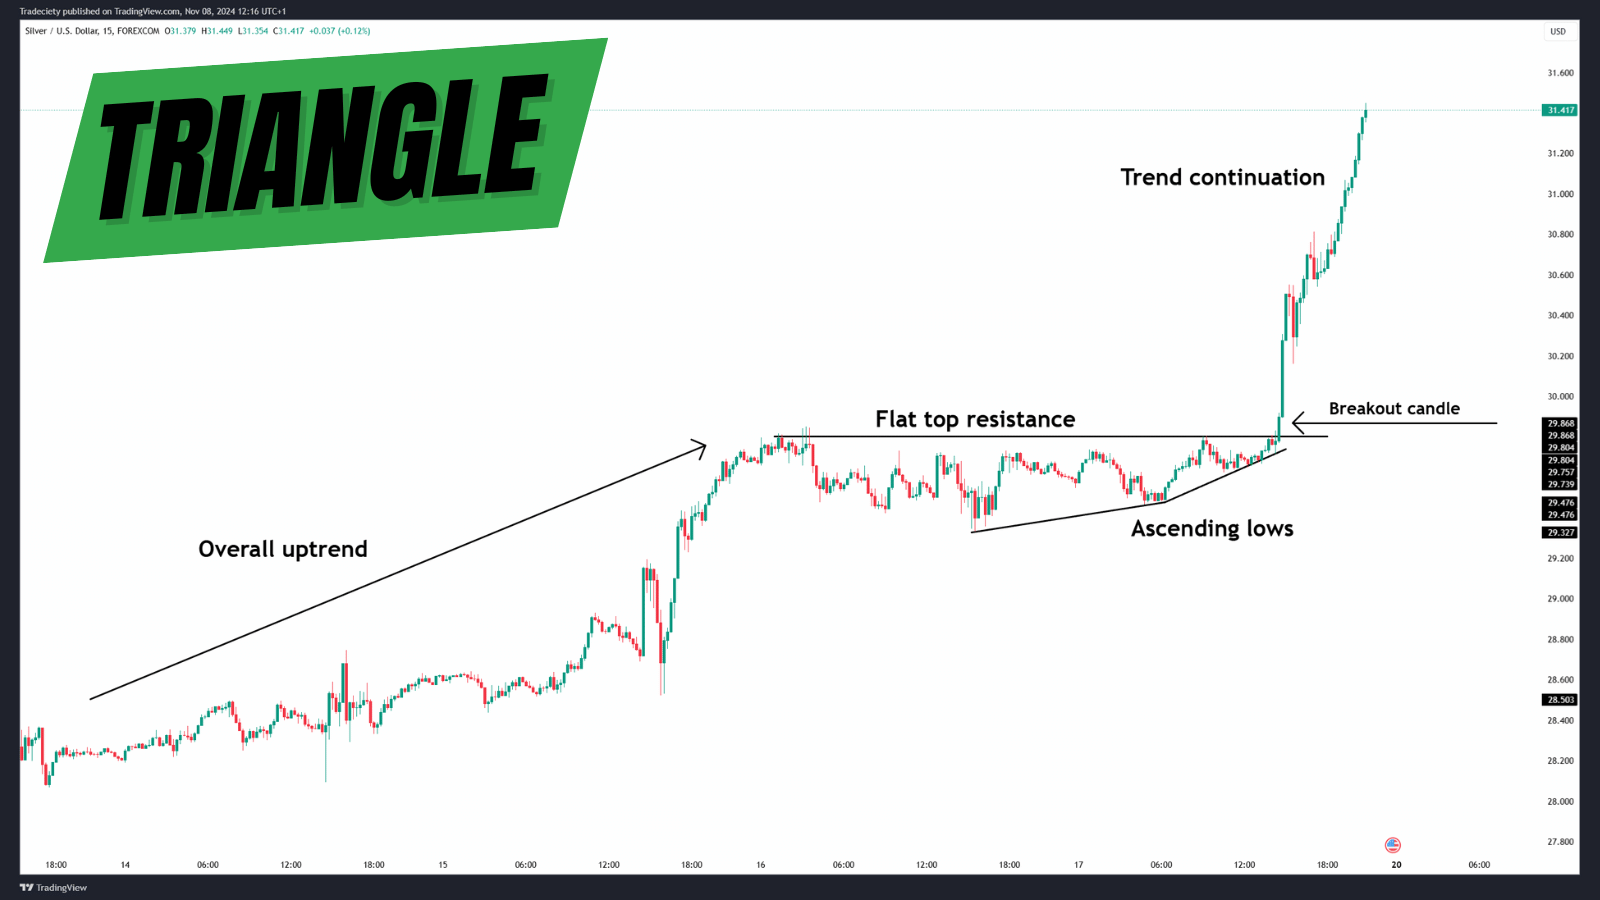
Explanation: Ascending triangles form during uptrends and are characterized by a horizontal resistance line and an upward-sloping support line. Descending triangles appear in downtrends with a horizontal support line and a downward-sloping resistance line.
Breakout Confirmation:
A breakout from the upper or lower boundary confirms the continuation.
Confirmations are stronger with a surge in volume.
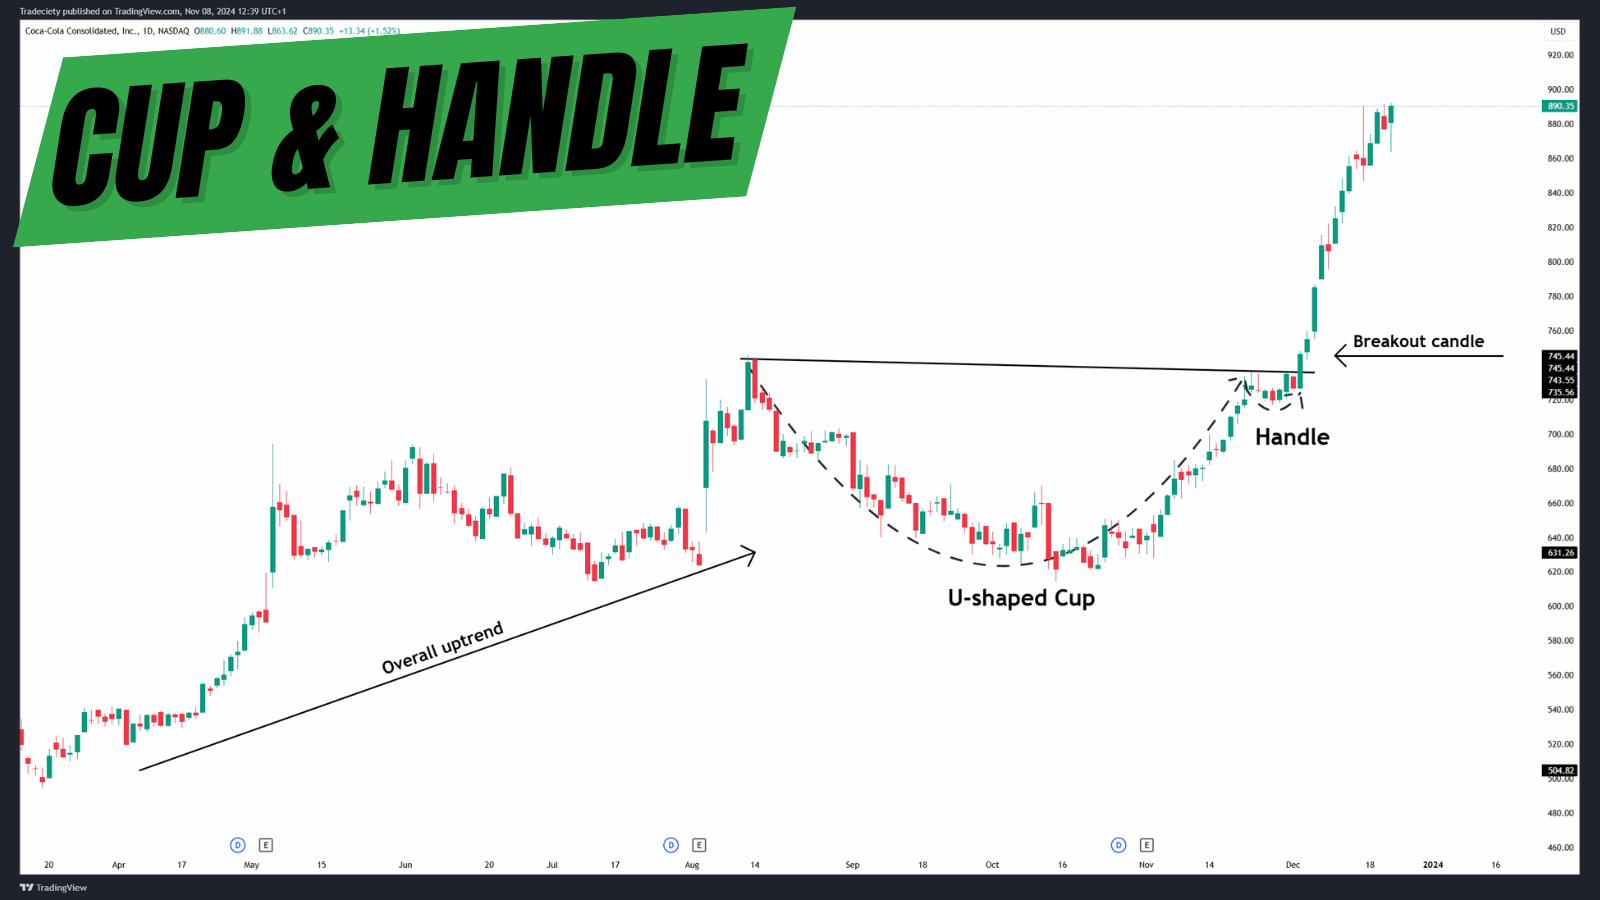
Formation: The cup and handle pattern is a bullish continuation setup where the price forms a "U"-shaped cup followed by a small downward handle. This pattern signals that the market has consolidated and is ready to resume its upward movement.
The handle part of the pattern is the most important signal because it shows that the pressure it building underneath the resistance when the price does not pull back lower. Therefore, the low of the handle should be much higher then the low of the cup.
Duration:
Short-term: Can form over days or weeks.
Long-term: Can span several months for more significant price action.
Entry Strategy:
Entry: Place a buy order above the handle’s resistance.
Stop-Loss: Positioned below the handle’s low to minimize risk.
Take-Profit: Often set at a level equal to the cup’s depth.
Overview: Rectangles are formed when the price consolidates sideways between parallel support and resistance levels, signifying a pause in the trend.
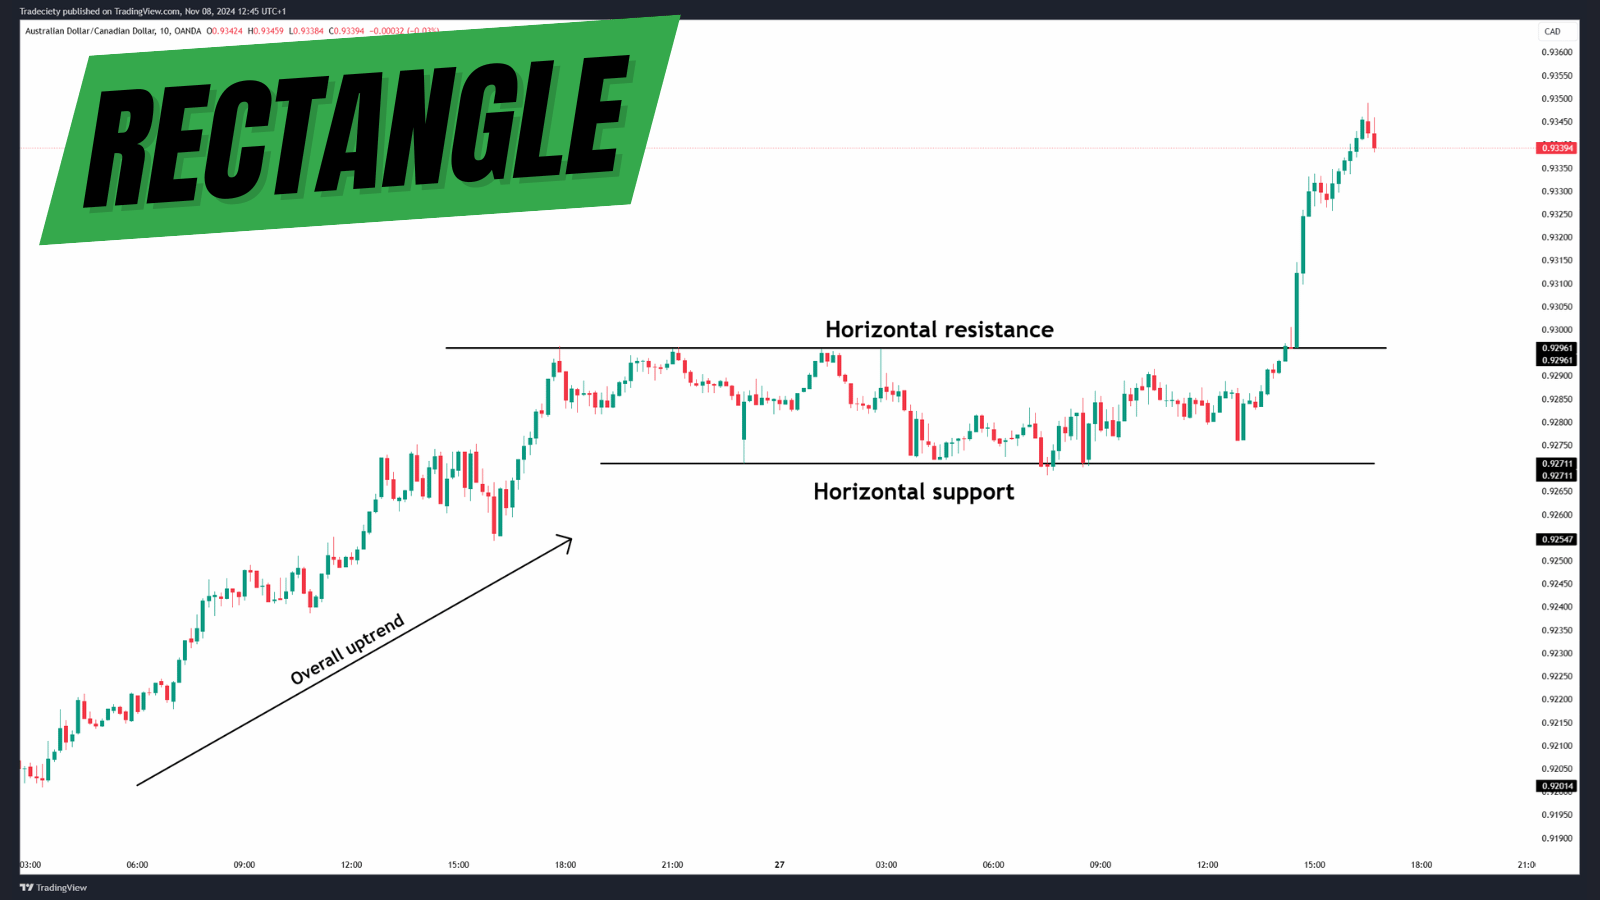
Trade Triggers:
Entry is confirmed when the price breaks above or below the rectangle pattern in the direction of the trend.
Risk Management Tips:
Always wait for confirmation before entering a trade. False breakouts are common in rectangle patterns, so use volume as an additional confirmation tool.
Description: This pattern, usually associated with reversals, can sometimes indicate a continuation during an uptrend. It forms when the price makes three swing lows, with the middle one being the lowest (the head) and the other two (the shoulders) being higher but nearly equal.
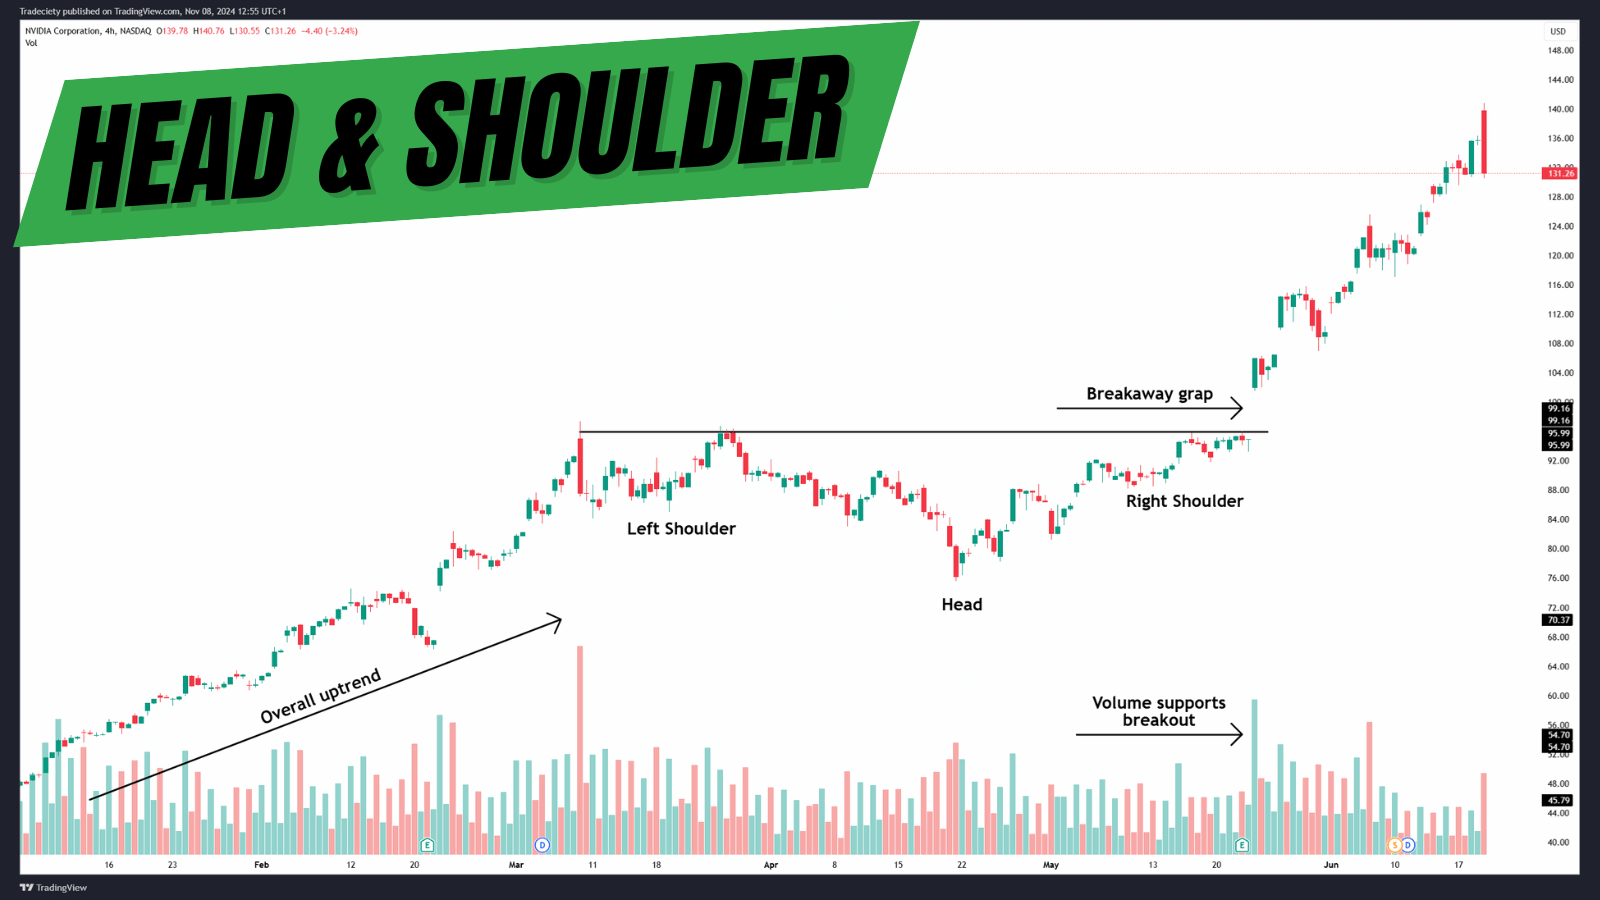
Continuation Context:
In an uptrend, the inverted head and shoulders pattern can act as a consolidation before the trend resumes.
Pattern Formation:
The neckline, formed by connecting the peaks of the two shoulders, serves as the breakout level. A successful breakout above this line signals the continuation.
Entry Strategy:
Enter when the price breaks above the neckline, confirming the pattern.
Stop-Loss: Place a stop-loss just below the right shoulder for protection.
Formation: When, during an uptrend, a small inside daily candle forms, a potential next-day-breakout, can be a strong continuation signal. The pattern of momentum-inside-momentum candlestick can often be observed during a trending market.
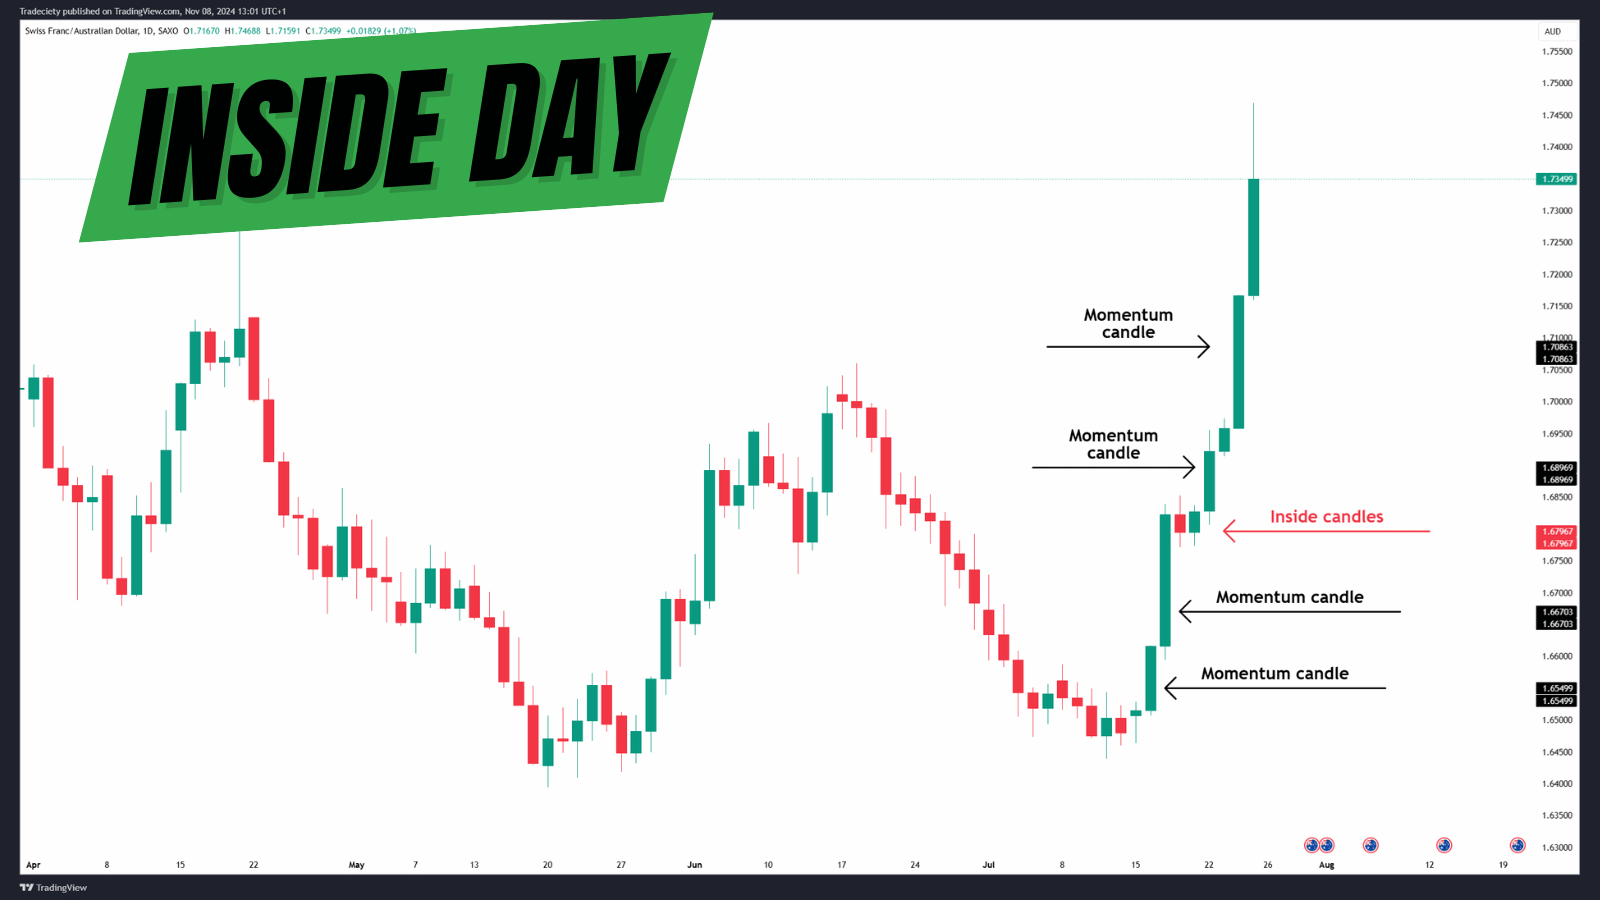
Candle size:
The closer the price closes to the high of the previous momentum candle, the better the overall signal. If the price is able to push against the previous momentum candle in a strong way, it signals too much trend opposition.
Entry Strategy:
After the daily inside candle has fully closed, traders go to a lower timeframe to look for short-term entry patterns. Trader can choose any of the previously discussed continuation patterns and wait for them to show up on the lower timeframe after the inside candle has closed.
Support and resistance levels are essential for defining the pattern’s structure because they typically form the boundaries of trend continuation patterns.
Identifying trendlines also helps confirm the pattern's boundaries and potential breakout points when dealing with patterns that do not follow horizontal boundaries.
In an uptrend, observing higher lows approaching a resistance level can indicate that pressure is building. This observation is crucial for patterns like triangles and cup and handles.
Time Frames:
Patterns like flags and triangles can be observed in various time frames, from 1-hour to daily charts.
Use a higher time frame (HTF) to establish trend direction and a lower time frame (LTF) to find entry opportunities using continuation patterns.
Entry and Exit Strategies:
Typically, traders wait for a complete candle close above the pattern boundary before executing a trade. Pending order trading strategies are more prone to false signals but some traders may choose to place entry orders slightly above breakout levels.
Set stop-loss orders below recent swing lows (in uptrends) or highs (in downtrends) for effective risk management. The close the stop loss to the breakout level, the more vulnerable the stop loss to short-term volatility.
Define profit targets based on the measured move principle, such as the height of the pattern. Alternatively, using a fixed reward:risk ratio based on the stop loss distance is another great approach to work out targets.
Trend continuation patterns are invaluable tools for traders aiming to ride existing trends with more confidence and precision. Patterns like flags, pennants, triangles, cups and handles, and rectangles offer clear signals when correctly identified and traded in the correct higher timeframe context.
The huge benefit of pattern trading lies in their high level of objectivity. Patterns should be obvious when they form on your charts, removing a lot of uncertainty and subjectivity that other trading approaches bring.
Incorporating these patterns into your trading strategy and practicing them in a demo environment or by backtesting historical data can improve your technical analysis skills. Take time to observe, practice, and journal your findings for consistent growth in your trading journey.
external link:


We have been trading supply and demand strategies for over ten years, and they have stood the test of time remarkably well. Supply and demand is...

3 min read
Choosing the right trading journal is essential for traders wanting to analyze performance, refine strategies, and improve consistency. In this...

3 min read
“95% of all traders fail” is the most commonly used trading related statistic around the internet. But no research paper exists that proves this...