Supply and Demand Trading in 2026
We have been trading supply and demand strategies for over ten years, and they have stood the test of time remarkably well. Supply and demand is...
2 min read
Rolf
Jul 24, 2024 7:34:27 AM

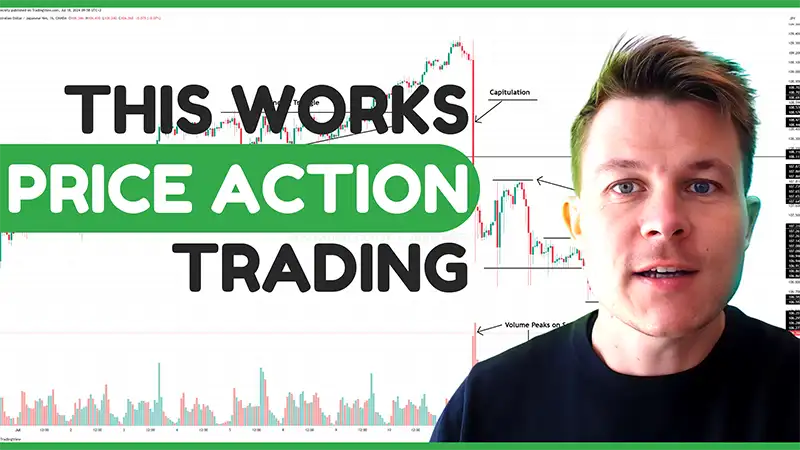
I just recorded a new price action video and here are the 6 most important takeaways from the video.
Higher Time Frames: Begin by analyzing higher time frames (daily, weekly) to identify key levels and market structures. This provides a macro view of the market, highlighting significant support and resistance areas.
Lower Time Frames: Move to lower time frames (1-hour, 15-minute) to refine entries and develop precise trading plans. The micro view helps pinpoint optimal entry and exit points.
Identifying the Double Top: Look for a double top pattern in the higher time frame. This pattern indicates a potential market reversal, especially if the support level breaks.
Retesting the Broken Support: Once the support level breaks, the market often retests this level as new resistance. Observe for lower highs during this retest, signaling weakness and confirming bearish pressure.
Entry Strategy: Enter short positions after the market confirms the resistance retest and displays signs of continued bearish momentum.
Pattern Recognition: On lower time frames, identify the head and shoulders pattern. This classic reversal pattern suggests a change in trend direction.
Avoiding the First Breakout: The first breakout from the neckline is typically noisy and low probability. Wait for a cleaner, more reliable setup.
Second Retest and Stop Run: Wait for the market to retest the neckline and observe for stop runs. Enter trades after this second retest, especially when the market breaks into fresh lows, indicating strong bearish pressure.
Recognizing Capitulation: Identify significant market reversals marked by sharp price drops, erasing weeks of gains. This could be news-driven or natural price action.
Volume Spikes: Use volume analysis to confirm bearish sentiment. Increased volume during selling phases indicates strong market participant activity.
Trading the Breakout: Enter trades when the market breaks into fresh lows with rising volume, confirming the bearish trend.
Higher Time Frame Setup: Identify the cup and handle pattern on higher time frames. This continuation pattern suggests a bullish trend.
Lower Time Frame Confirmation: Confirm the pattern on lower time frames. Look for a breakout signal and validate it with volume spikes.
Entry Strategy: Enter trades during the breakout of the handle, supported by strong volume, indicating momentum and trend continuation.
Identifying Demand Areas: Spot significant demand areas on higher time frames. These areas often lead to strong bullish reactions.
Microstructure Changes: On lower time frames, observe how the market reacts to these supply and demand areas. Look for triple taps or double bottoms, indicating decreasing selling pressure.
Waiting for Acceleration: Enter long positions only after the market accelerates away from the retest, confirming strong buying interest and support.
Price action trading requires patience, keen observation, and the ability to interpret market signals accurately. By combining top-down analysis, pattern recognition, and volume analysis, traders can filter out low-probability trades and focus on setups with higher chances of success. Implementing these strategies can lead to more consistent profits and a deeper understanding of market dynamics.

We have been trading supply and demand strategies for over ten years, and they have stood the test of time remarkably well. Supply and demand is...

3 min read
Choosing the right trading journal is essential for traders wanting to analyze performance, refine strategies, and improve consistency. In this...

3 min read
“95% of all traders fail” is the most commonly used trading related statistic around the internet. But no research paper exists that proves this...