Supply and Demand Trading in 2026
We have been trading supply and demand strategies for over ten years, and they have stood the test of time remarkably well. Supply and demand is...
The Cup and Handle pattern is a bullish trend continuation pattern that typically signals a strong upward movement. It was popularized by William J. O'Neil in his book "How to Make Money in Stocks" who allegedly realized a return of 5000% over 25 years.
This trend continuation pattern is primarily used in combination with volume analysis and forms after a significant price rally. When properly identified, it can offer traders a high-probability entry point for long positions as continuation trades.
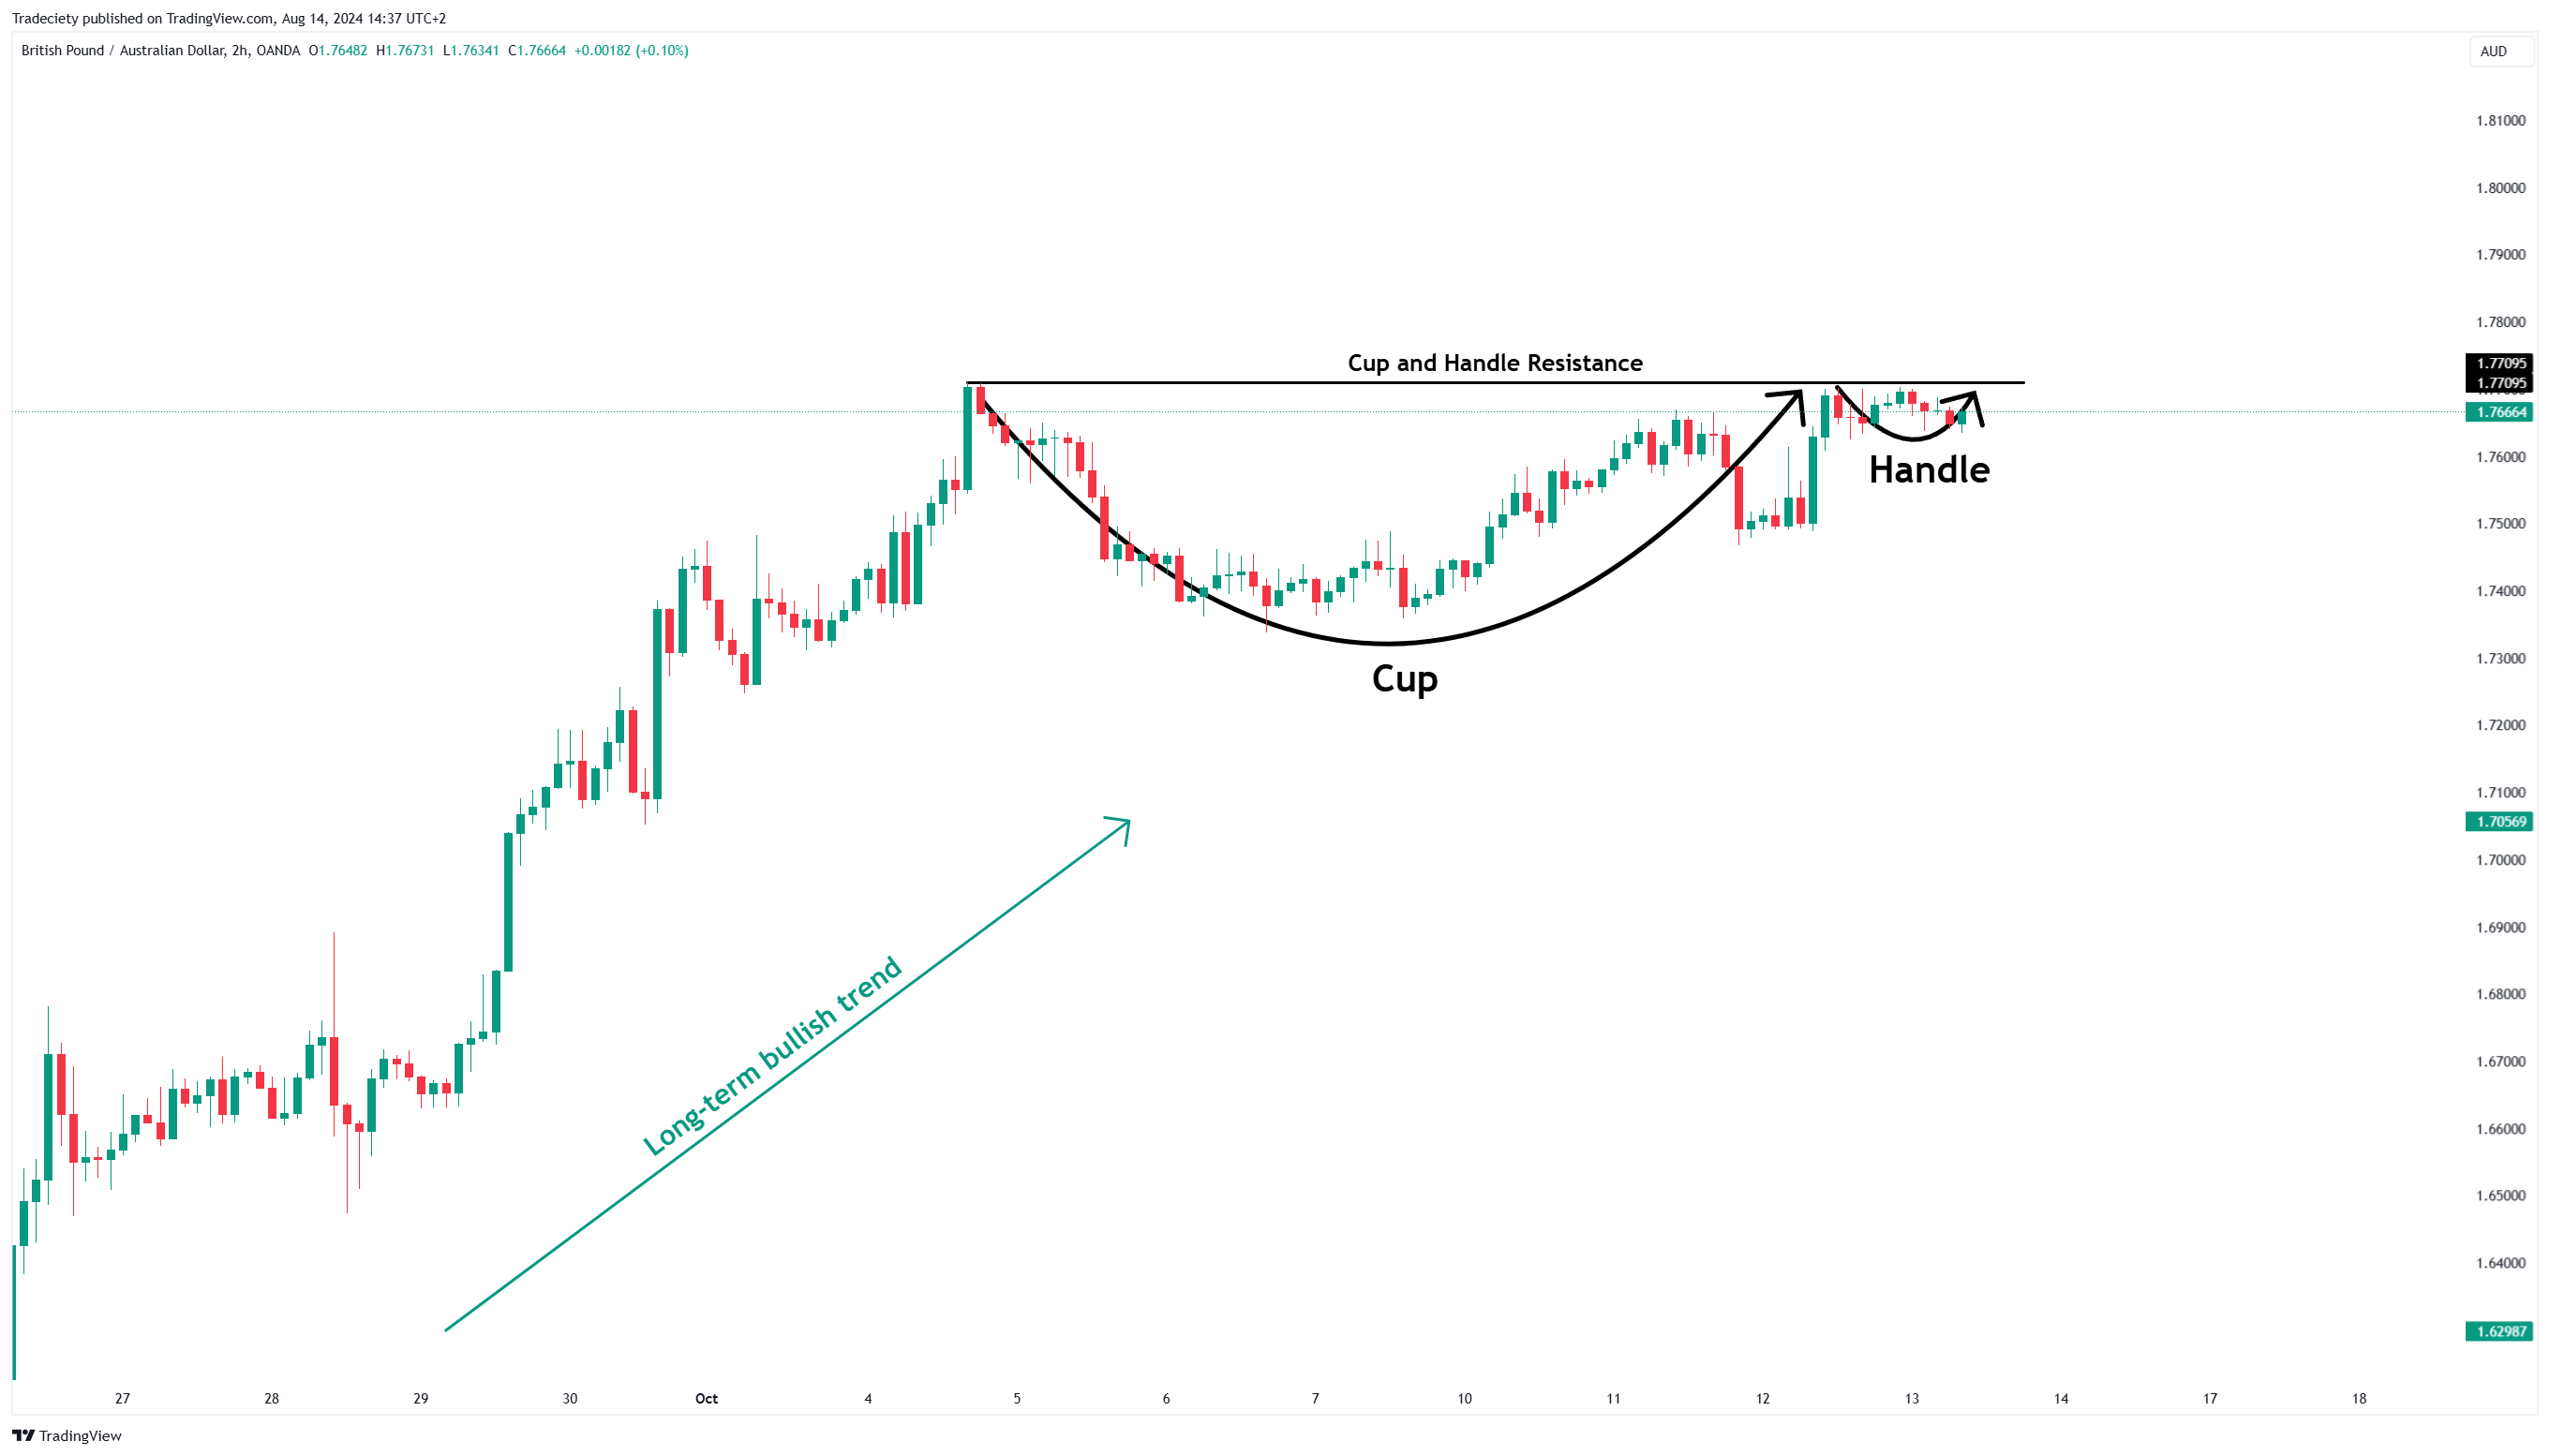
The Cup Formation: The cup part of the pattern is characterized by a U-shaped curve. It starts with a price decline, followed by a period of stabilization at the bottom, and ends with a rise back to the previous high. The curve should be smooth and rounded, rather than a sharp "V" shape, as this indicates a more stable accumulation period.
The Handle Formation: After the cup is formed, the handle appears as a short period of consolidation or slight pullback. This handle signals a momentary pause in the upward trend before the price breaks out to new highs.

For the Cup and Handle pattern to be valid, certain criteria must be met:
Duration: The cup typically forms over a period of 1 to 6 months, while the handle may take 1 to 4 weeks.
Depth: The depth of the cup should ideally be shallow, around 12% to 33% of the previous price rise. A deeper cup may still be valid, but it can indicate more volatility.
Volume: Volume tends to decrease during the first half of the cup and the handle’s formation.

Bullish Cup and Handle: This is the classic version of the pattern, signaling a continuation of an upward trend.
Bearish Cup and Handle: Although less common, an inverted version of the pattern can occur, signaling a downward continuation.

Spotting a Cup and Handle pattern in real-time charts requires a keen eye and a bit of practice. The pattern should look like a rounded cup followed by a smaller dip or sideways movement forming the handle. The key is to focus on the overall shape and ensure that the curve of the cup is smooth and well-formed.
Common Misidentifications: Traders often mistake a sharp "V" shape for a cup, but this indicates a different market behavior. The cup should be more rounded, signifying a gradual shift from sellers to buyers.
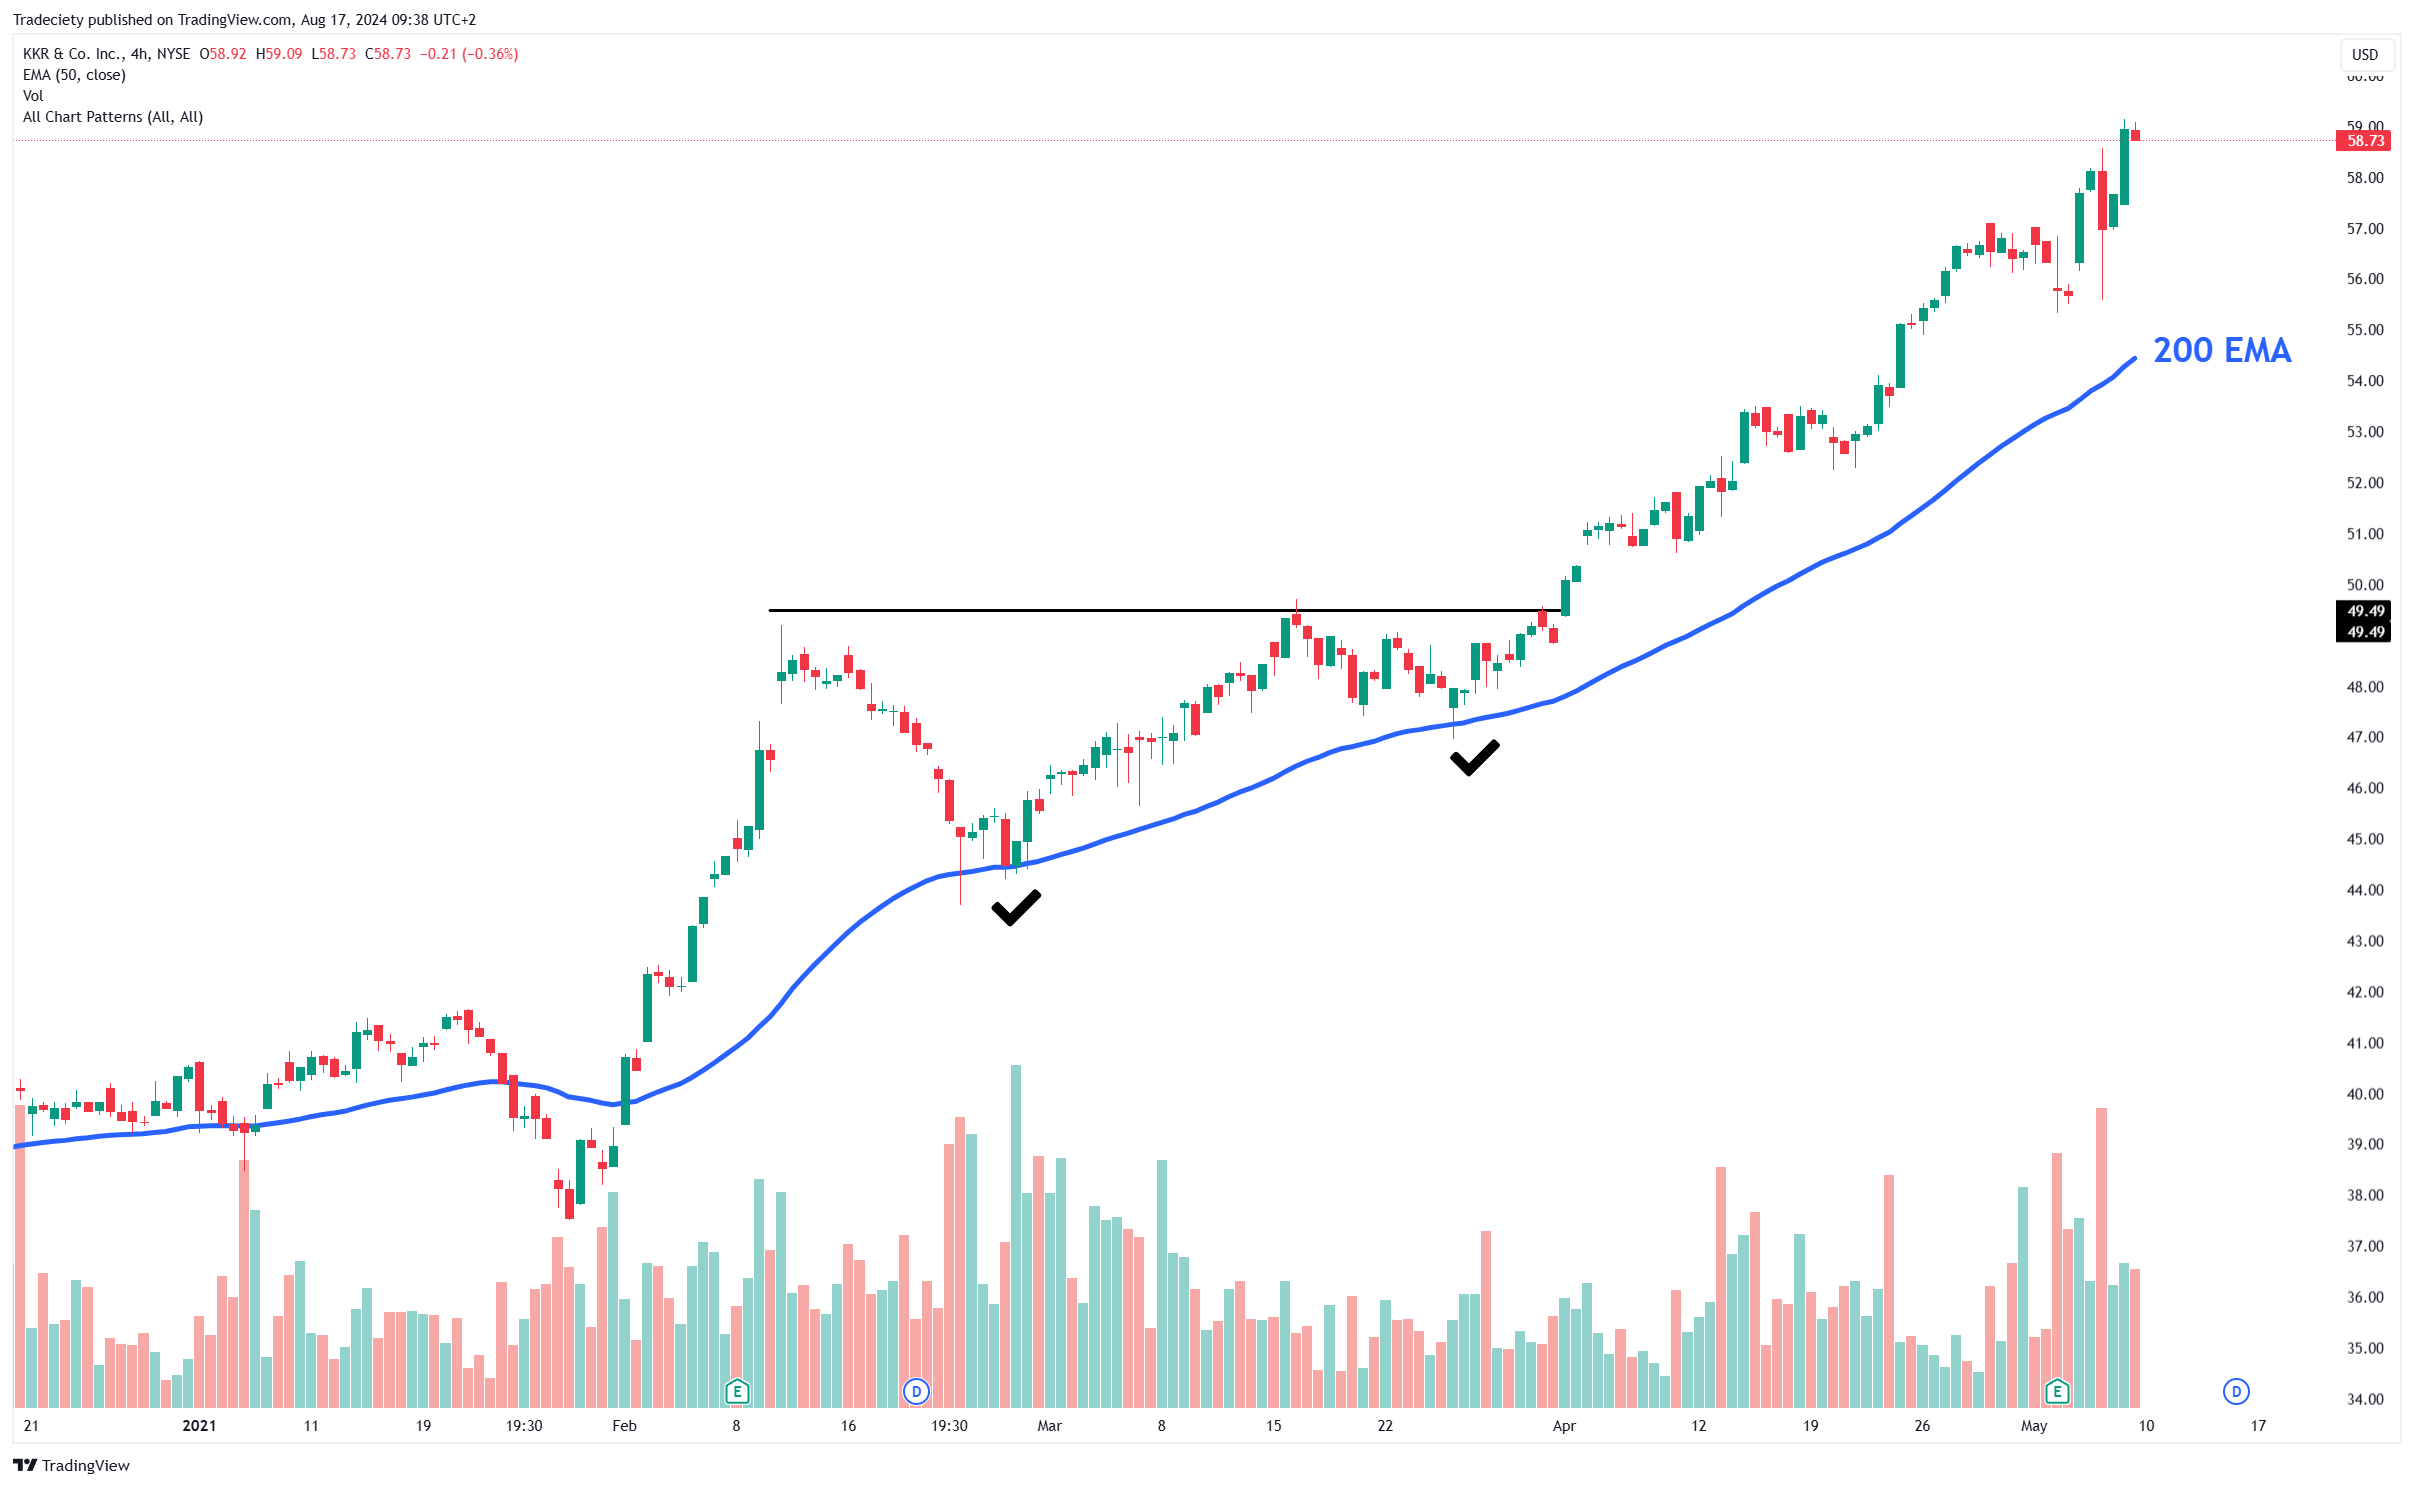
Moving averages are a valuable tool for confirming the Cup and Handle pattern. Typically, traders use the 50-day and 200-day moving averages to identify the overall trend and provide support or resistance levels. During the cup formation, the price often moves towards or slightly below the 50-day moving average, which acts as a dynamic support level. The 200-day moving average, being a longer-term indicator, helps confirm that the broader trend remains intact. If the price stays above these moving averages throughout the pattern, it reinforces the strength of the potential breakout.
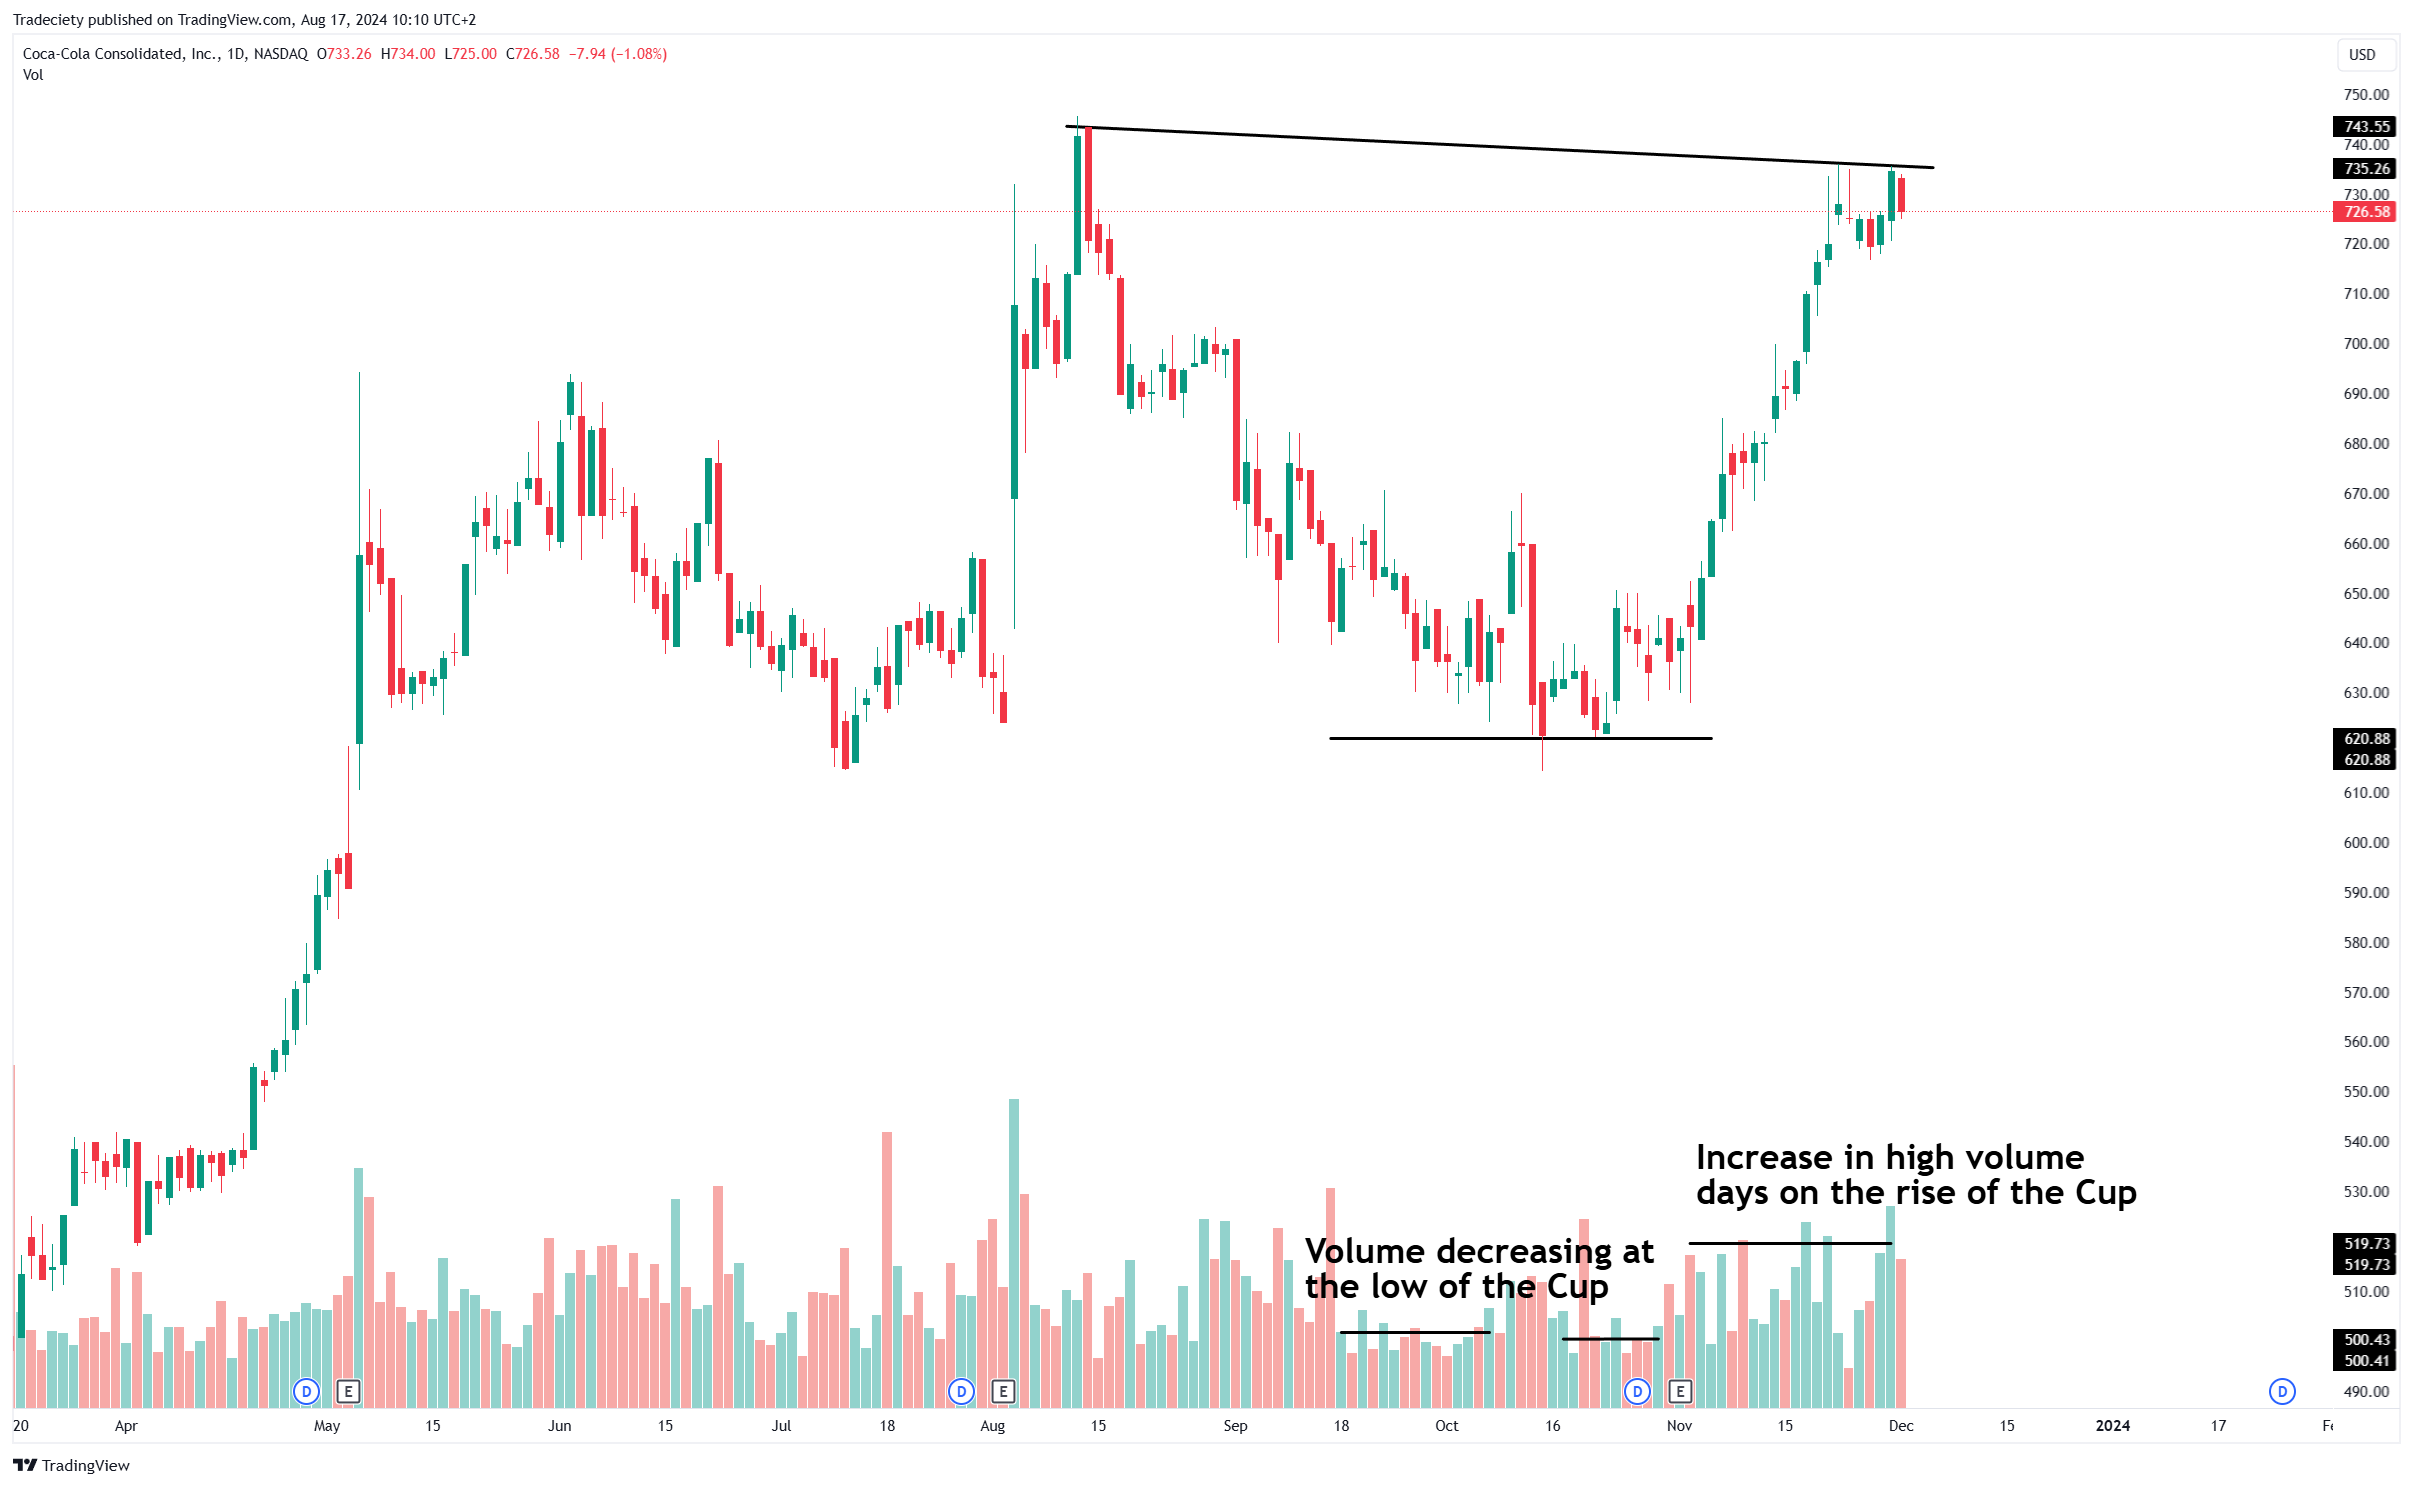
Volume analysis is a crucial aspect of identifying and confirming the Cup and Handle pattern. It provides insight into the strength and sustainability of the price movement associated with the pattern. Understanding how volume behaves during the formation of the cup, the handle, and the breakout can significantly improve the accuracy of your trades.
As the cup forms, you typically observe a decrease in trading volume during the first half of the cup. This decline in volume indicates that the market is stabilizing after the initial price drop, with fewer participants willing to sell at lower prices. The decrease in volume during this phase is a sign that selling pressure is diminishing, and the market is beginning to find support. As the price starts to rise again, heading toward the previous high, the volume may gradually increase, but it often remains below the levels seen during the initial decline.
This gradual increase in volume during the upward movement of the cup suggests that buyers are slowly returning to the market, building momentum.
The handle is characterized by a brief consolidation period or slight pullback. During this phase, volume typically declines further, reflecting a temporary pause in the buying momentum. This decline is normal and indicates that the market is taking a breather before the next move. The key here is that the handle should form on light volume, which signals that sellers are not strongly committed, and the pullback is more about profit-taking than a reversal in sentiment.
If volume spikes significantly during the handle formation, it could be a warning sign that the pattern is failing or that the market is facing unexpected resistance. Traders should be cautious in such scenarios and look for additional confirmation before considering a trade.
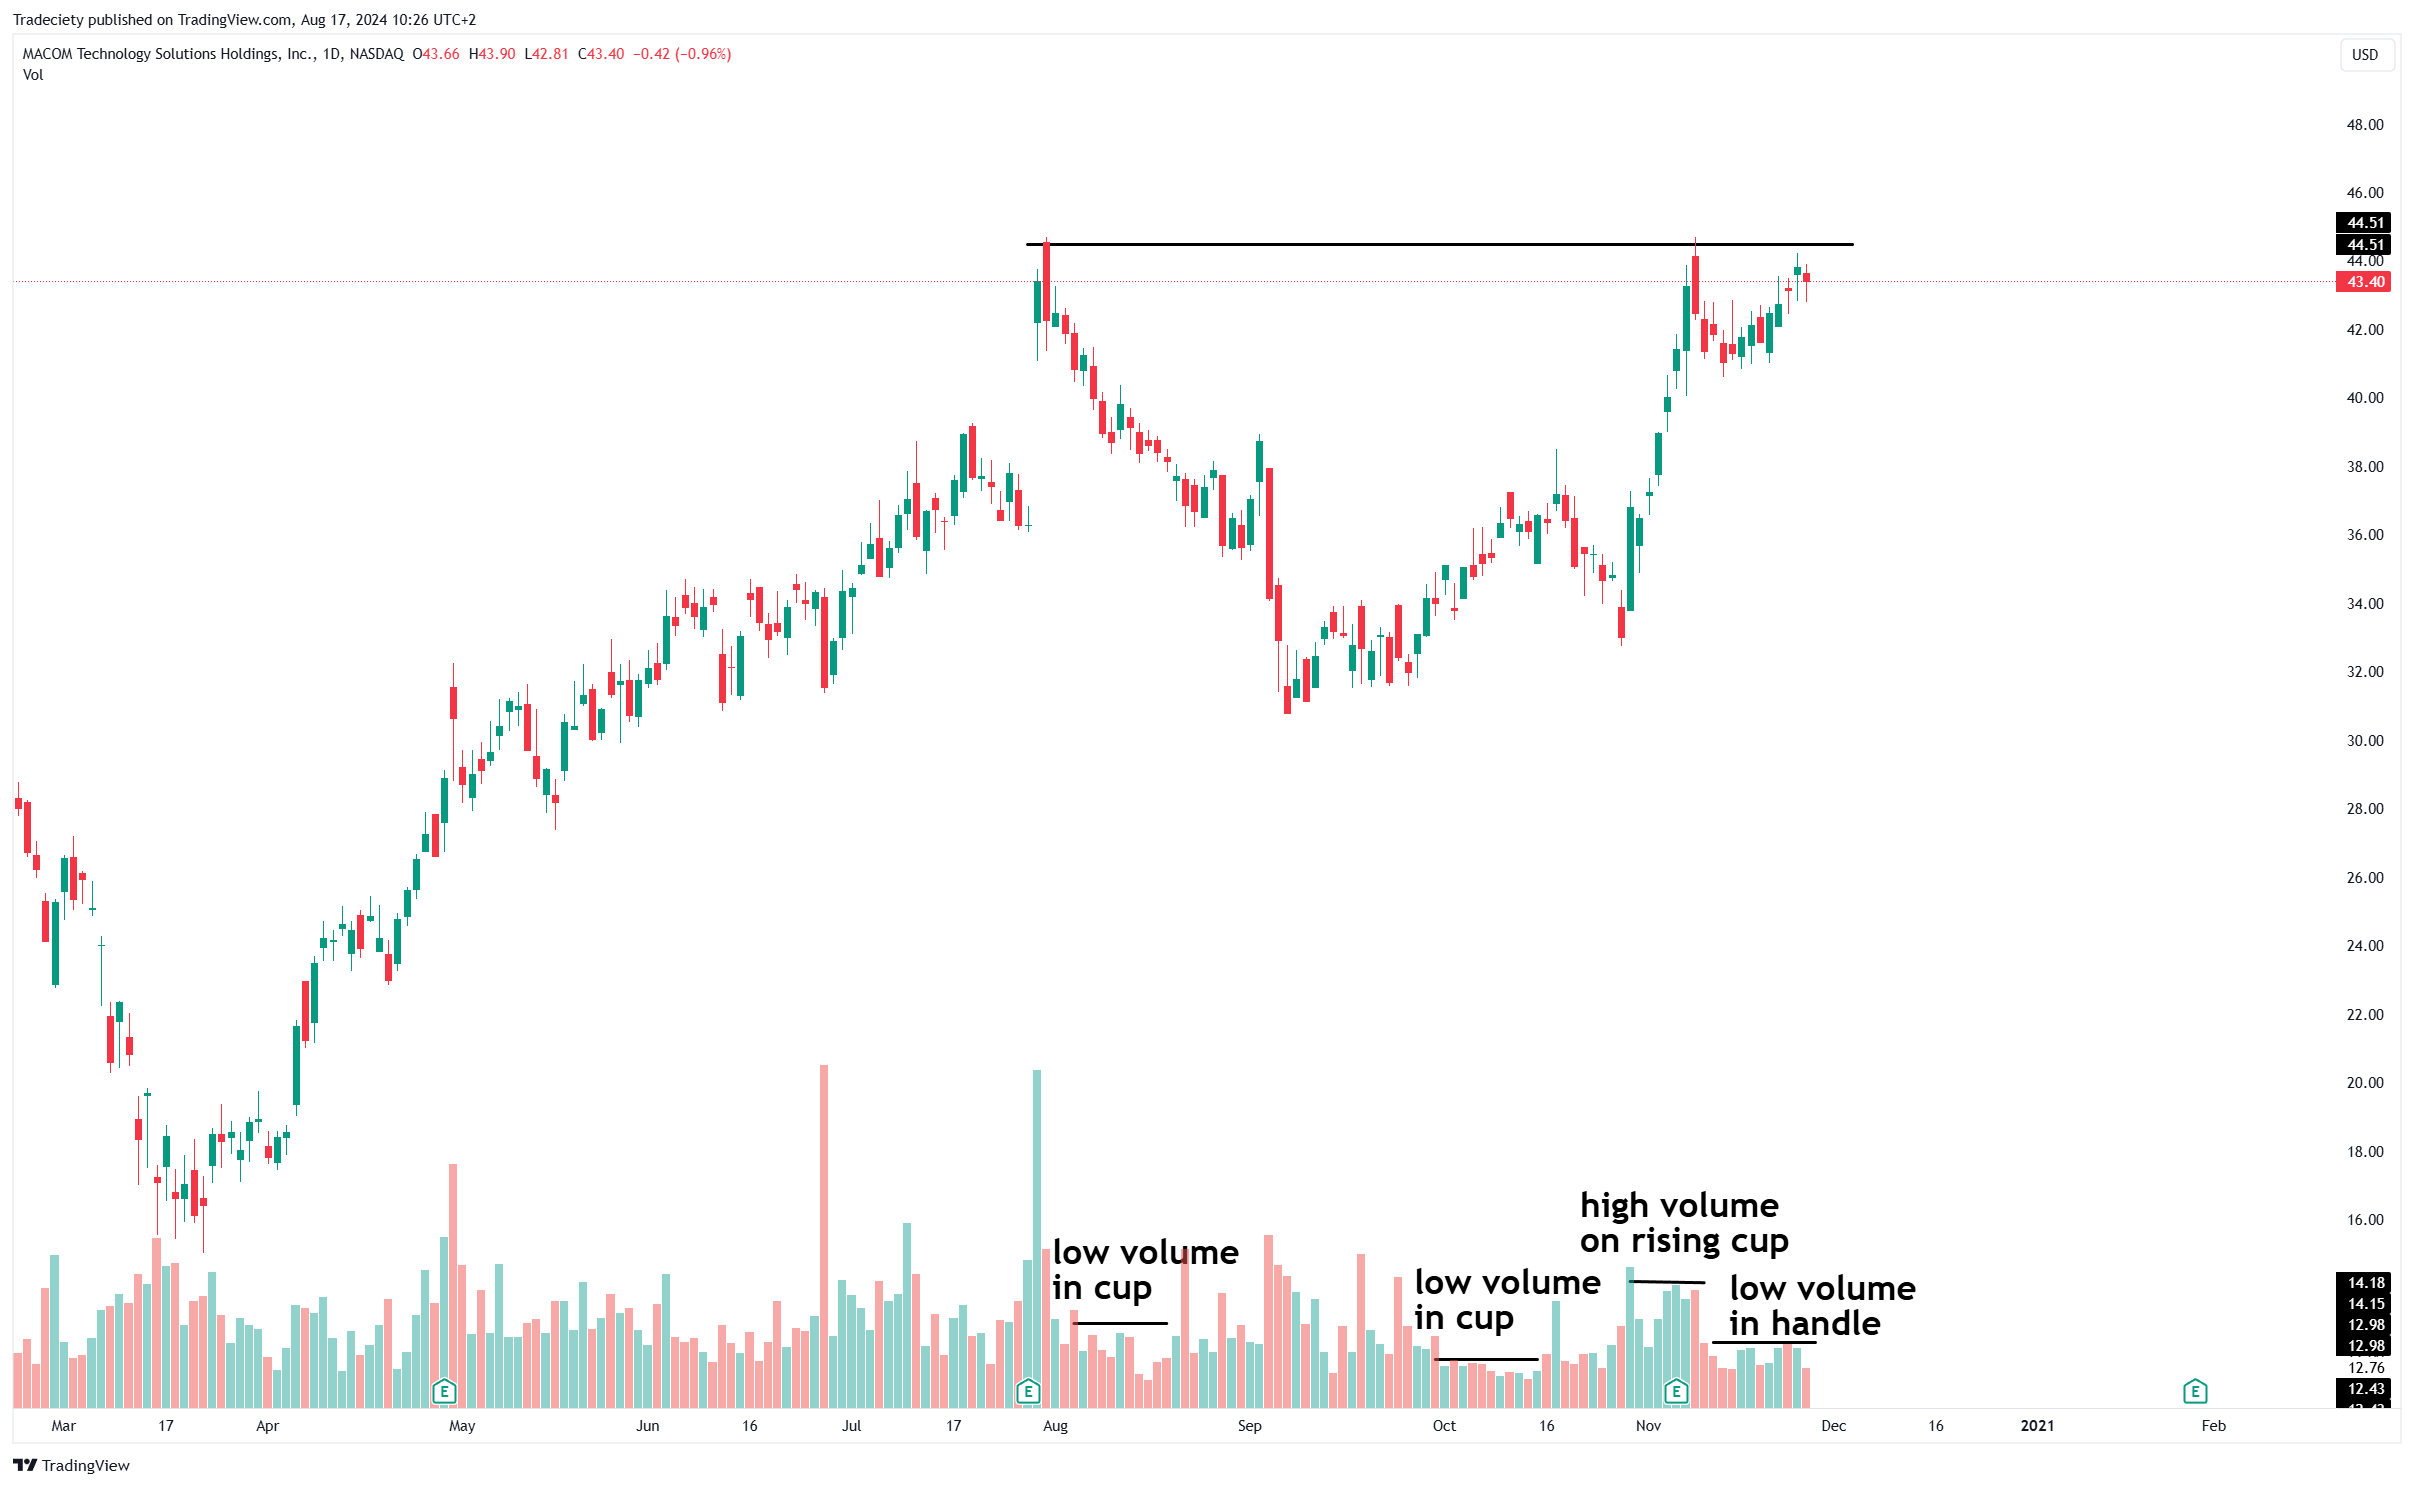
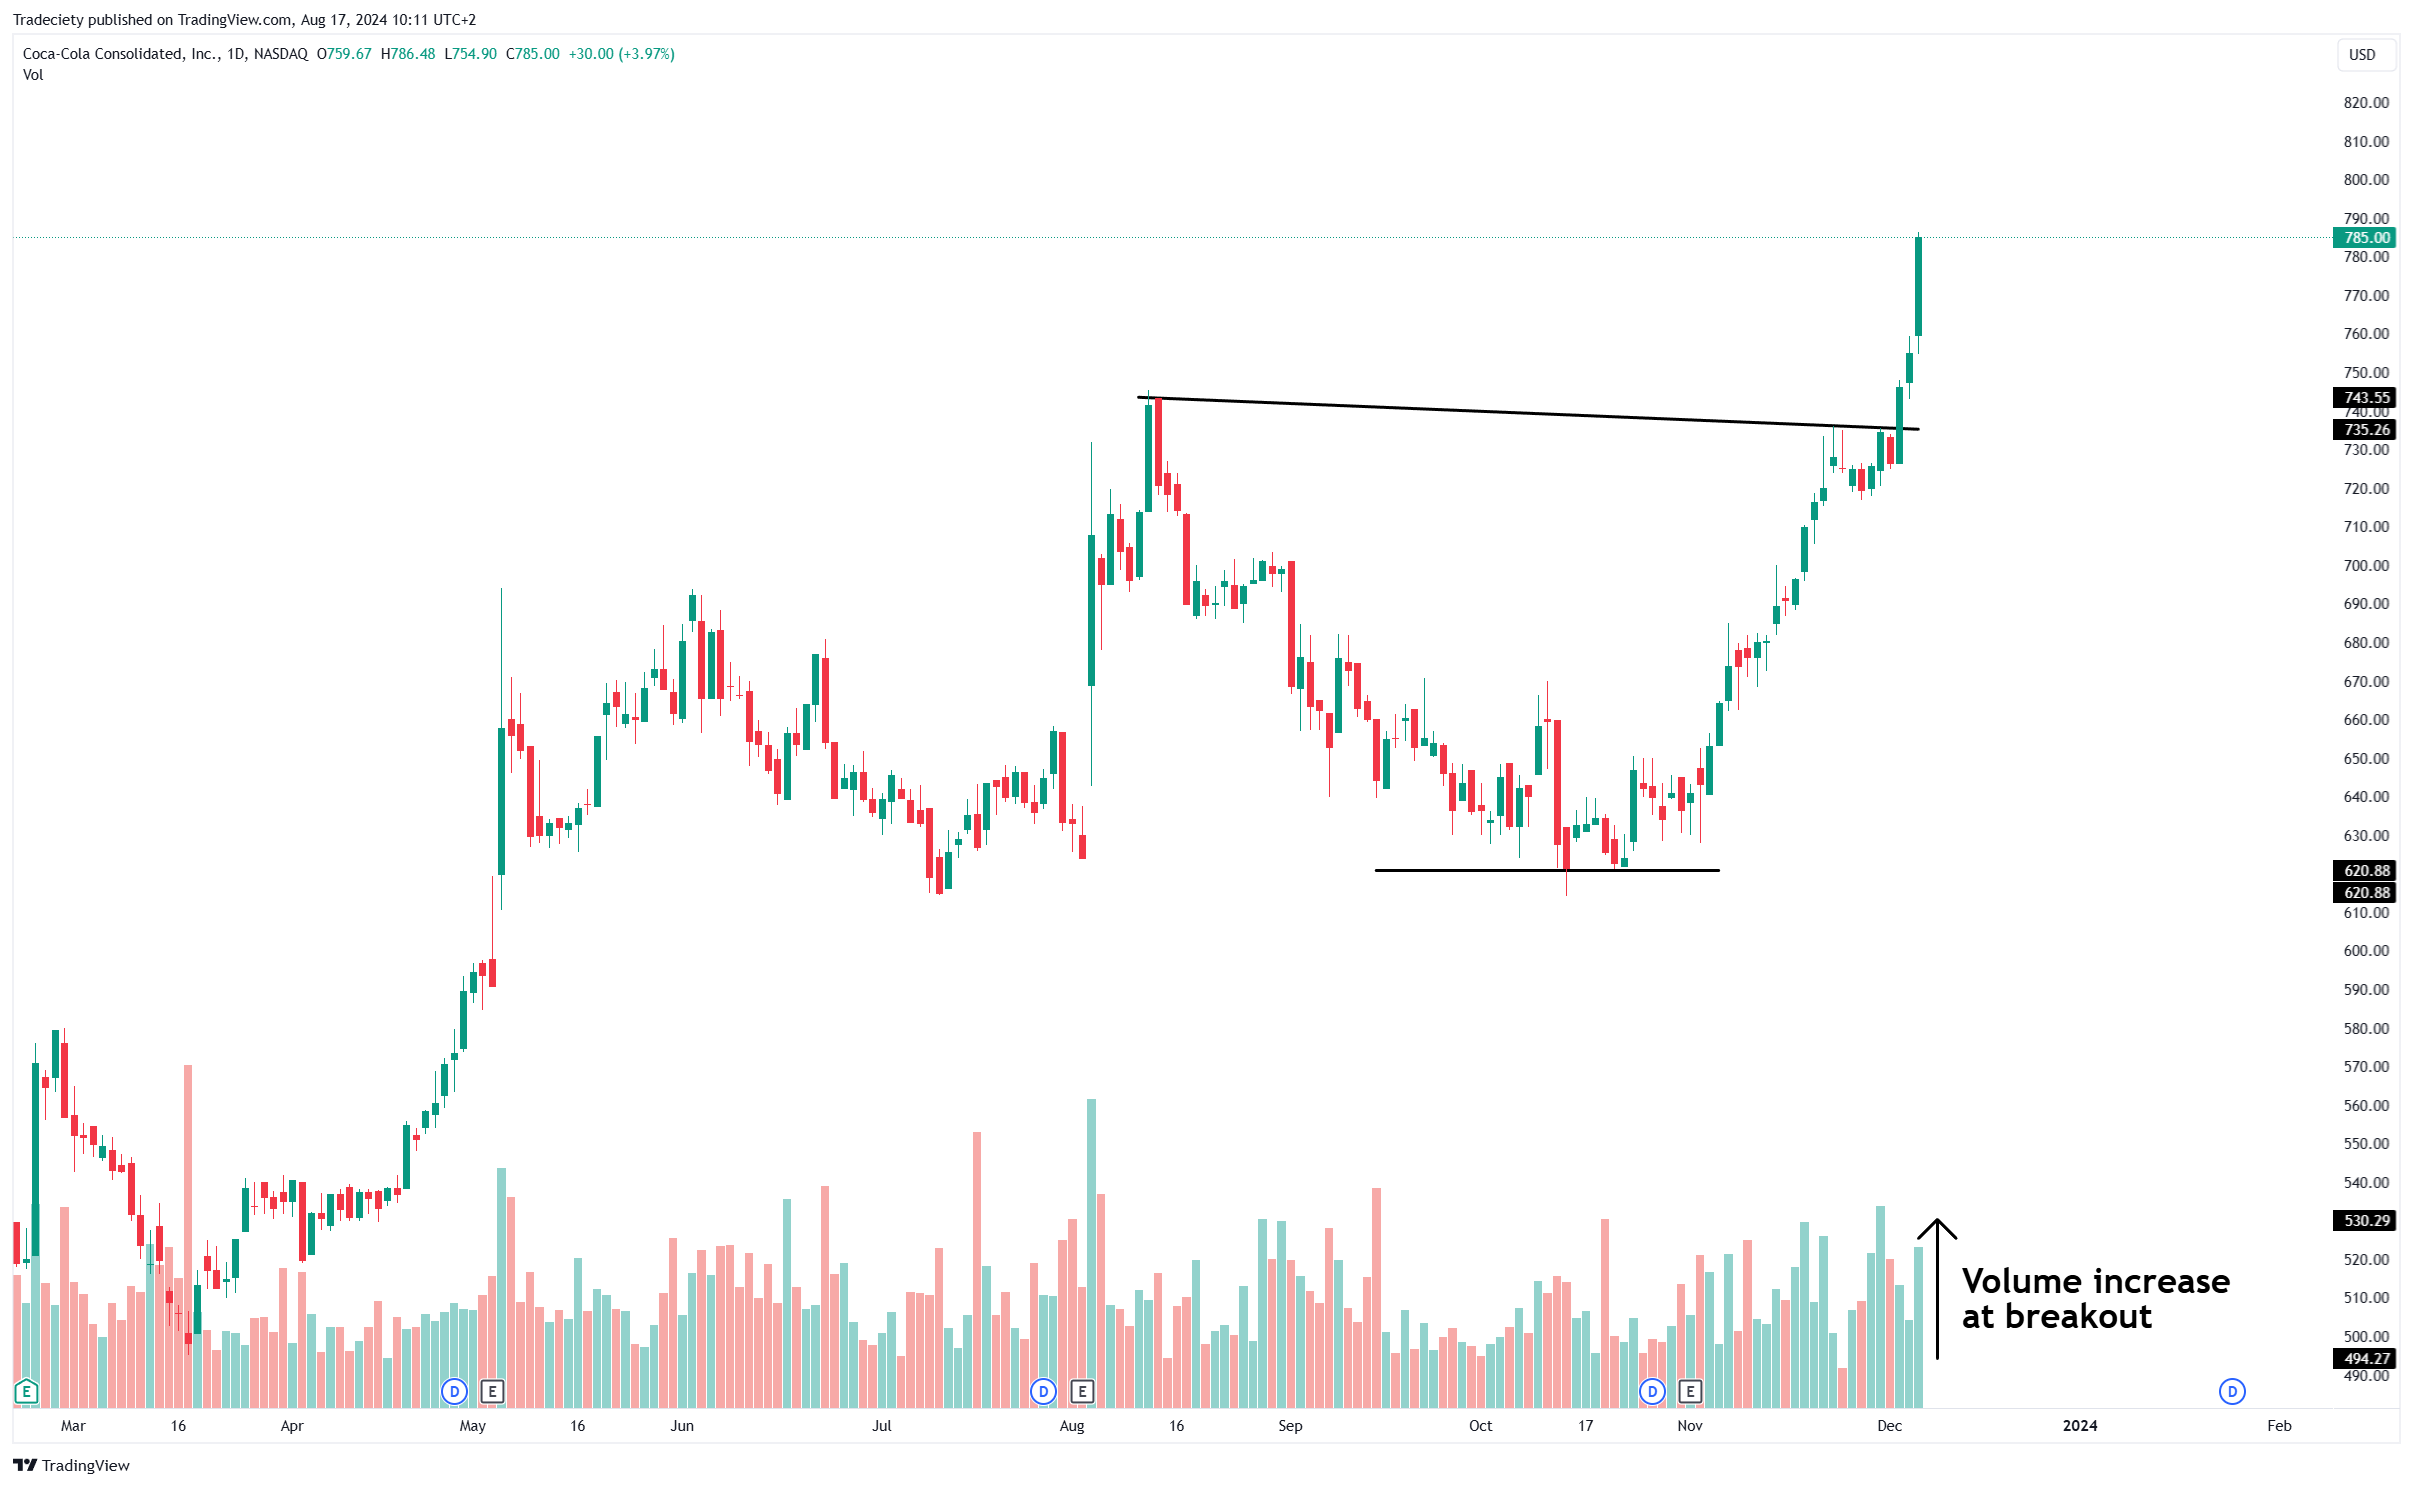
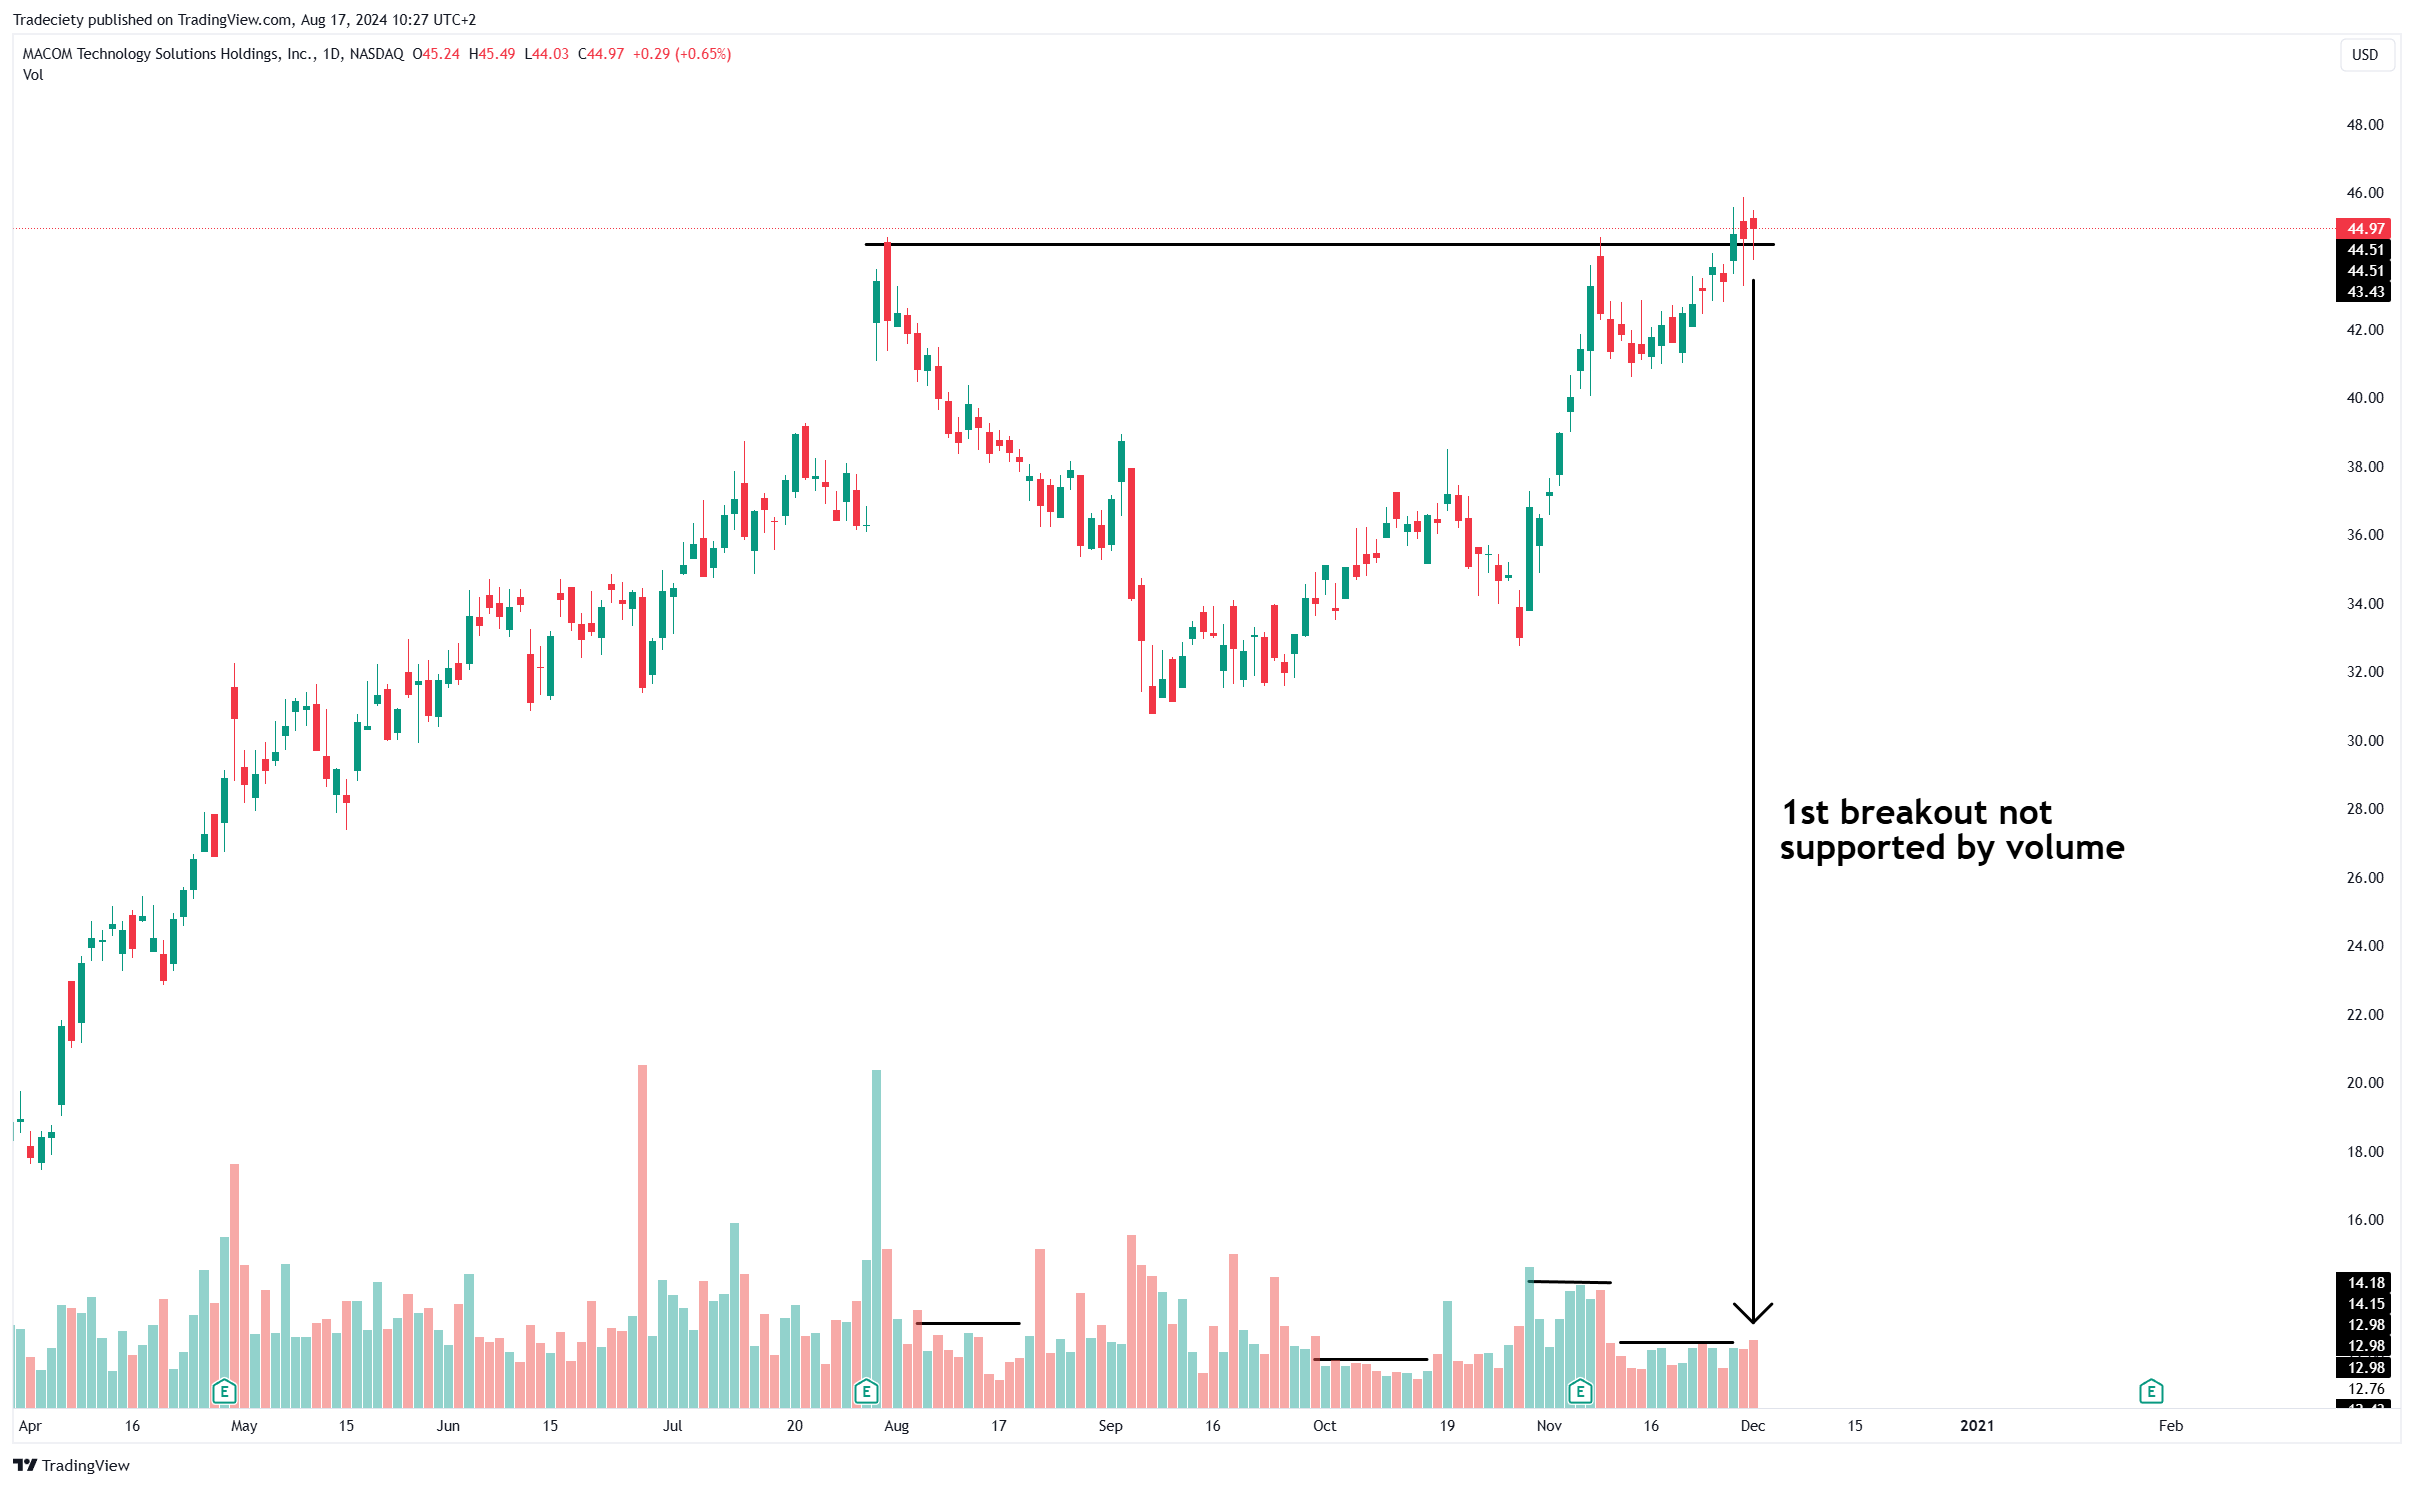
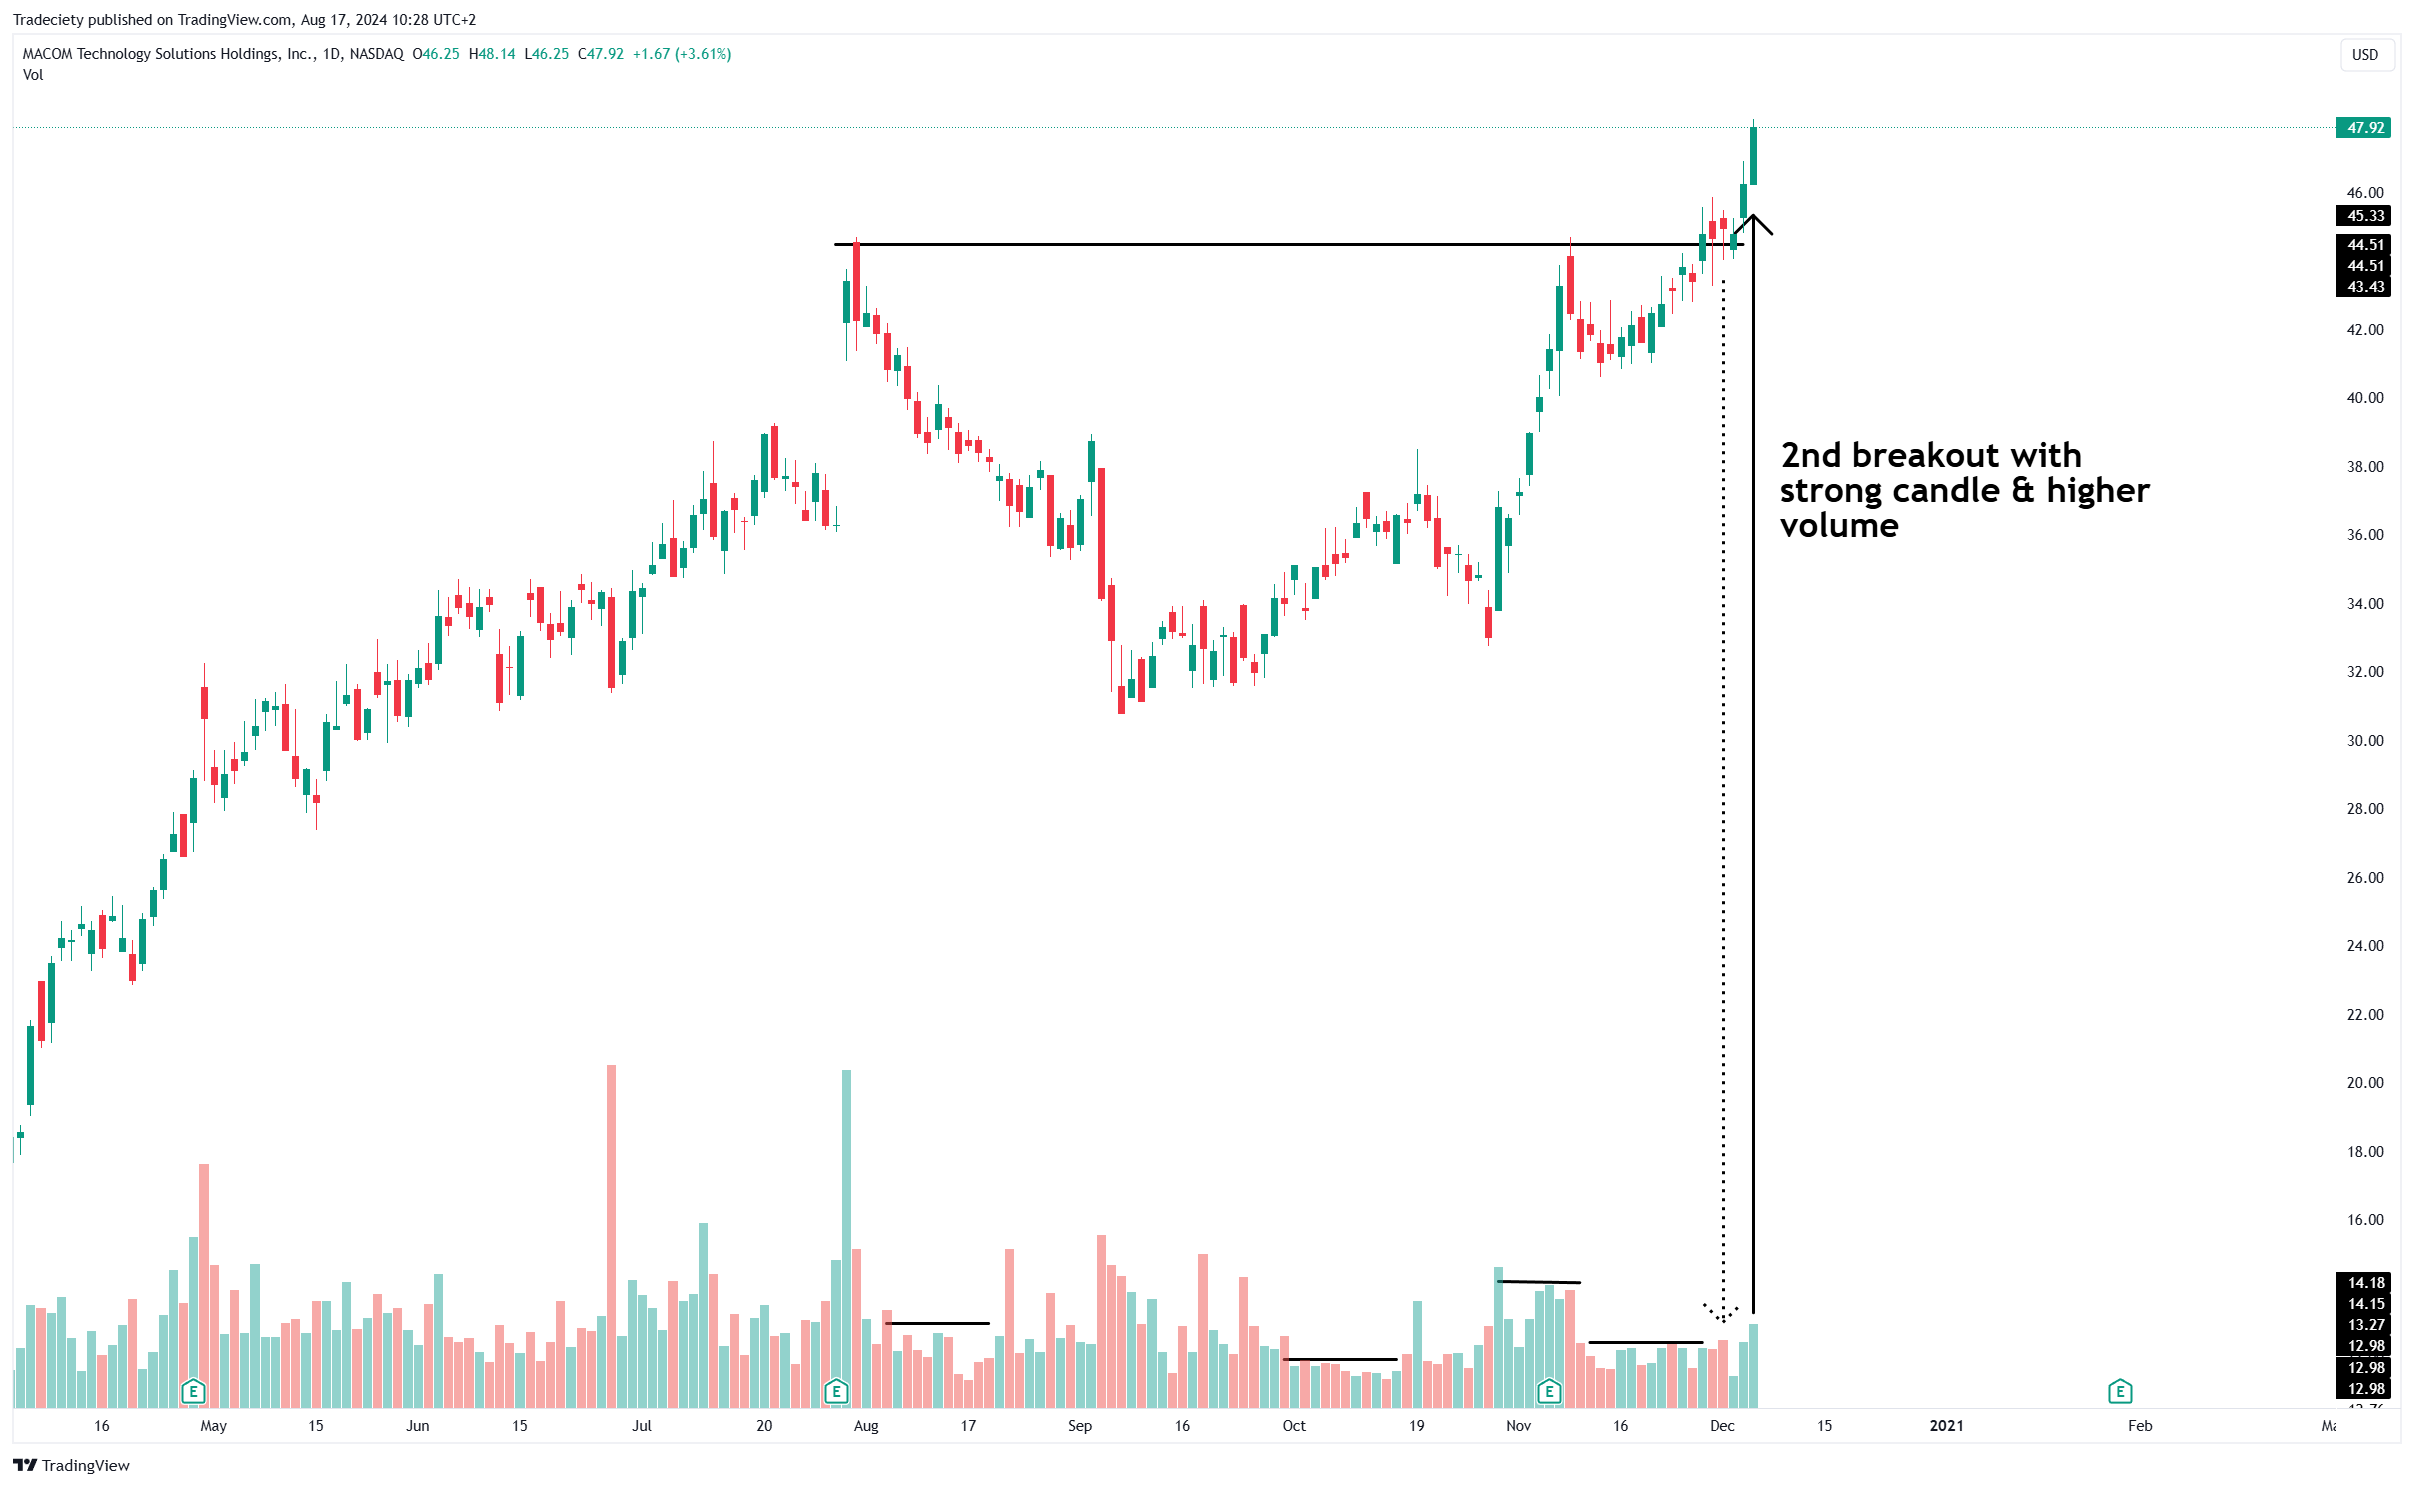
The most critical volume analysis occurs during the breakout from the handle. A strong Cup and Handle pattern is confirmed by a significant increase in volume as the price breaks above the resistance level formed by the cup's rim. This surge in volume indicates that buying interest has returned with force, and the breakout is likely to be sustained.
Without this volume confirmation, the breakout could be weak and more susceptible to a reversal. A low-volume breakout suggests a lack of conviction among buyers, increasing the risk of a false breakout where the price quickly falls back below the resistance level.
In summary, volume analysis is essential when trading the Cup and Handle pattern. Look for decreasing volume during the cup and handle formation, followed by a sharp increase in volume during the breakout. This pattern of volume behavior helps confirm the validity of the Cup and Handle and enhances the likelihood of a successful trade.
The Cup and Handle pattern can appear on various time frames, but it's most reliable on daily and weekly charts. This is because longer time frames tend to filter out noise and provide a clearer picture of the overall market trend. The pattern applies to different markets, including stocks, forex, and cryptocurrencies, making it a versatile tool for traders.
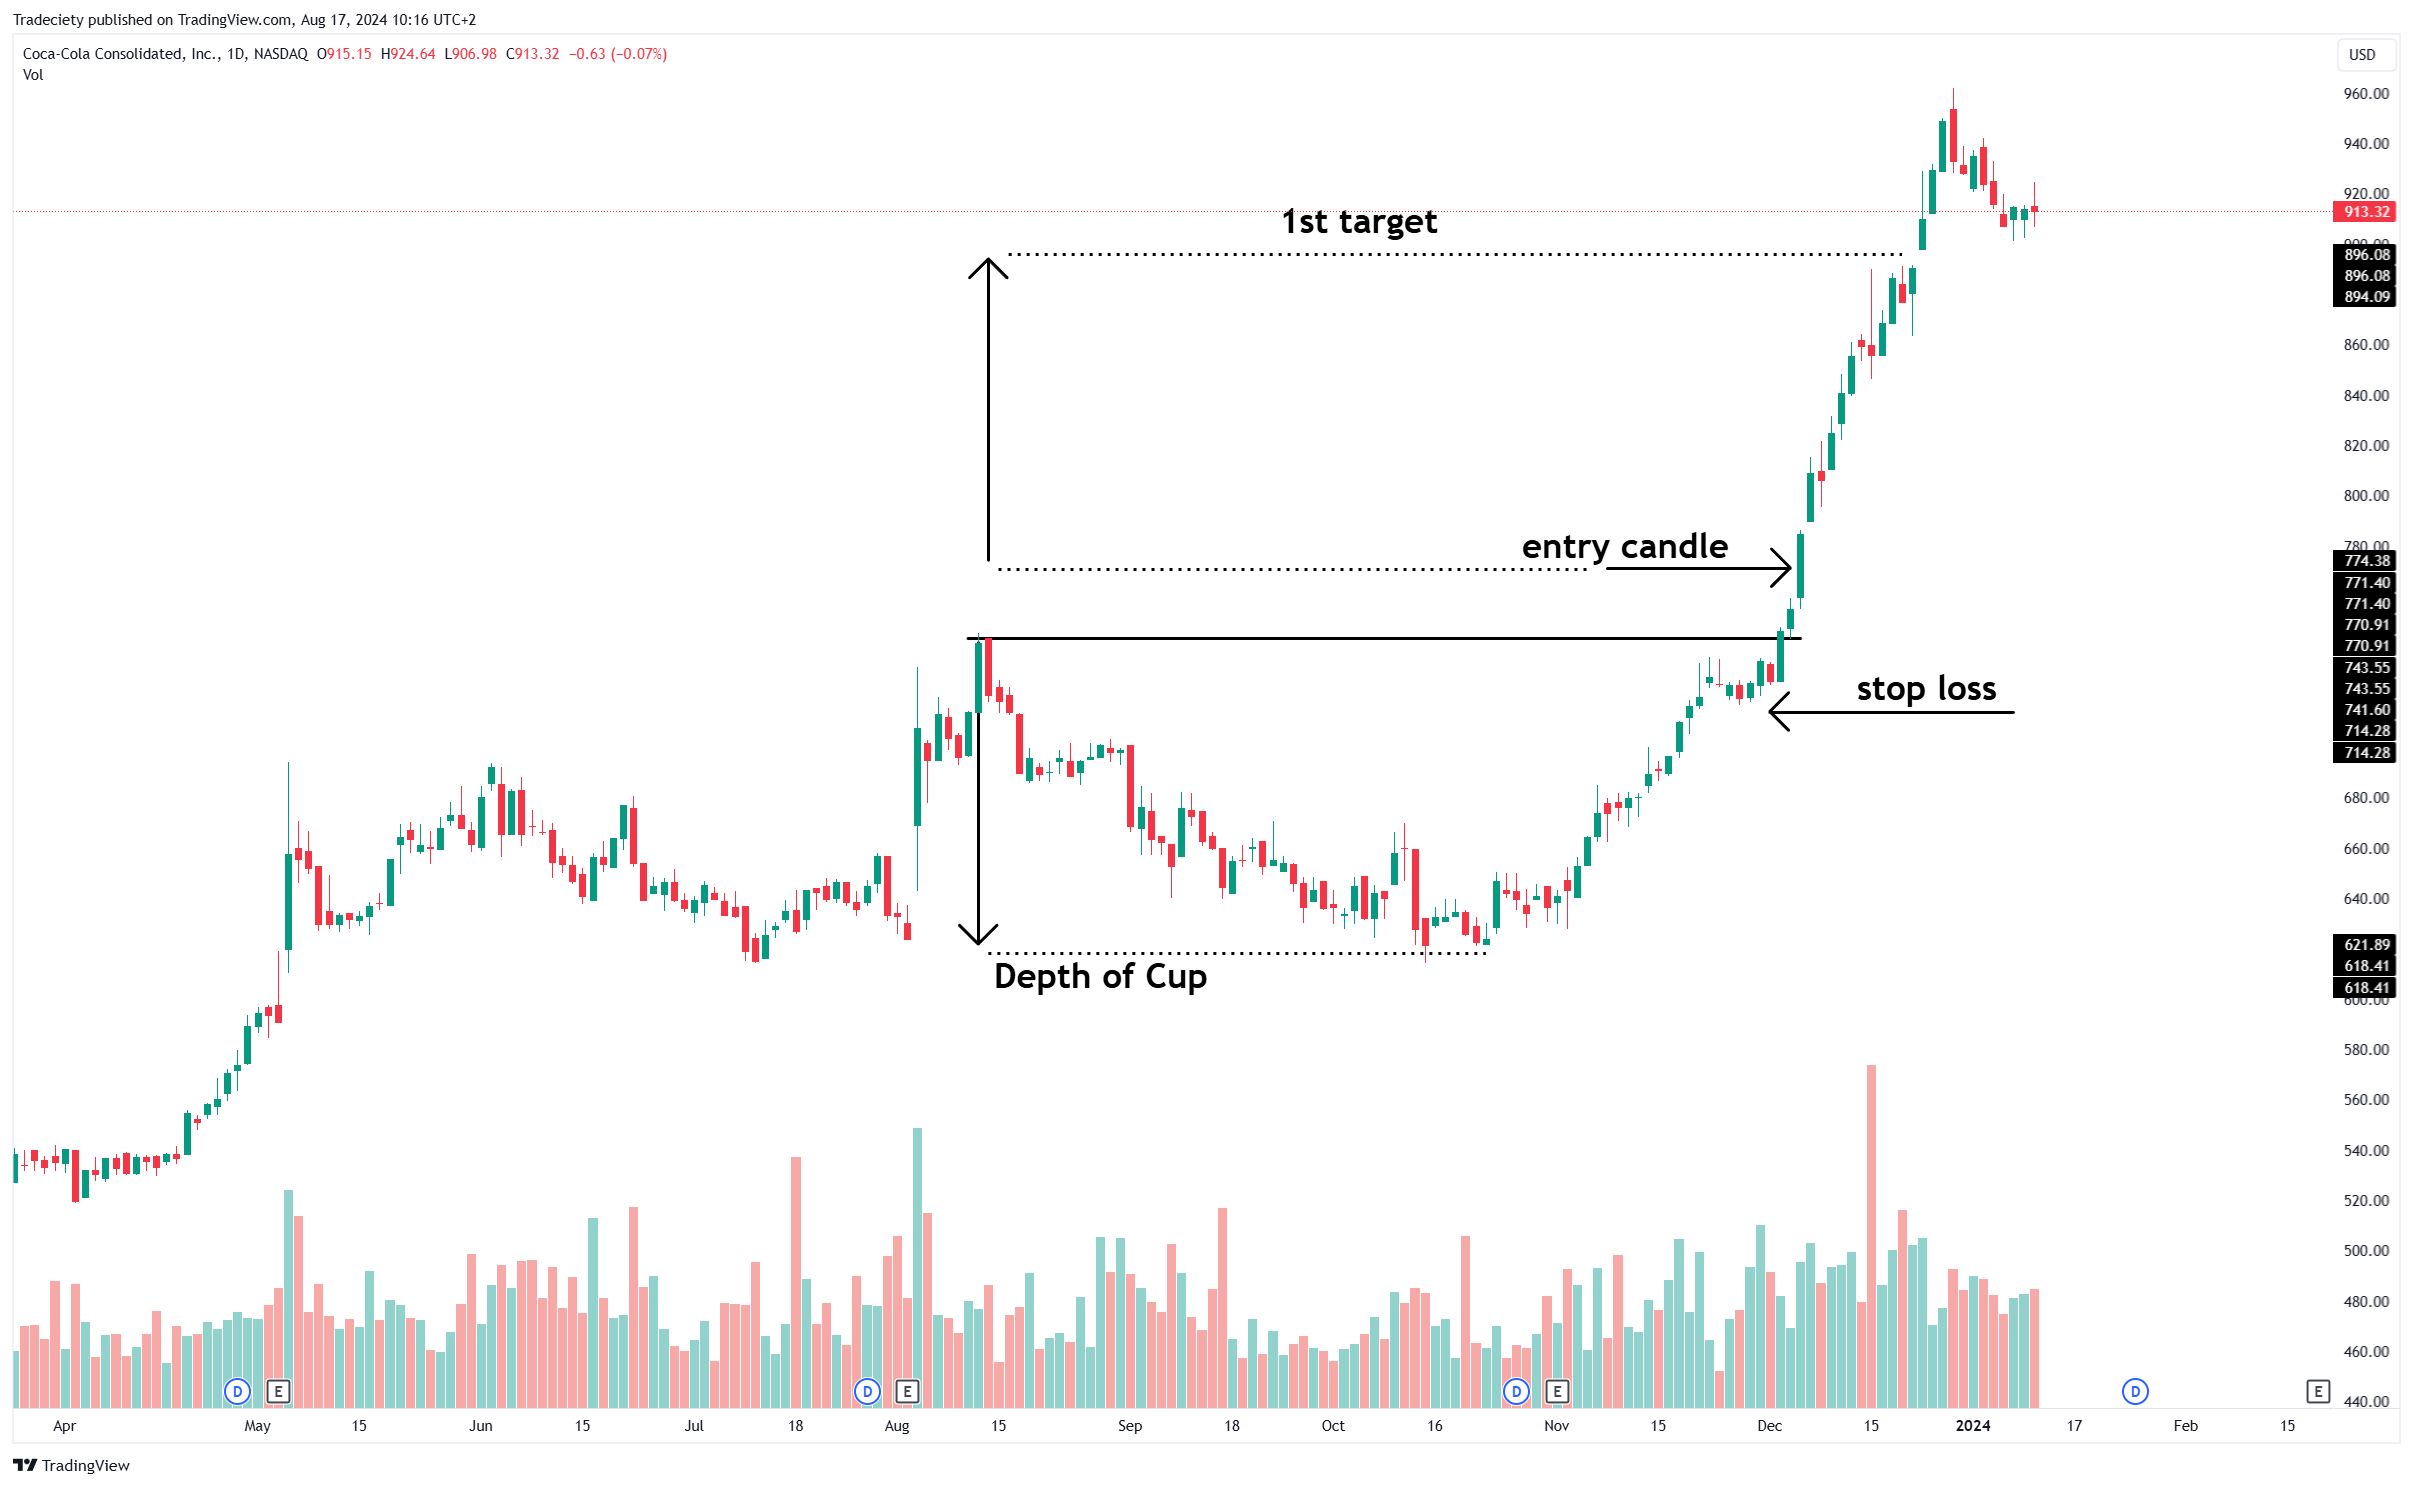
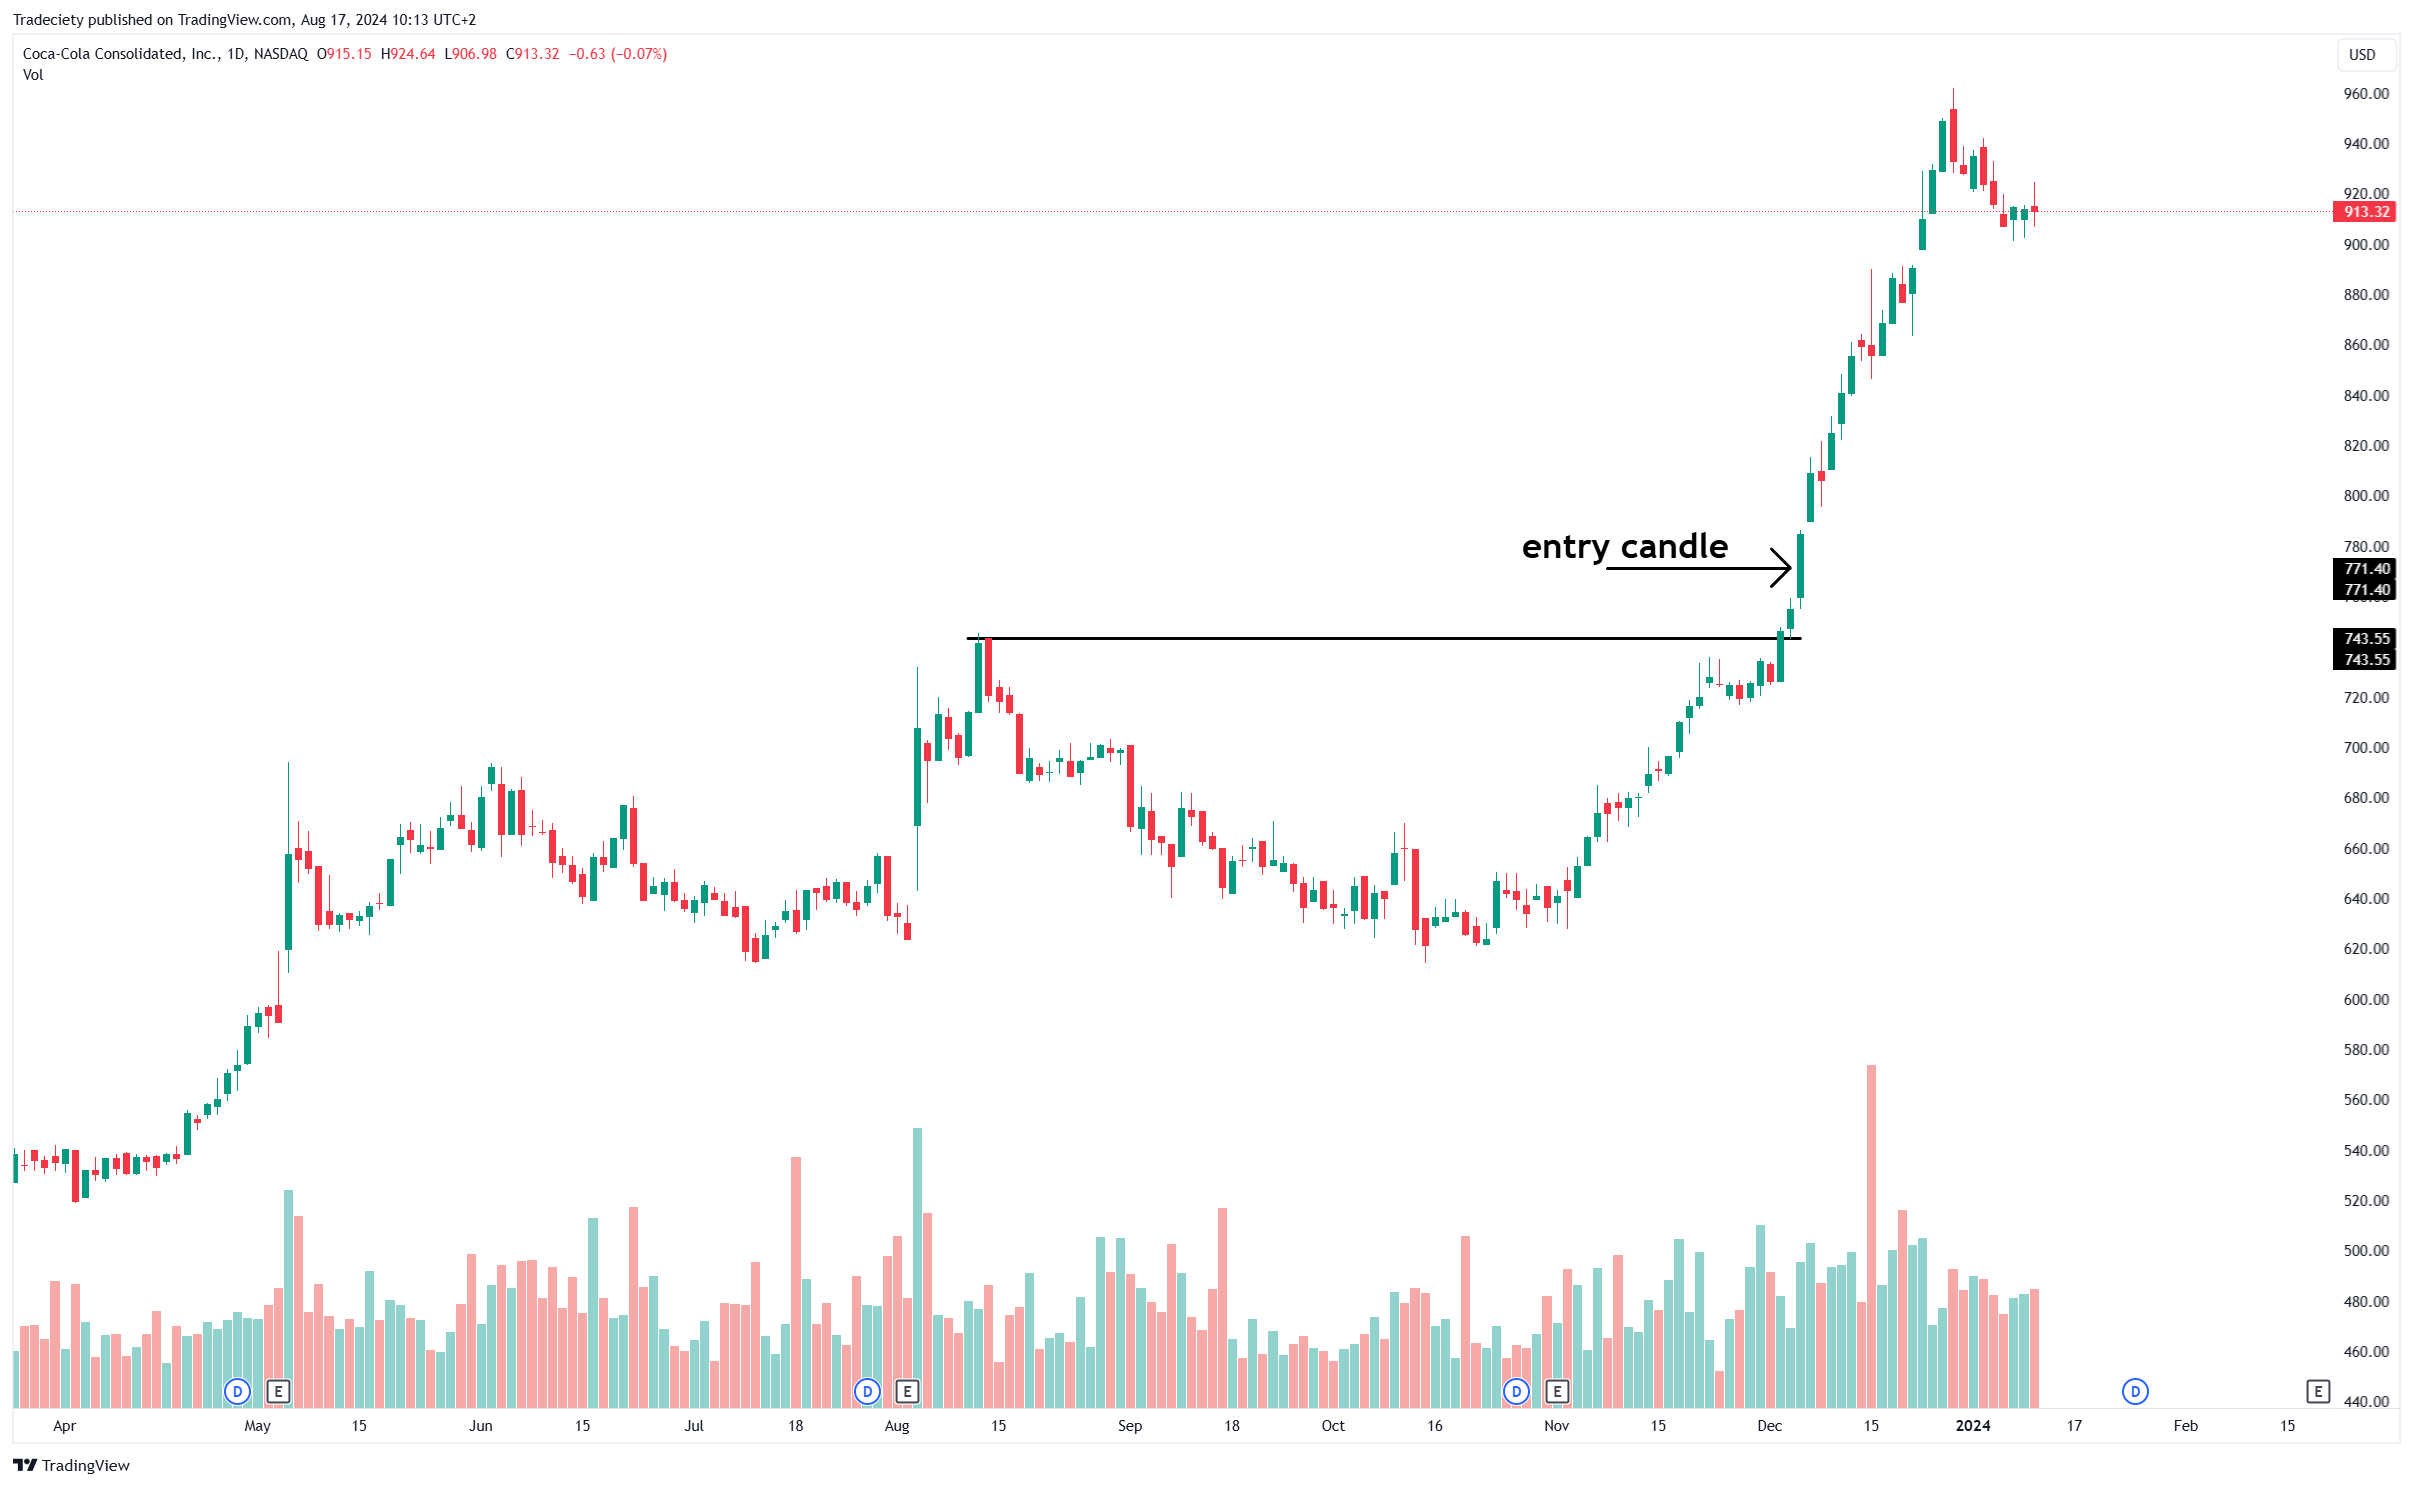
Identifying the right entry point is crucial for trading the Cup and Handle pattern. The most common strategy is to enter a long position when the price breaks above the resistance level formed by the top of the cup. This breakout is often accompanied by increased volume, signaling strong buying interest.
Confirmation Signals: Before entering the trade, look for confirmation signals such as a strong bullish candlestick or a close above the resistance level. This helps reduce the risk of entering a false breakout.
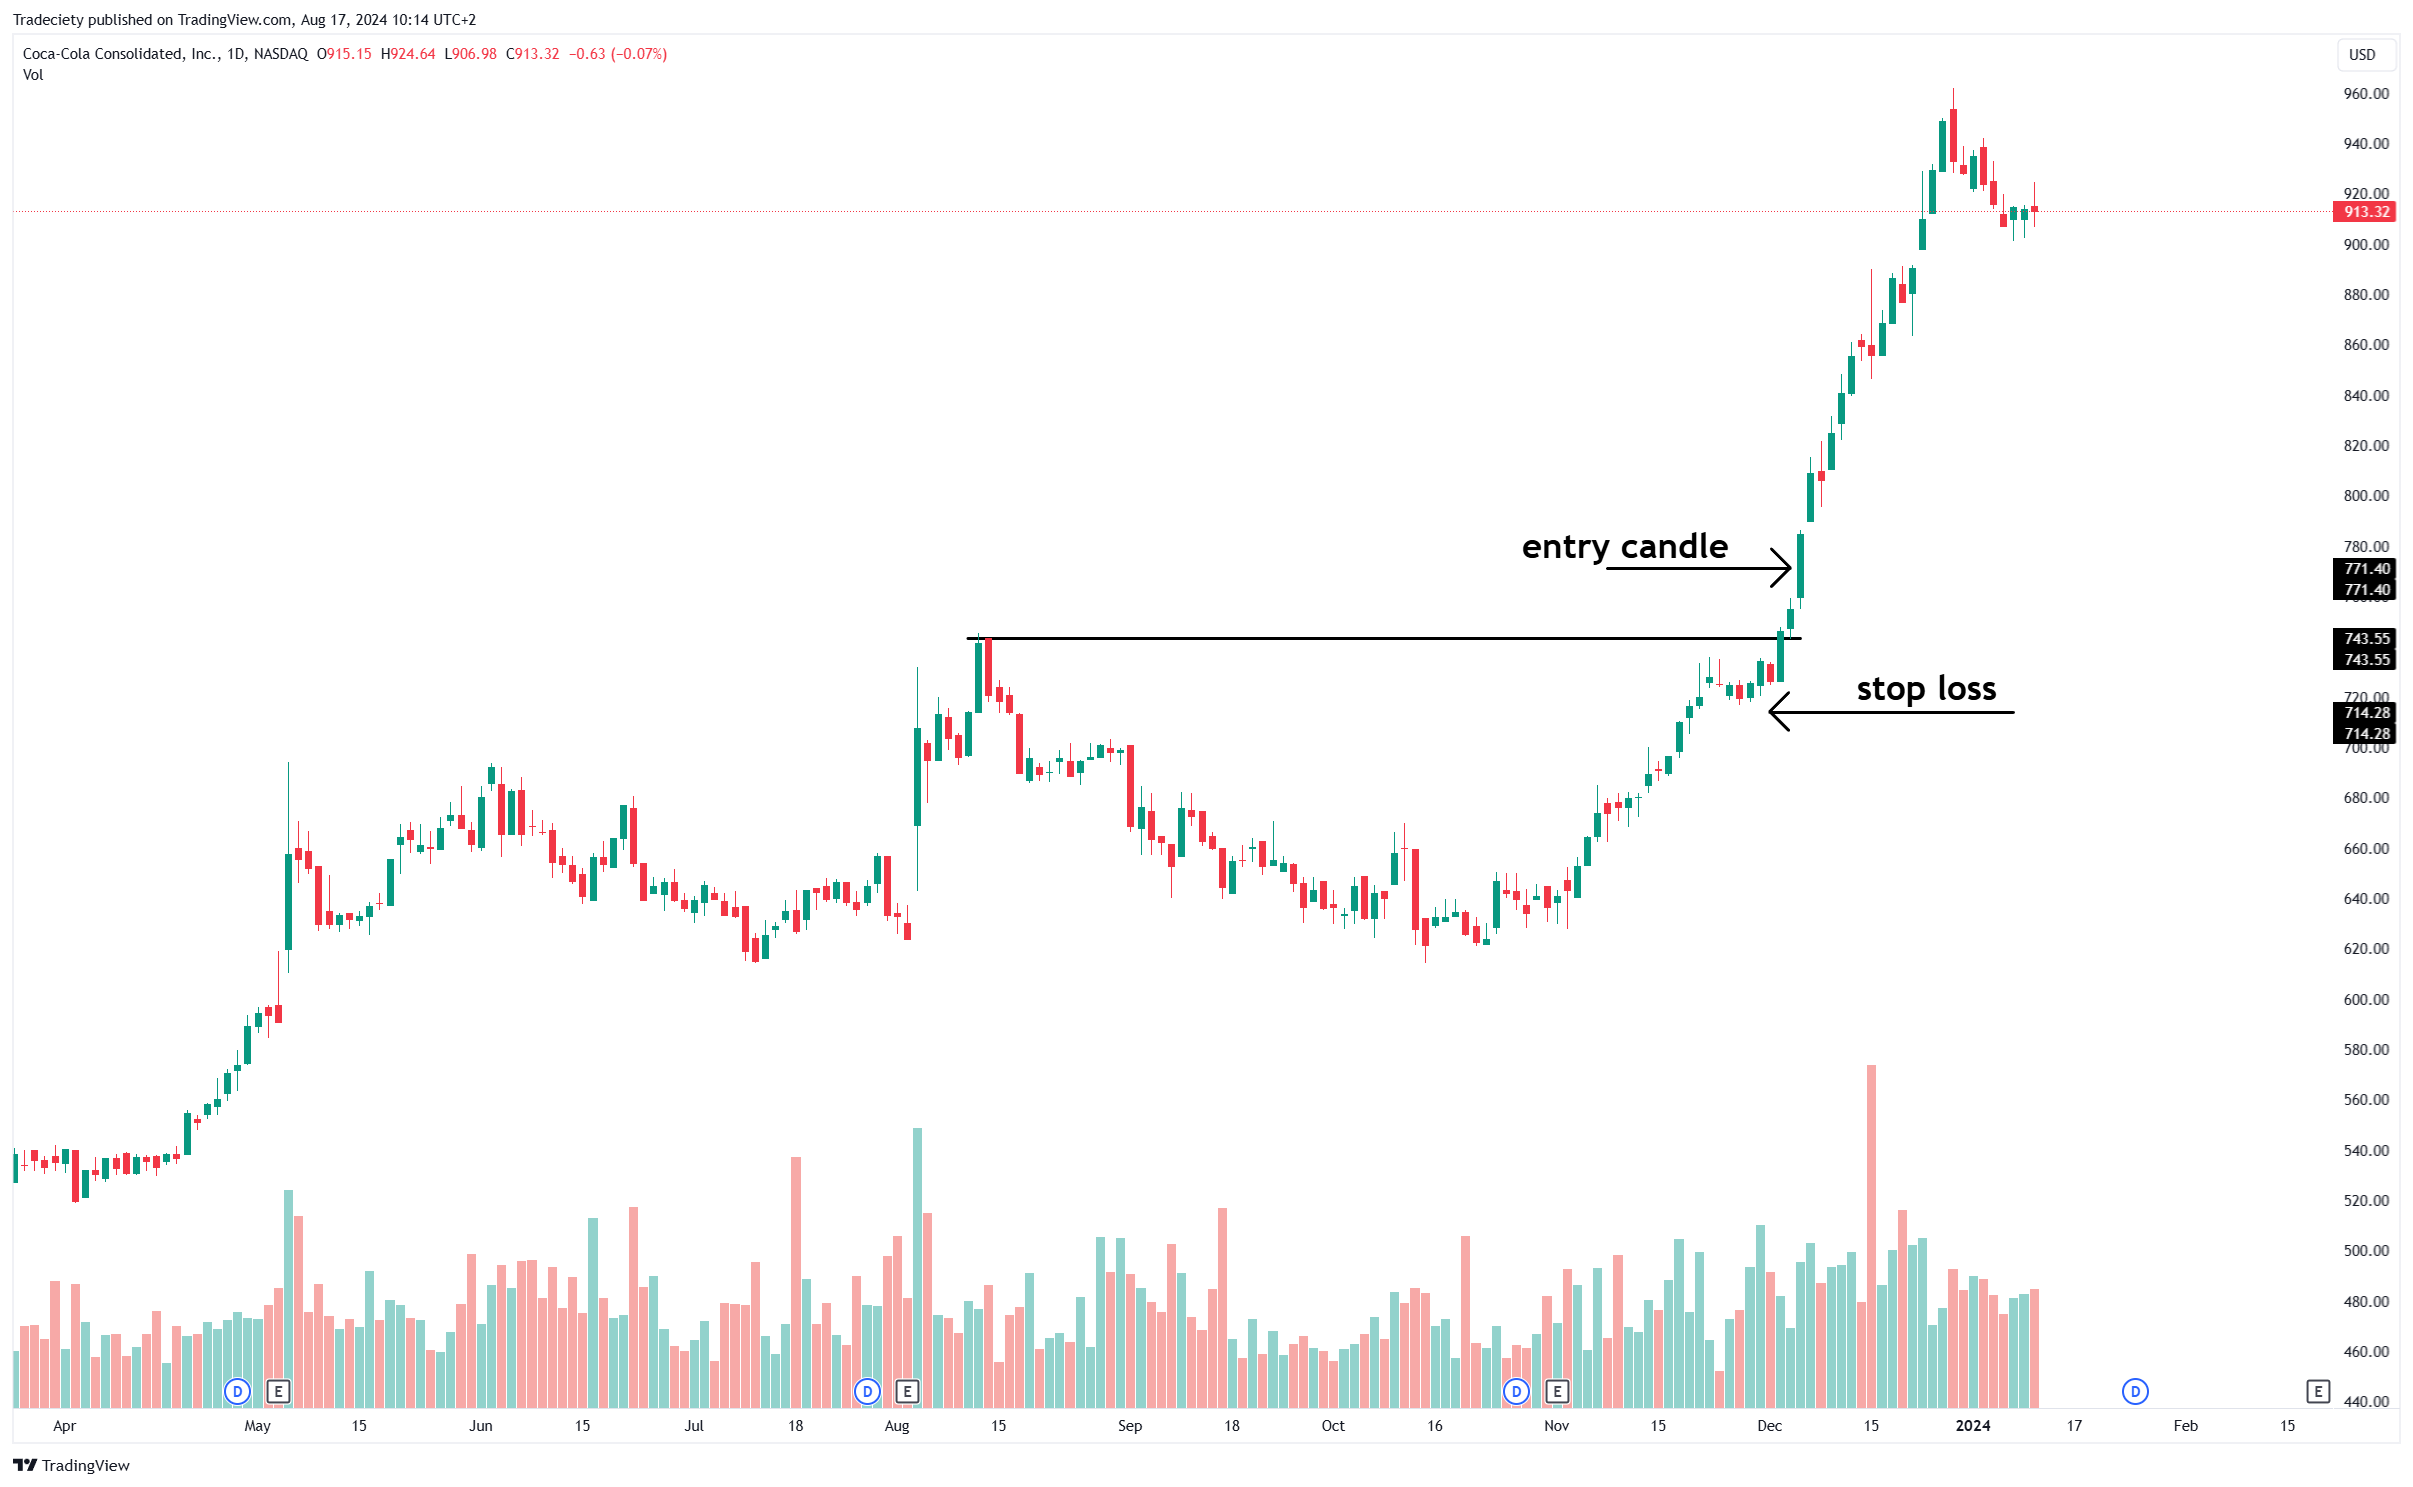
Effective risk management is essential when trading the Cup and Handle pattern. A well-placed stop-loss can protect your capital in case the trade doesn't go as planned. The ideal stop-loss level is just below the lowest point of the handle. This ensures that you're protected from minor pullbacks while still allowing the trade enough room to move.
Calculating the target price for your trade involves measuring the depth of the cup and projecting that distance upwards from the breakout point. This gives you an estimate of how far the price might rise after the breakout.
Scaling Out vs. Fixed Target Strategies: Some traders prefer to scale out of their position, gradually taking profits as the price moves in their favor. Others might set a fixed target price and close the entire position once it's reached. Both strategies have their merits, so choose the one that aligns with your risk tolerance and trading style.
False breakouts can be a common pitfall when trading the Cup and Handle pattern. A false breakout occurs when the price moves above the resistance level but quickly reverses, trapping traders in a losing position.
Recognizing False Breakouts: To avoid falling into this trap, watch for signs of weakness during the breakout, such as low volume or bearish candlestick patterns. If you suspect a false breakout, it's better to wait for a clear close above the resistance level before entering the trade.
Strategies for Mitigating Losses: If you do find yourself in a false breakout, consider closing the position quickly to minimize losses. Alternatively, you could use a trailing stop to protect your profits if the trade initially moves in your favor but then reverses.
Even experienced traders can make mistakes when trading the Cup and Handle pattern. Here are some common pitfalls to watch out for:
Misinterpreting the Pattern: It's easy to mistake other chart patterns for the Cup and Handle, especially if you're eager to enter a trade. For example, a "V" shape can sometimes resemble a cup, but it lacks the gradual rounding that characterizes the Cup and Handle.
Avoiding False Patterns: Take your time to analyze the chart and ensure that all the key criteria are met before entering a trade. Patience is key to successful trading.
Ignoring Market Context: The broader market context plays a crucial role in the success of the Cup and Handle pattern. For example, a bullish pattern might fail if the overall market sentiment is bearish.
Importance of Volume Confirmation: Volume is a critical factor in confirming the validity of the pattern. Without strong volume, the breakout may lack the necessary momentum to continue upward.
The Cup and Handle pattern is a powerful tool in a trader's arsenal, offering a reliable method for identifying potential breakout opportunities. By understanding the pattern's formation, learning to recognize it in charts, and applying sound trading strategies, you can improve your chances of success in the markets.
Remember, while the Cup and Handle pattern is a valuable guide, no pattern is foolproof. Always practice proper risk management, stay informed about market conditions, and continue refining your trading strategy. With patience and discipline, the Cup and Handle pattern can become a key part of your trading success.

external link:


We have been trading supply and demand strategies for over ten years, and they have stood the test of time remarkably well. Supply and demand is...

3 min read
Choosing the right trading journal is essential for traders wanting to analyze performance, refine strategies, and improve consistency. In this...

3 min read
“95% of all traders fail” is the most commonly used trading related statistic around the internet. But no research paper exists that proves this...