Supply and Demand Trading in 2026
We have been trading supply and demand strategies for over ten years, and they have stood the test of time remarkably well. Supply and demand is...
Trend-following trading is probably the most popular way for traders to generate trading signals. Traders expect that by using a trend-following trading approach they will be able to realize larger winning trades by capturing long-lasting trending movements.
In this article, I am introducing five common and powerful ways to find trend-following trading opportunities and I will walk you through the different chart studies to enhance your understanding of trend-following trading in general.
As the name suggests, using a trend-following trading approach, traders first must identify an existing trending market and then they search for trading opportunities that profit when the trend continues.
The first challenge, therefore, is identifying a trending market, and here traders can make use of different trading tools and concepts which we have explored in a different article: identify the trend direction
The benefit of trend-following trading is that when a trader is able to catch a long-lasting trending move, the profit potential may be very large.
Another important aspect of trend-following trading is that traders must realize that as a trend-following trader, you will not be able to capture the whole trending move. Since trend-following traders must wait for a trend to establish first, by definition, they cannot capture the first part of a trend. Especially new and inexperienced traders make the mistake of trying to predict when a new trend will emerge before there are actual signals that a trend is present. This predicting mindset can be dangerous because the trader is tempted to take trades too early and then realize unnecessary losses. Waiting for a trend to emerge and being patient are important skills that trend-following traders have to develop.
But now let´s get into the practical part of this article and let´s explore the five trend-following trading strategies that I have chosen. The strategies in this article are, by no means, complete and I would recommend using them as an inspiration for building your own trading strategy around the mentioned concepts. Also, a solid backtest is recommended at the beginning, before you move into demo trading and, finally, trade real money to evaluate the effectiveness.
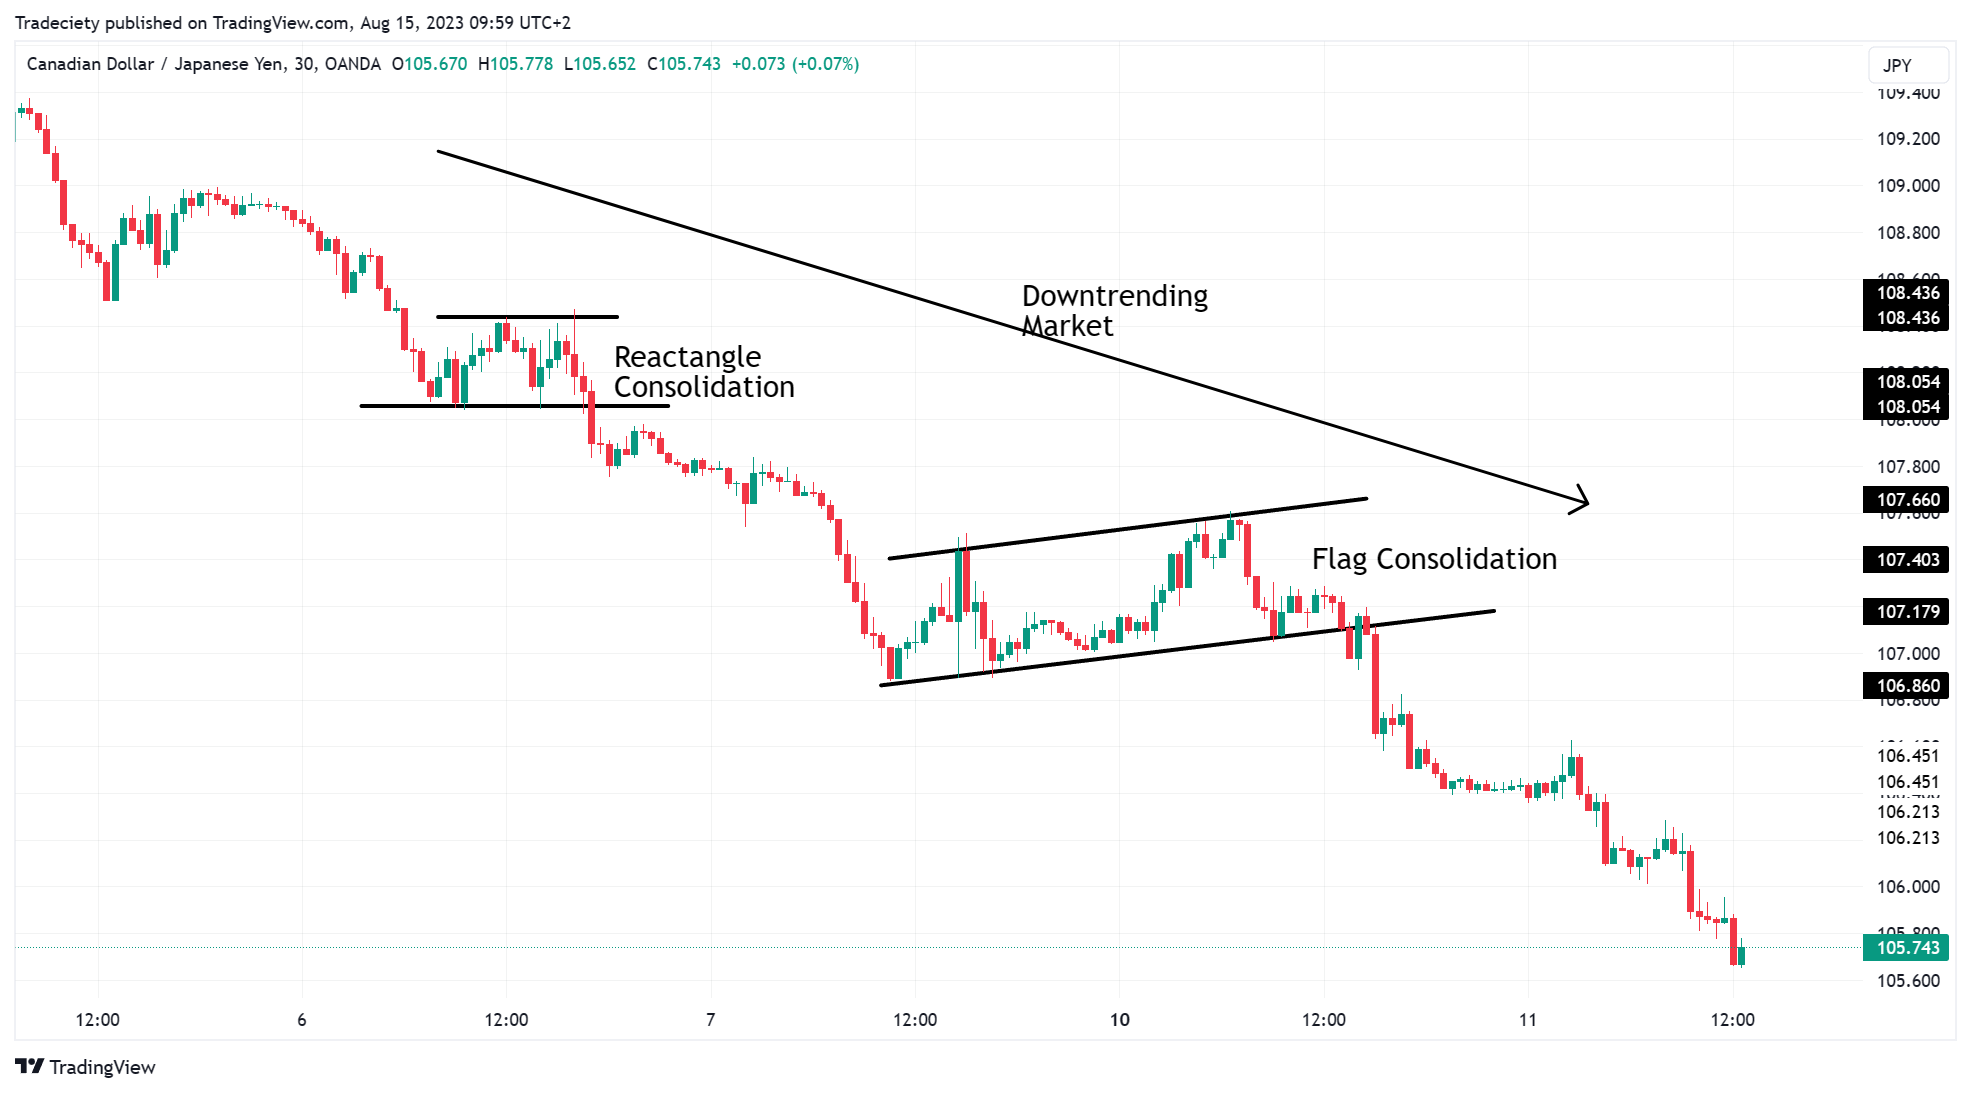
The classic way of trading trend continuations utilizes chart patterns and price action concepts. Chart patterns are so-called connectors as they connect trending phases during trending markets. Trends do not move in a straight line and the price usually goes back and forth. Chart patterns can often be found during the corrective trend phases as the ongoing trend is pausing. A breakout from a chart pattern often signals a trend continuation.
In the screenshot below, we can identify a downtrend (bearish trend) as the price is moving lower. During the overall trend, we can observe phases during which the downtrend is pausing. The first phase showed the characteristics of a rectangle with horizontal support and resistance boundaries. As a trend-following trader, you want to avoid trading within a sideways correction because the price is just bouncing up and down. Ideally, the trader is waiting for a close of the price below the support level before taking trend-following trades.
Currently, the price is showing a flag consolidation pattern. A flag pattern is defined by diagonal trendlines that run opposite to the ongoing trend. The price is just breaking out of the flag, signaling a potential trend continuation.
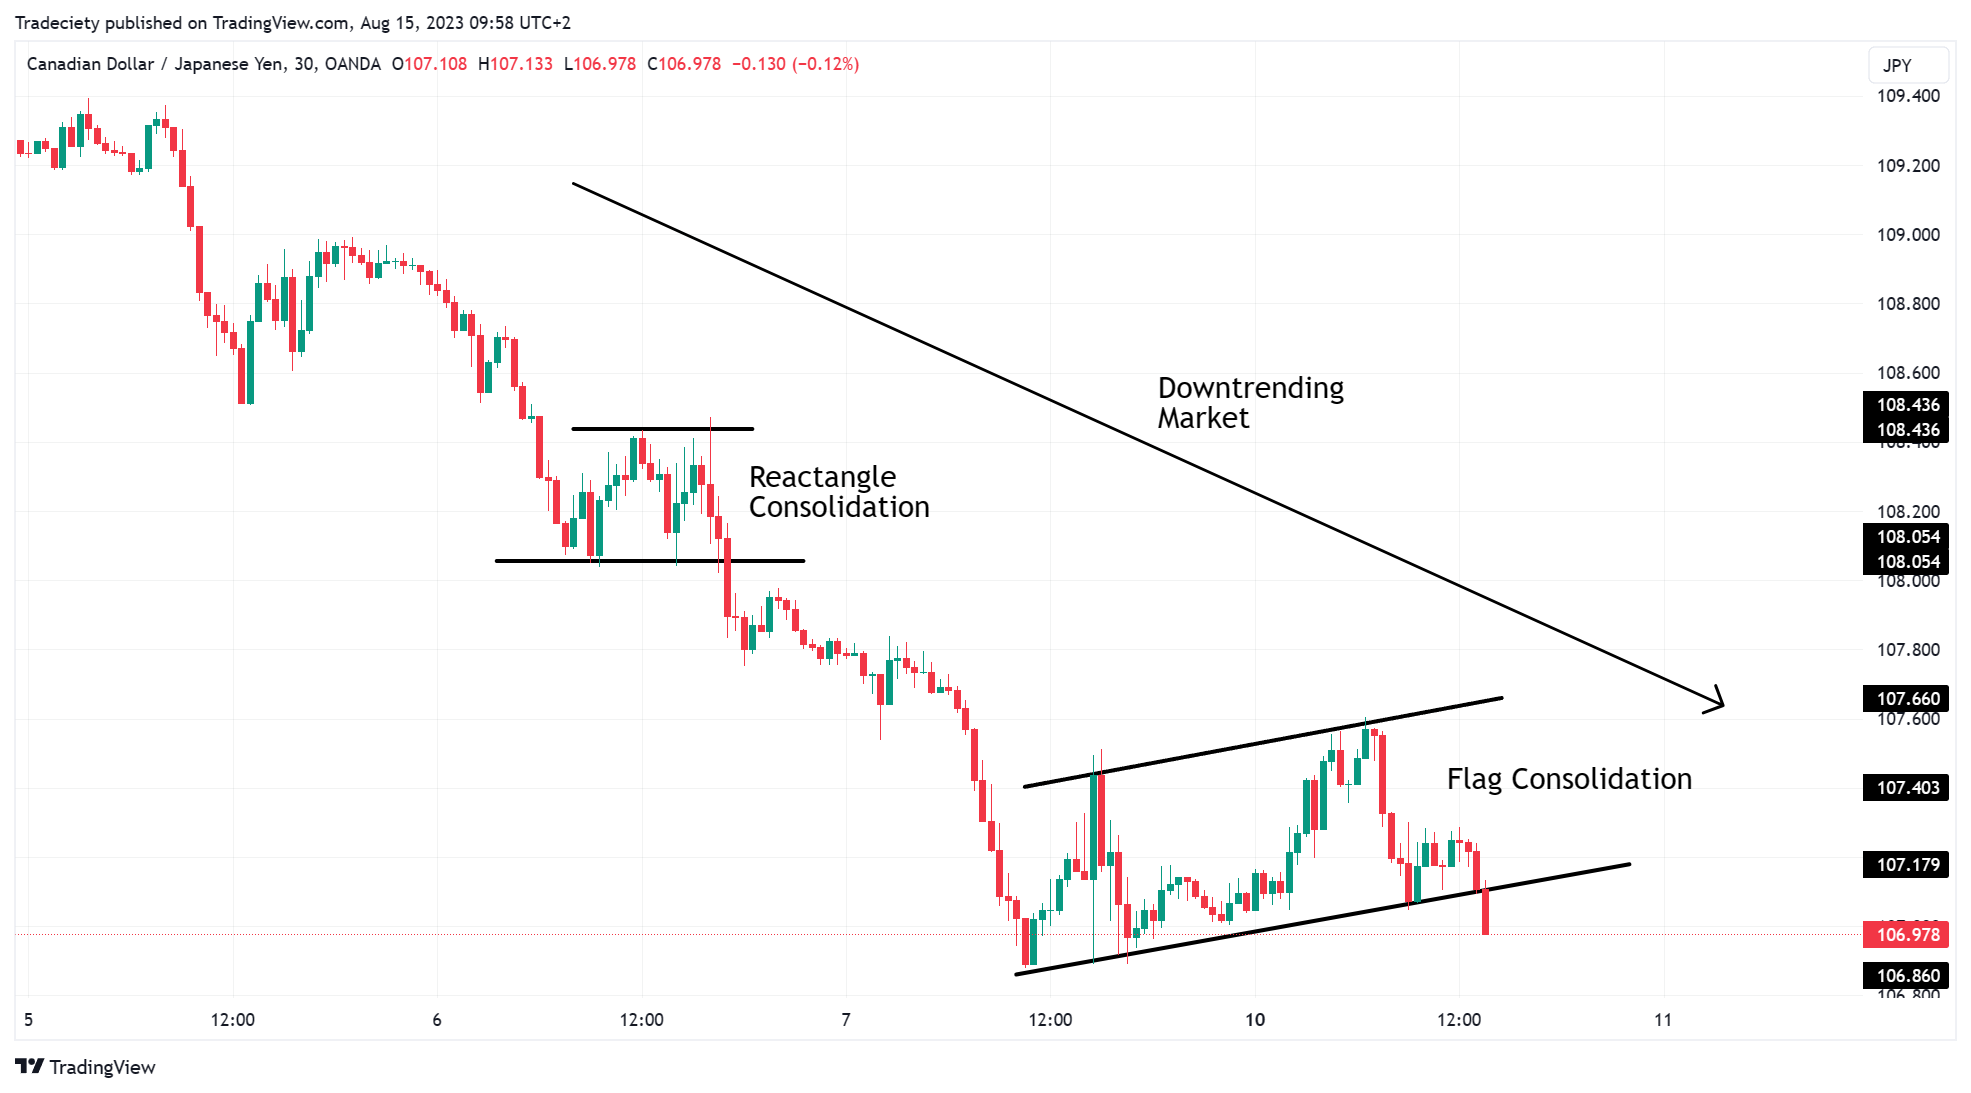
After the breakout, the trend continues and the trend advanced lower.
Although many traders believe that price action trading is superior to indicator signals, I would not dismiss the power of trading indicators and even some of the best traders of all times are using indicators in their trading.
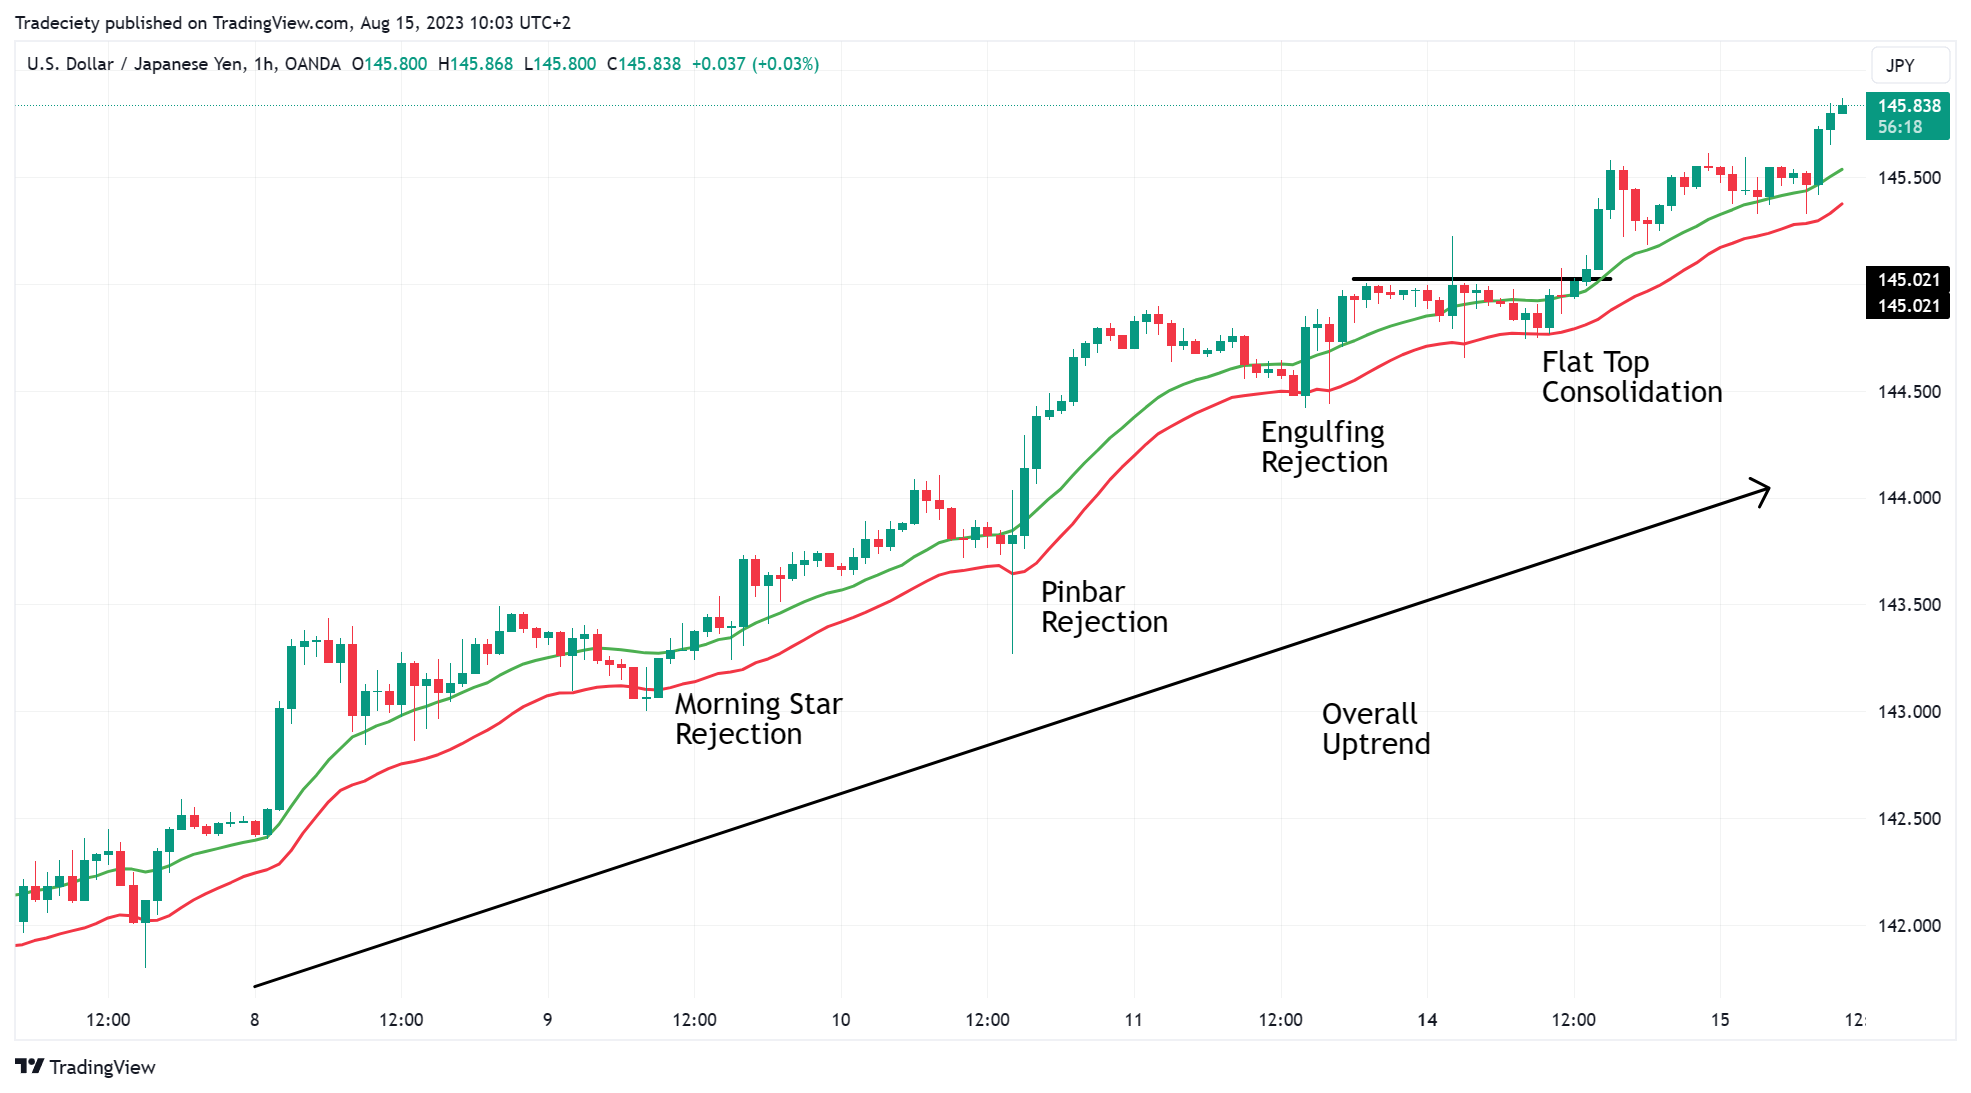
In the following chart, I have applied a moving average channel consisting of two moving averages with the same 20-period setting; one is applied to the high and one to the low. You can easily set this up in your Tradingview by opening the settings of the moving averages and changing the “source” to high and low.
Moving averages are the perfect trading tool for trending markets as they often describe the trend effectively. In the screenshot below, we can see that the bullish trend is advancing above the moving average channel. Trend-following traders are looking for signals when the price is moving back into the channel and then they trade the rejection away from the channel.
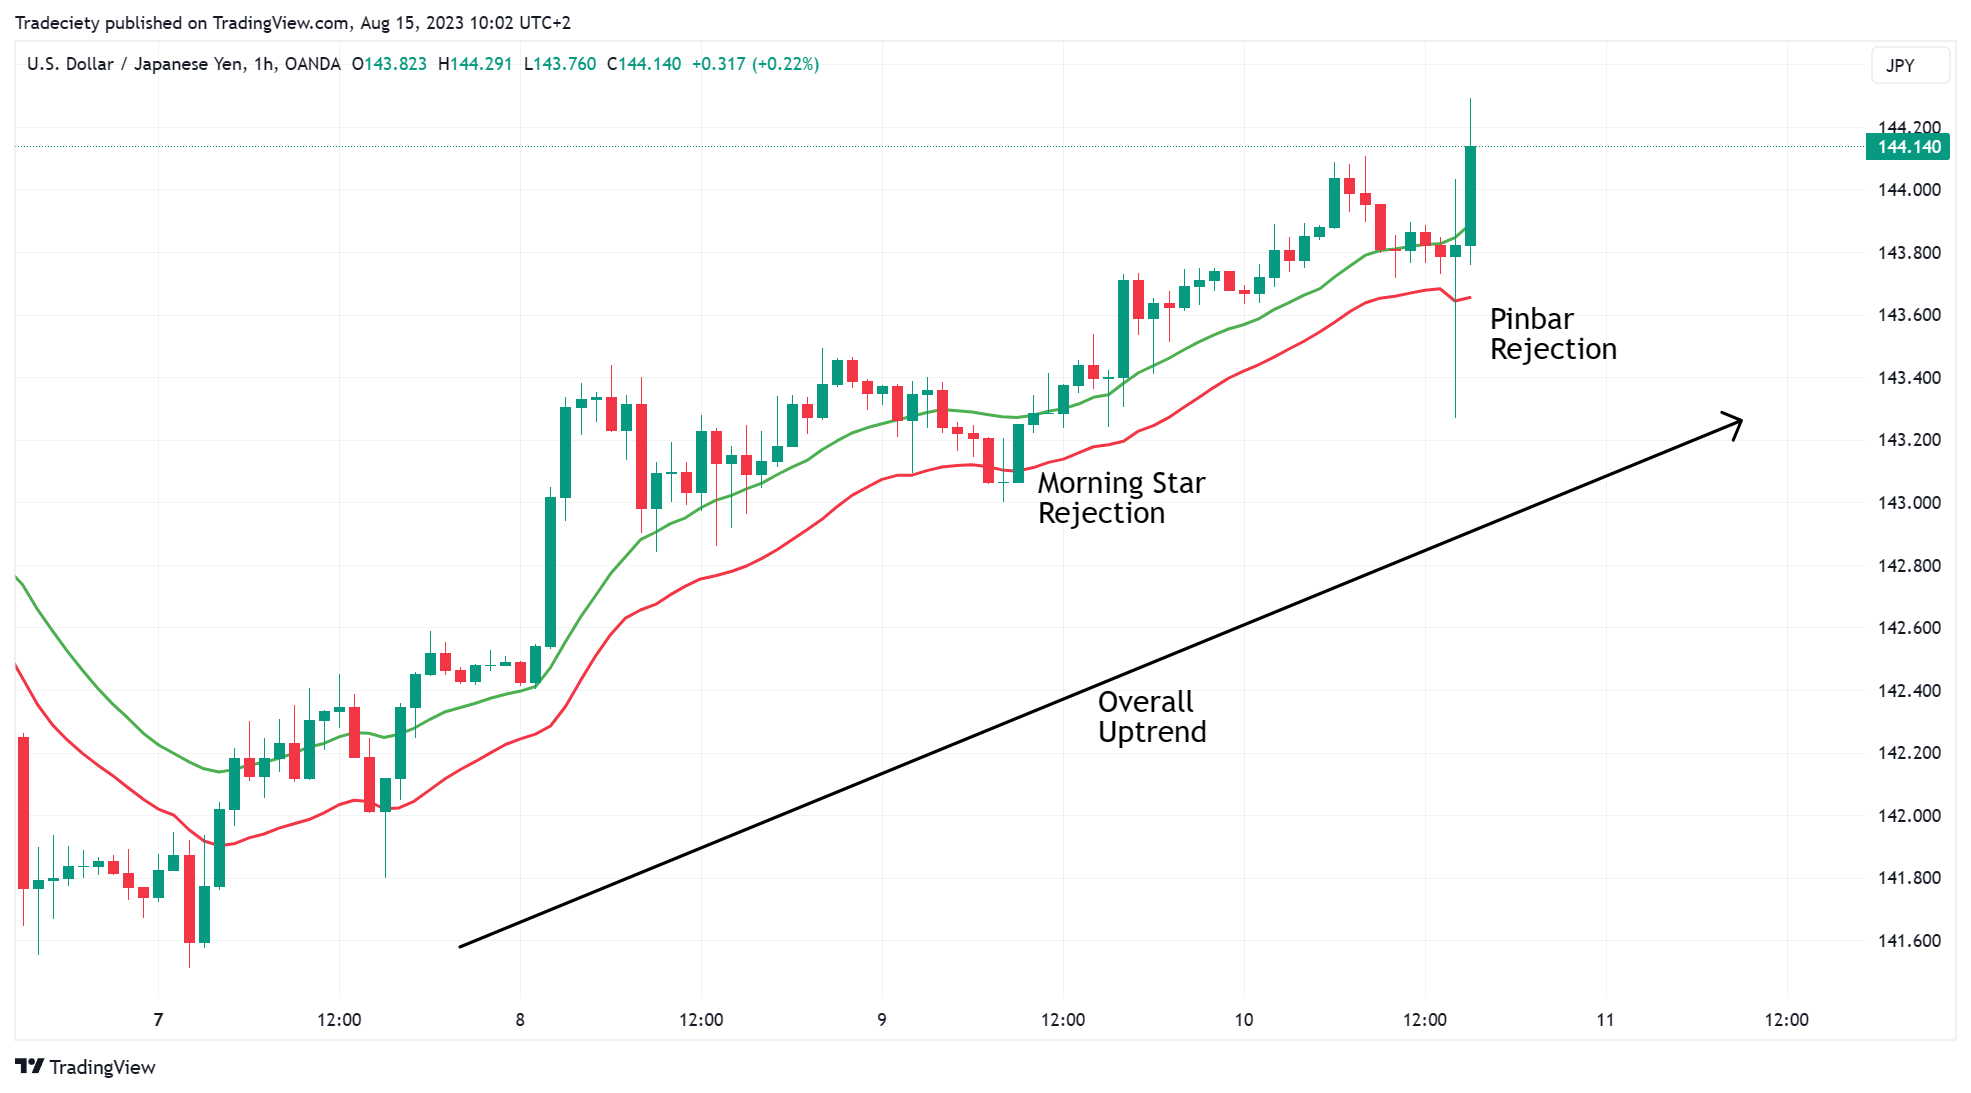
As we follow the bullish trend, we can see multiple cases when the price moved back into the channel and then rejected the channel before advancing higher. Such signals may provide great trend-following opportunities.
The benefit of using indicators is that the signals are 100% objective. New and inexperienced traders often struggle with the subjective nature of pure price action trading; an indicator might be a great addition to your arsenal if you are looking for an objective tool to complement your decision-making.
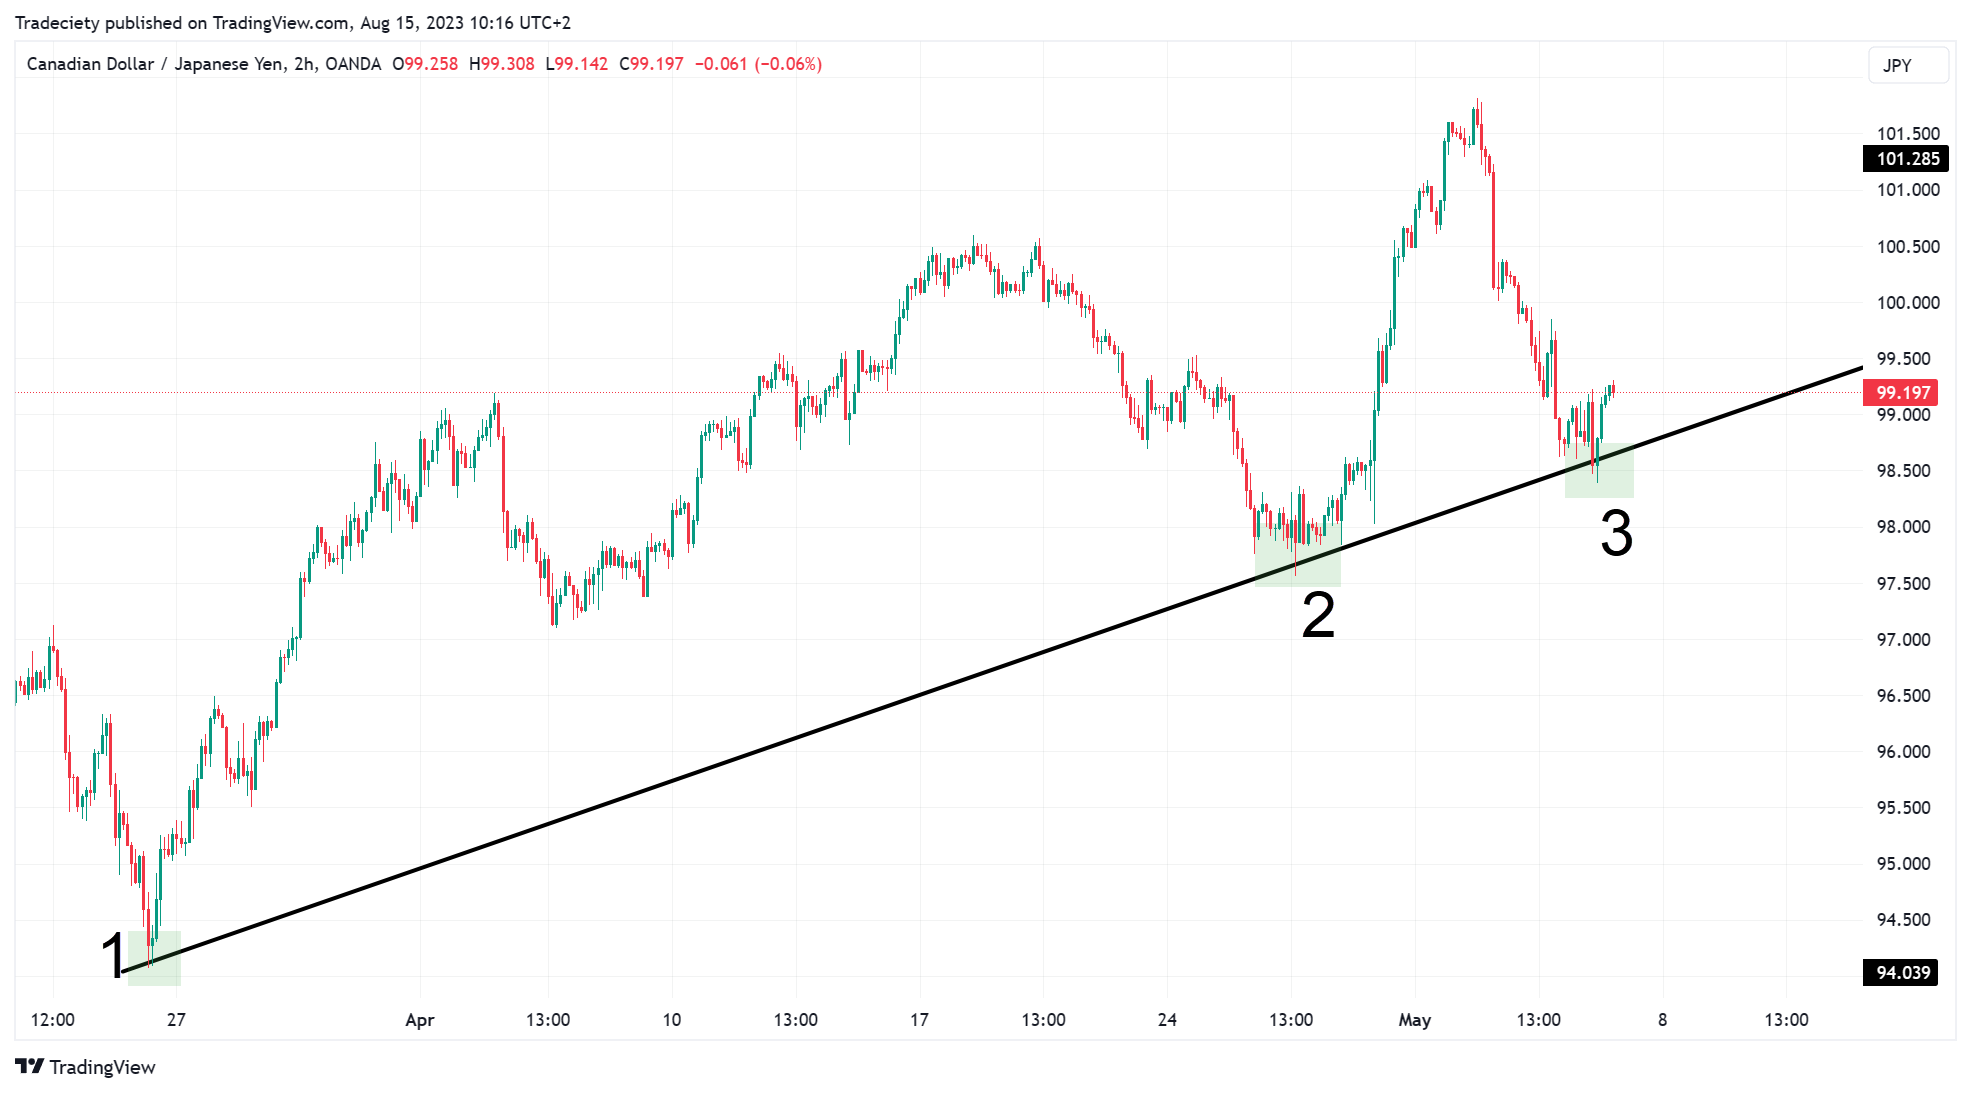
Trendlines, as their name suggests, are trading tools that are only used for trending markets. Trendlines describe a trending phase where a trader connects the low points in an uptrend (and the high points during a downtrend). For a trendline, you require three touchpoints to be valid.
In the scenario below, we connect the first two low points of the uptrend. Now, the price is back at the trendline for a third time and is testing the level as support. Trend-following traders are waiting for signs that the trendline is holding as support to initiate bullish trades in the trending direction.
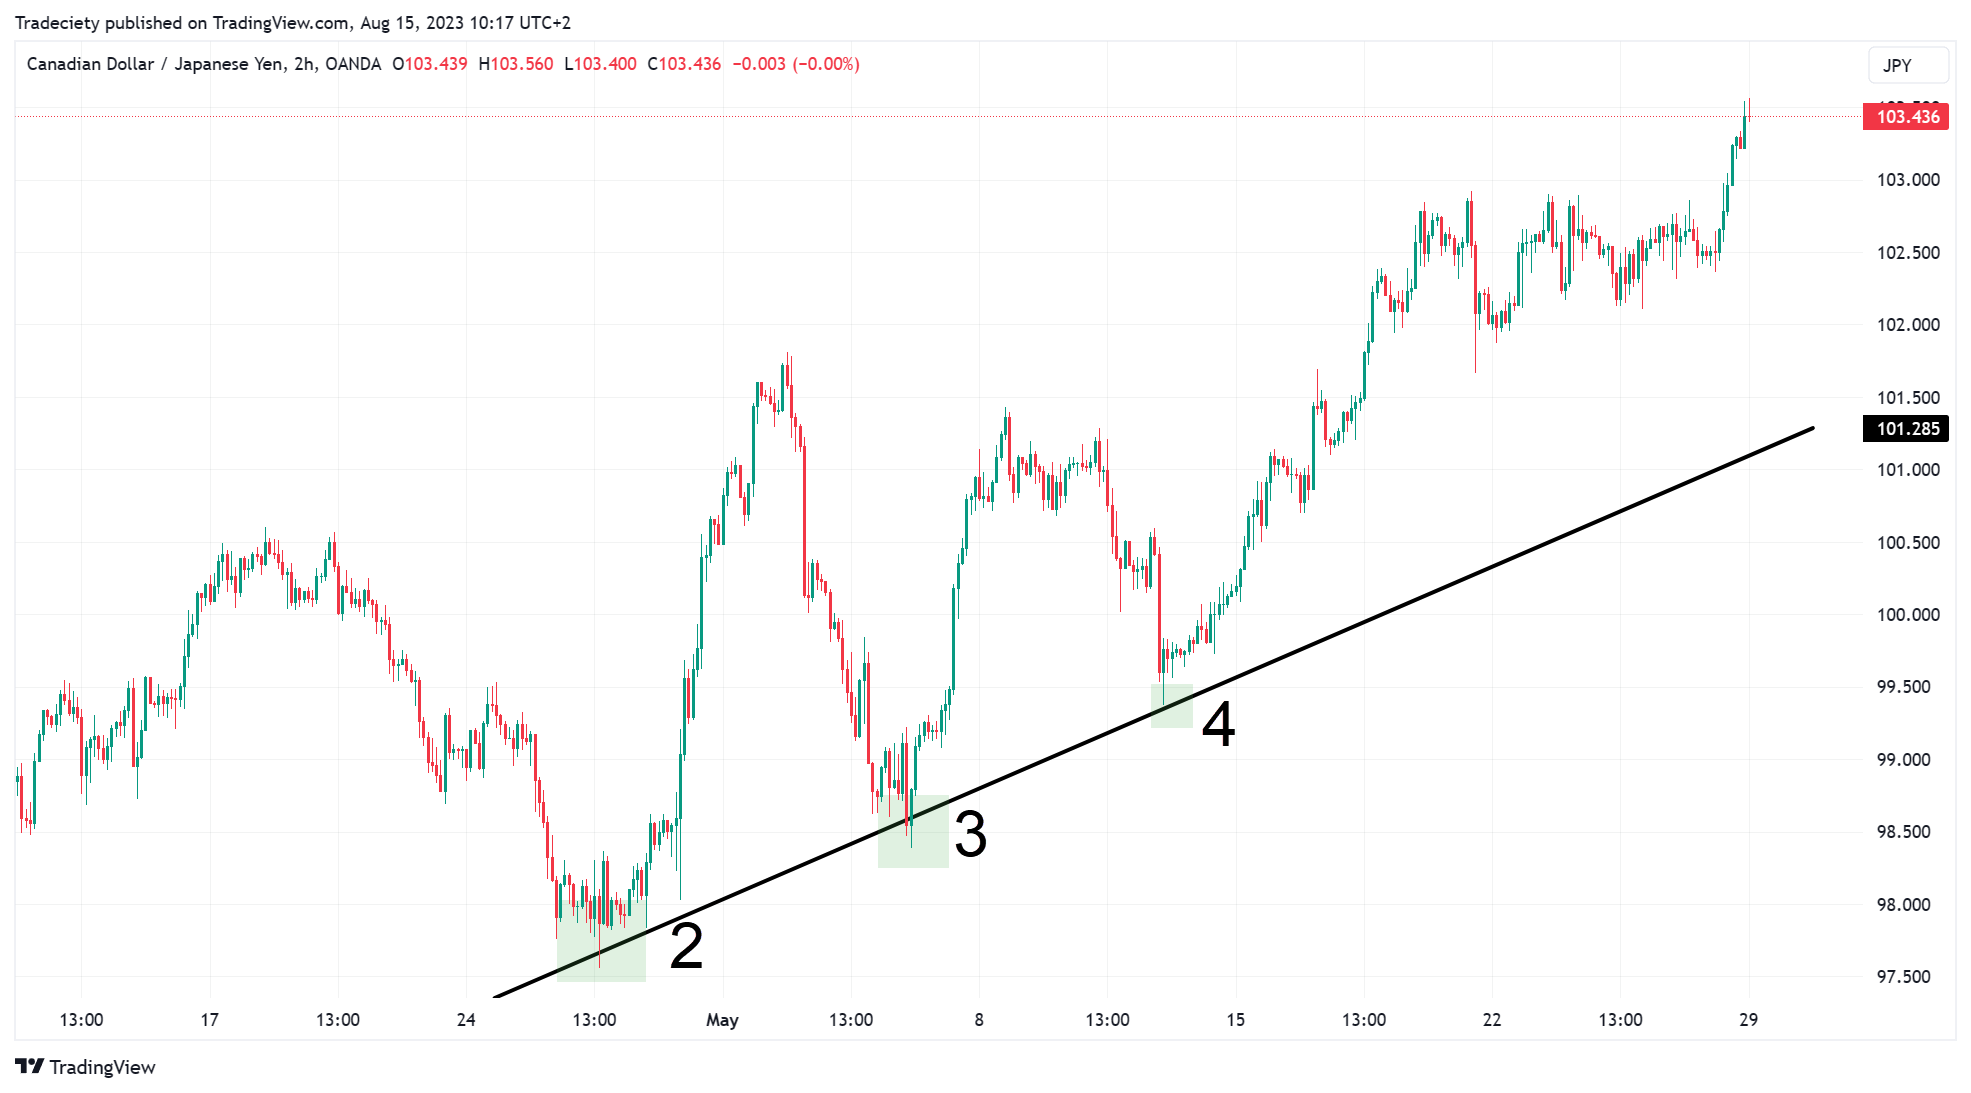
Trendlines are also great tools to use within a multi-timeframe approach whereby traders identify trendlines on a higher timeframe (the Daily or 4H) and then look for chart patterns and rejection signals on a lower timeframe (1H or lower).
Trendlines are a great tool for trend-following trading because, by timing trade entries around a trendline, the trader is waiting for the price to pull back significantly instead of chasing the price as it moves into the trend direction. Traders are, therefore, able to buy a trending market at a discount at a significantly lower price, optimizing their reward:risk ratio.
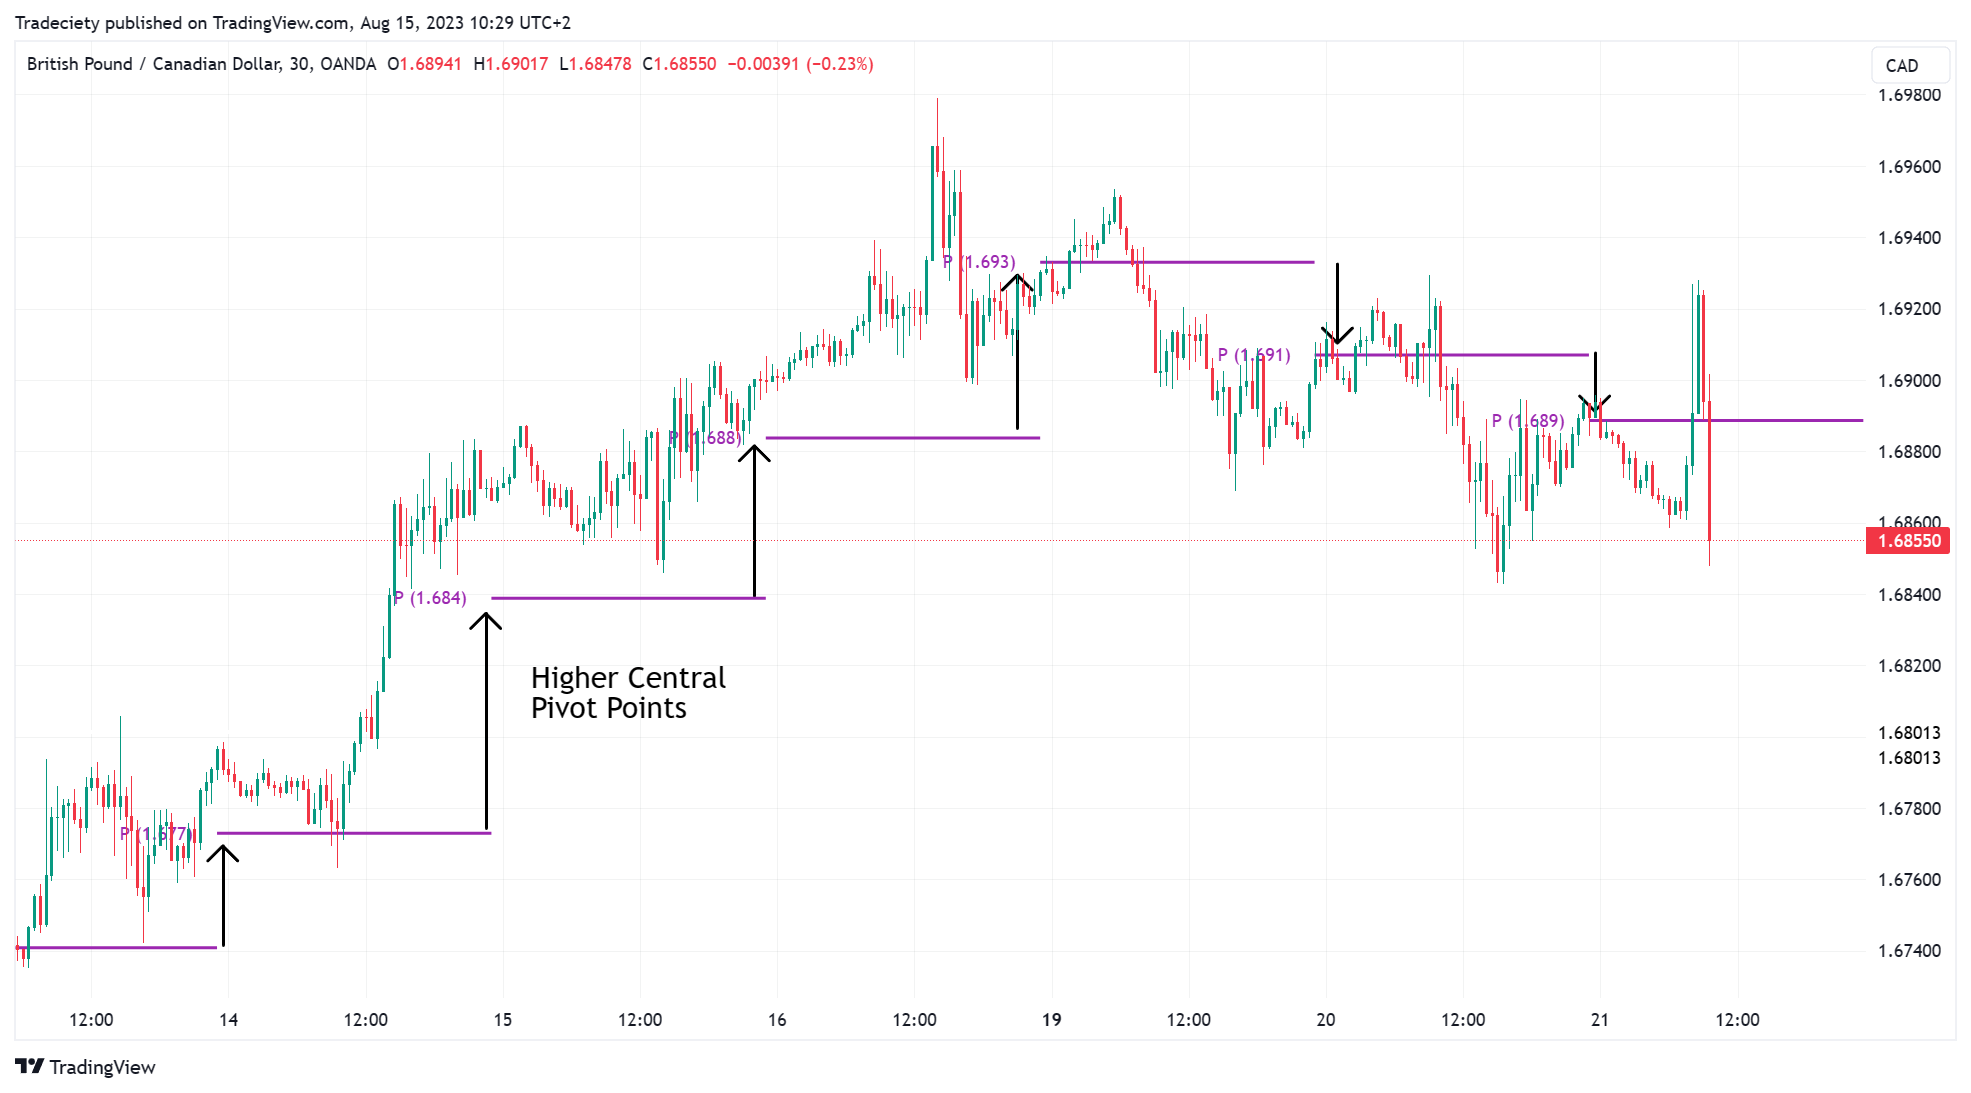
Although pivot points are considered an indicator, they are more than that because they are using important price components. The central pivot point that I have activated in the following charts is providing the average price of yesterday´s price action. As trend-following traders, using the average daily price is important for your overall understanding of the trending environment.
In the screenshot below, the price was first in an uptrend on the left. During the uptrend, the price traded above the pivot point, and each new pivot point is higher than the previous one; the pivot point can, therefore, confirm a trending market. At the right, we now see two consecutive lower pivot points. A change in pivot point direction can often foreshadow a change in the trending environment.
During the newly unfolding downtrend, the price keeps pushing into the pivot point and continuously rejects it. Such pivot point retests might be used as trading signals in a trend-following strategy.
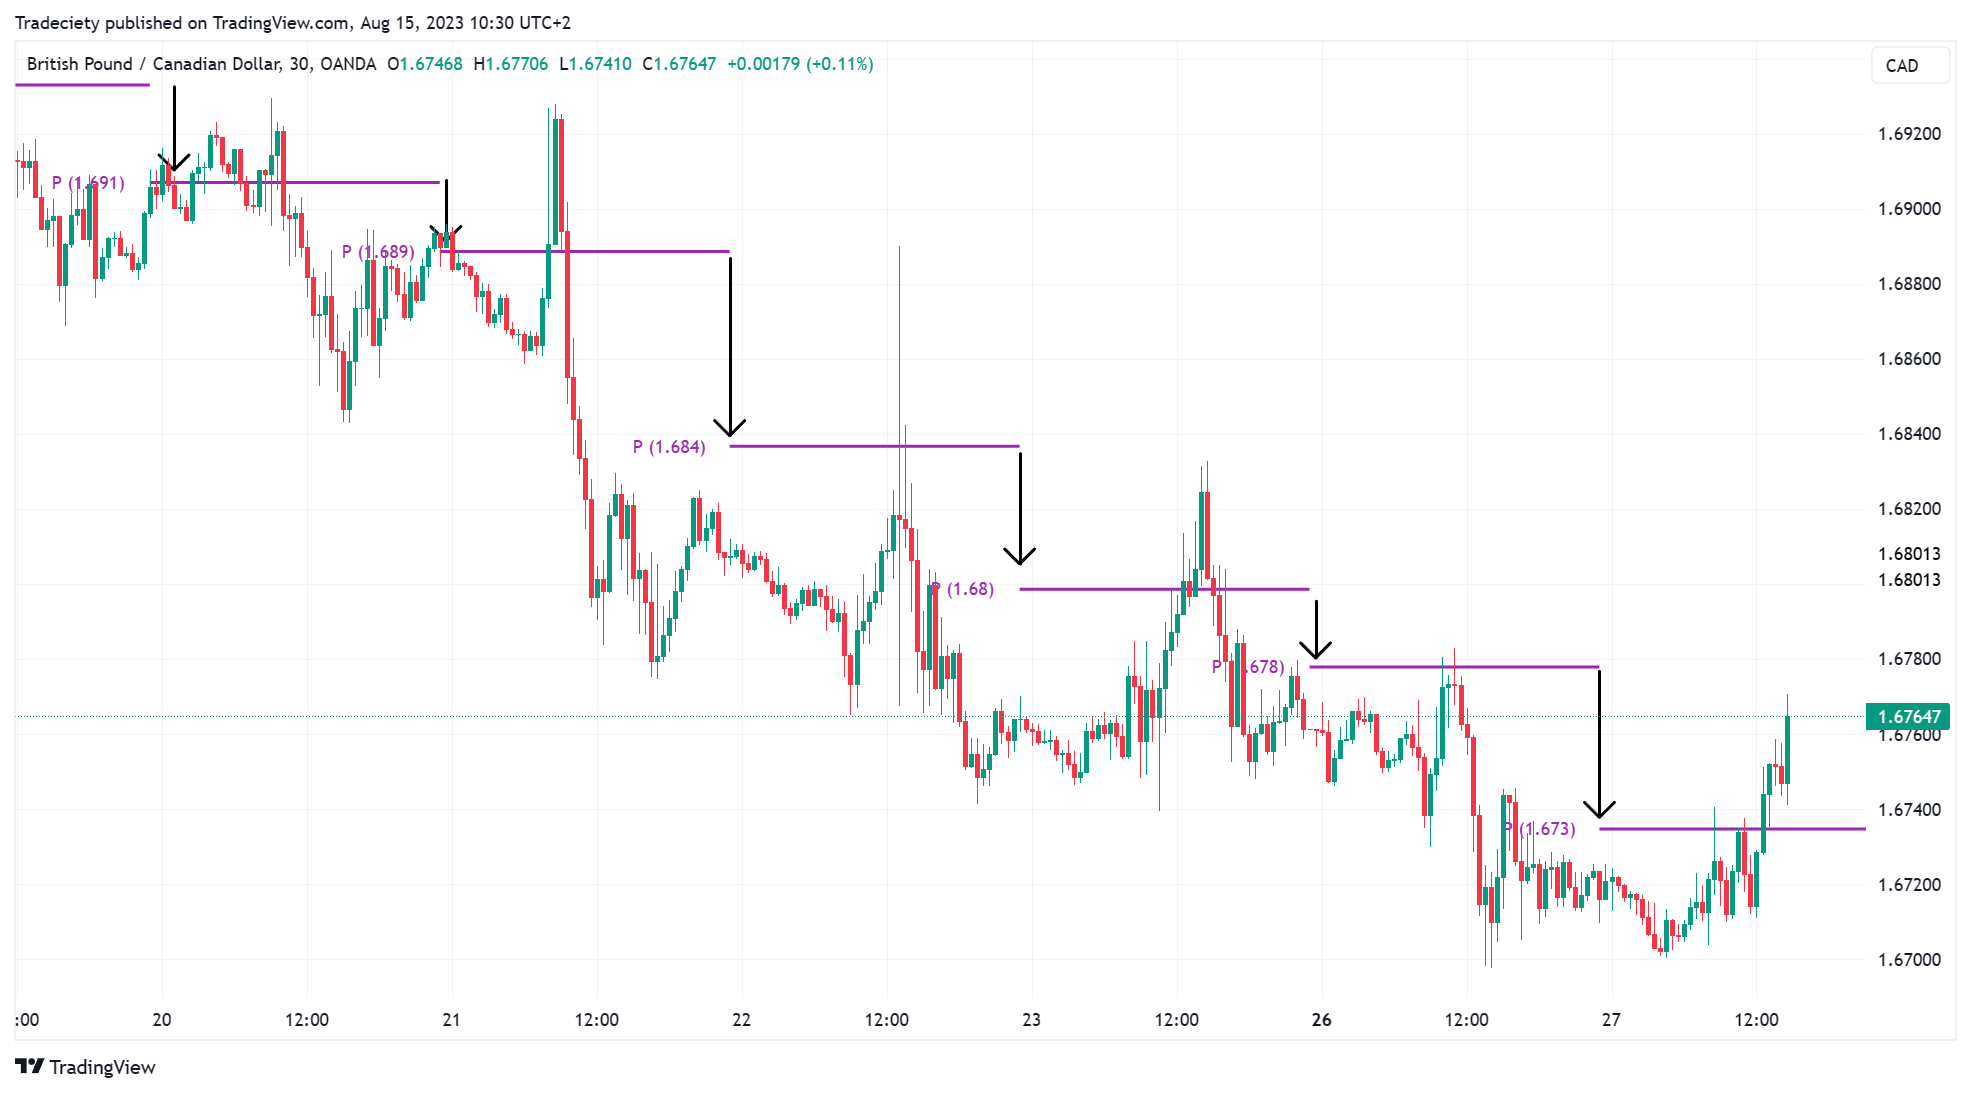
The downtrend continued, showing repeated rejection signals at the pivot points. At the very right, the price now started to trade above the pivot point. A long-lasting price move above the pivot point can be the first sign that the prior downtrend might be coming to an end.
When traders think about the STOCHASTIC indicator, they first think about trading overbought and oversold signals. But what if I told you that this is a wrong and dangerous way of using the STOCHASTIC indicator?
The STOCHASTIC indicator is a pure momentum indicator which means that the STOCHASTIC analyzes how strongly the price and a trend are moving. A high STOCHASTIC, therefore, signals a very strong trending market. Going against the STOCHASTIC would be the wrong decision.
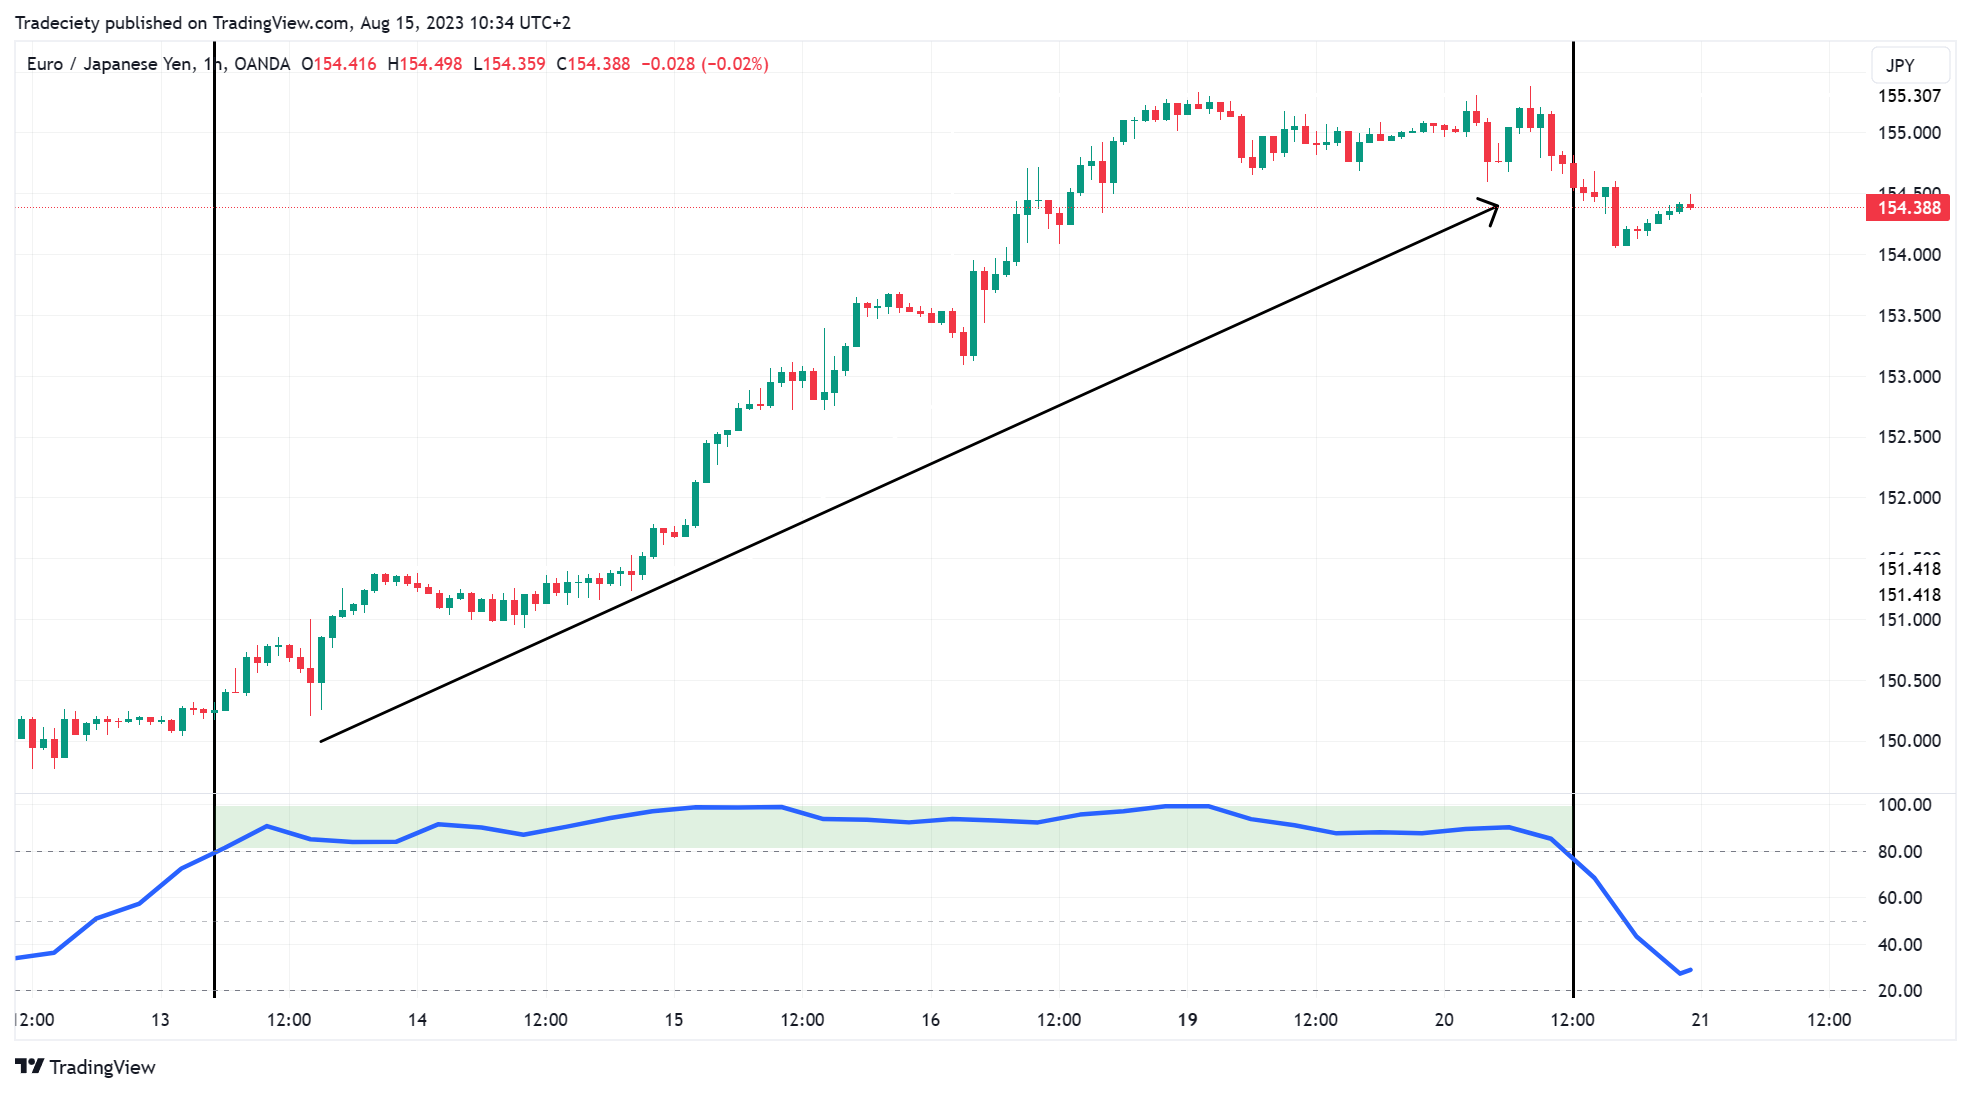
In the screenshot below, I put the STOCHASTIC indicator below the price chart and, as you can see, the uptrend is unfolding as the STOCHASTIC stays above the 80 level, which most traders would call overbought and would look for shorting opportunities. Clearly, this would have been the wrong trading plan.
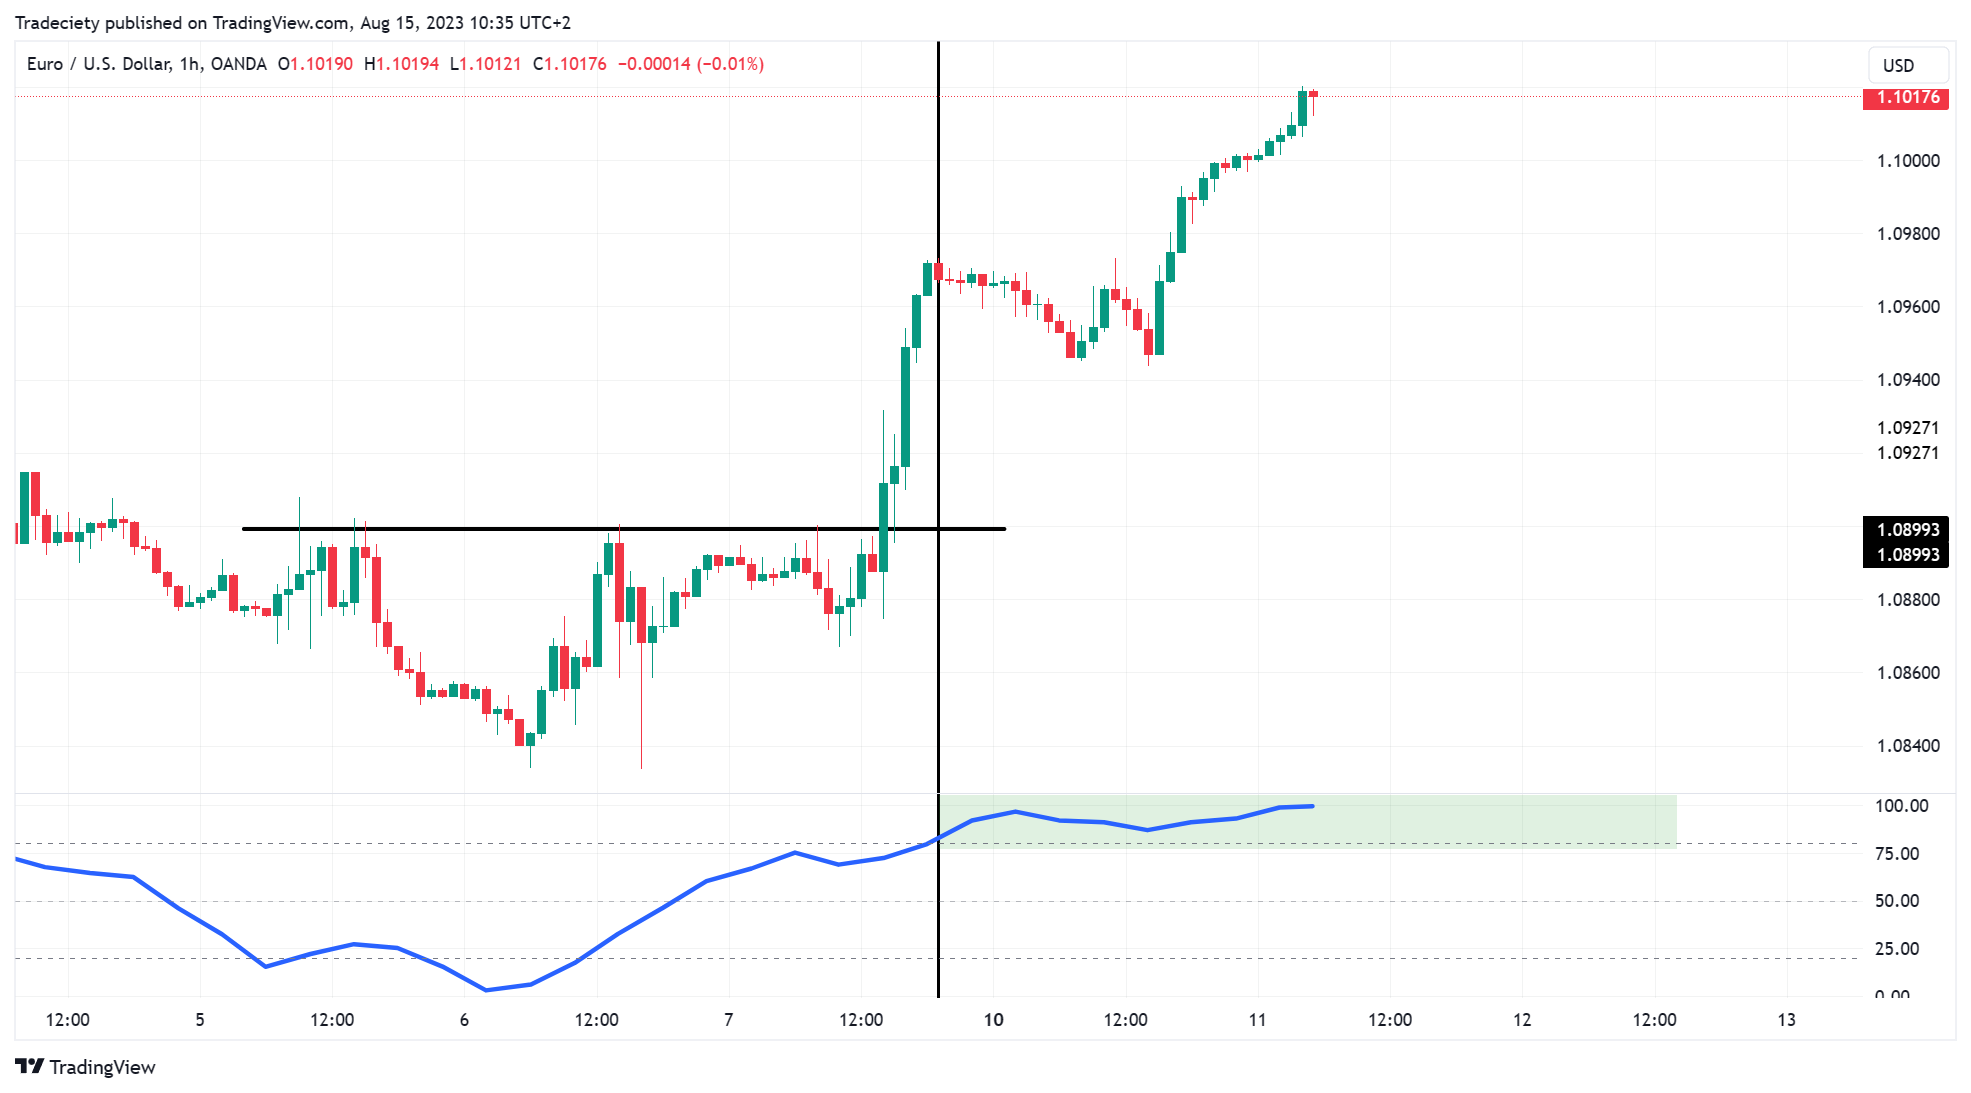
Let´s follow another chart study by looking at the STOCHASTIC indicator. The price has broken above the horizontal resistance level and the STOCHASTIC indicator shortly after has moved into the “overbought” area, above 80. At this point, the indicator signals a strong trending market. From now on, looking for bullish trend-following trading signals might provide better trading opportunities.
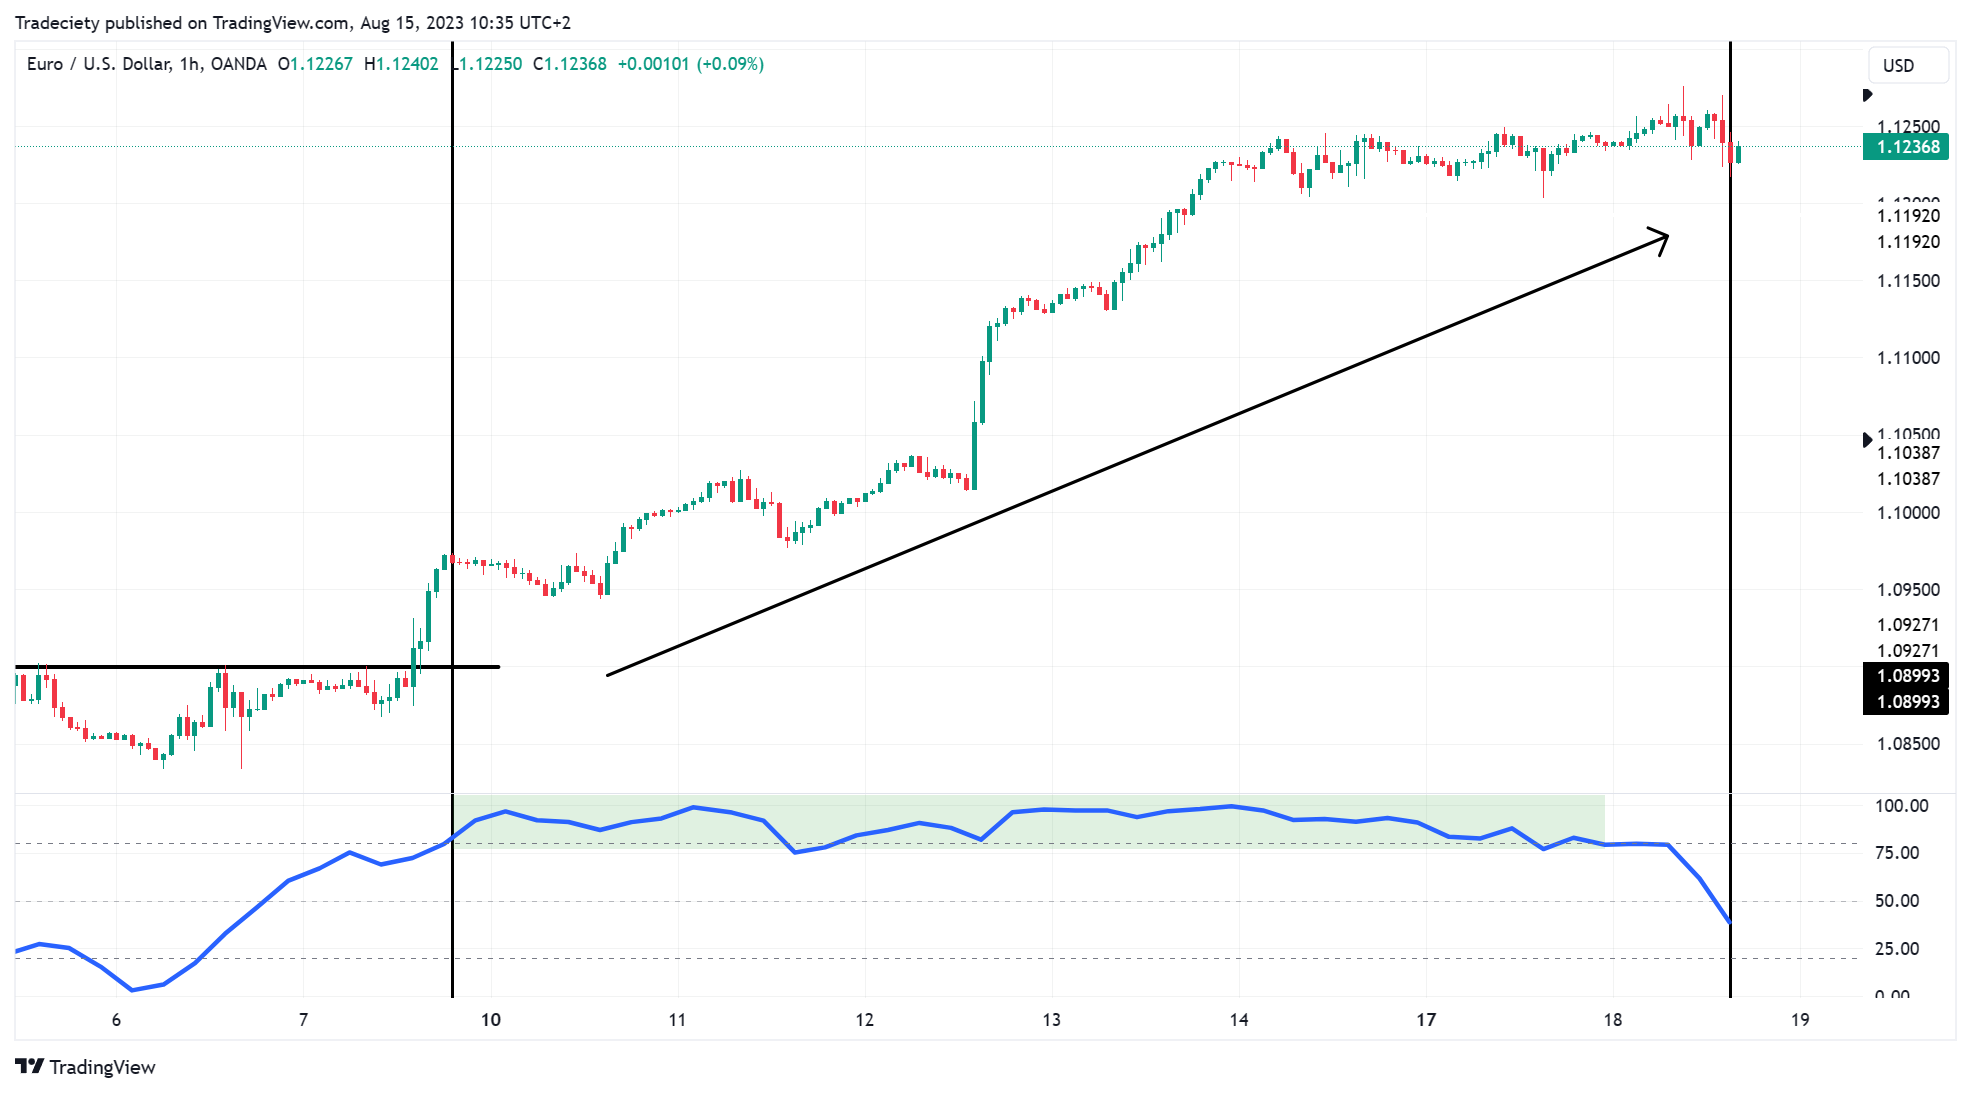
As we can see, the bullish trend kept going for a long time while the STOCHASTIC stayed above the 80 level.
Do not dismiss indicators too fast and, instead, try to understand their true meaning. The STOCHASTIC indicator is the best example of how traders often have a wrong understanding of their trading tools and then believe that they are “not working”, whereas they are applying their tools in the wrong context.
When it comes to trend-following trading, we can find an abundance of trading strategies and different techniques. And although this article explained only five ways for trading trending markets, the underlying concepts of trend-following trading are always the same.
First, you identify a trending market and then you can choose from a wide variety of tools and concepts to determine trading opportunities in the trend direction. Pullback and breakout concepts are usually the common choices hereby.
Furthermore, traders should not neglect the importance of trade exits. And especially in a trend-following approach, exits can make or break a trading strategy. The goal of a trend-following trading strategy is to optimize large winners by catching long-lasting trending phases. If you have been trying to trade a trend-following strategy but you haven’t seen the success that you were hoping for, analyze your exit approach and evaluate its effectiveness in your trading journal. Whenever I work with traders, I often see a huge potential for improvement when it comes to exit strategies.
external link:


We have been trading supply and demand strategies for over ten years, and they have stood the test of time remarkably well. Supply and demand is...

3 min read
Choosing the right trading journal is essential for traders wanting to analyze performance, refine strategies, and improve consistency. In this...

3 min read
“95% of all traders fail” is the most commonly used trading related statistic around the internet. But no research paper exists that proves this...