Supply and Demand Trading in 2026
We have been trading supply and demand strategies for over ten years, and they have stood the test of time remarkably well. Supply and demand is...
Pivot Points have been around forever in trading but as with so many trading tools, lots of misinformation has been spread as well. In this article, we will introduce the most important concepts that will allow you to use Pivot Points more effectively in your trading.
Pivot Points are price levels that are calculated based on previous price action. The calculation of the main Pivot Point is very straight forward and simple:
(High of previous day/week + Low of previous day/week + Close of previous day/week) / 3 = Central Pivot Point
So you can see, the central Pivot Point is just the average of last week’s price action more or less.
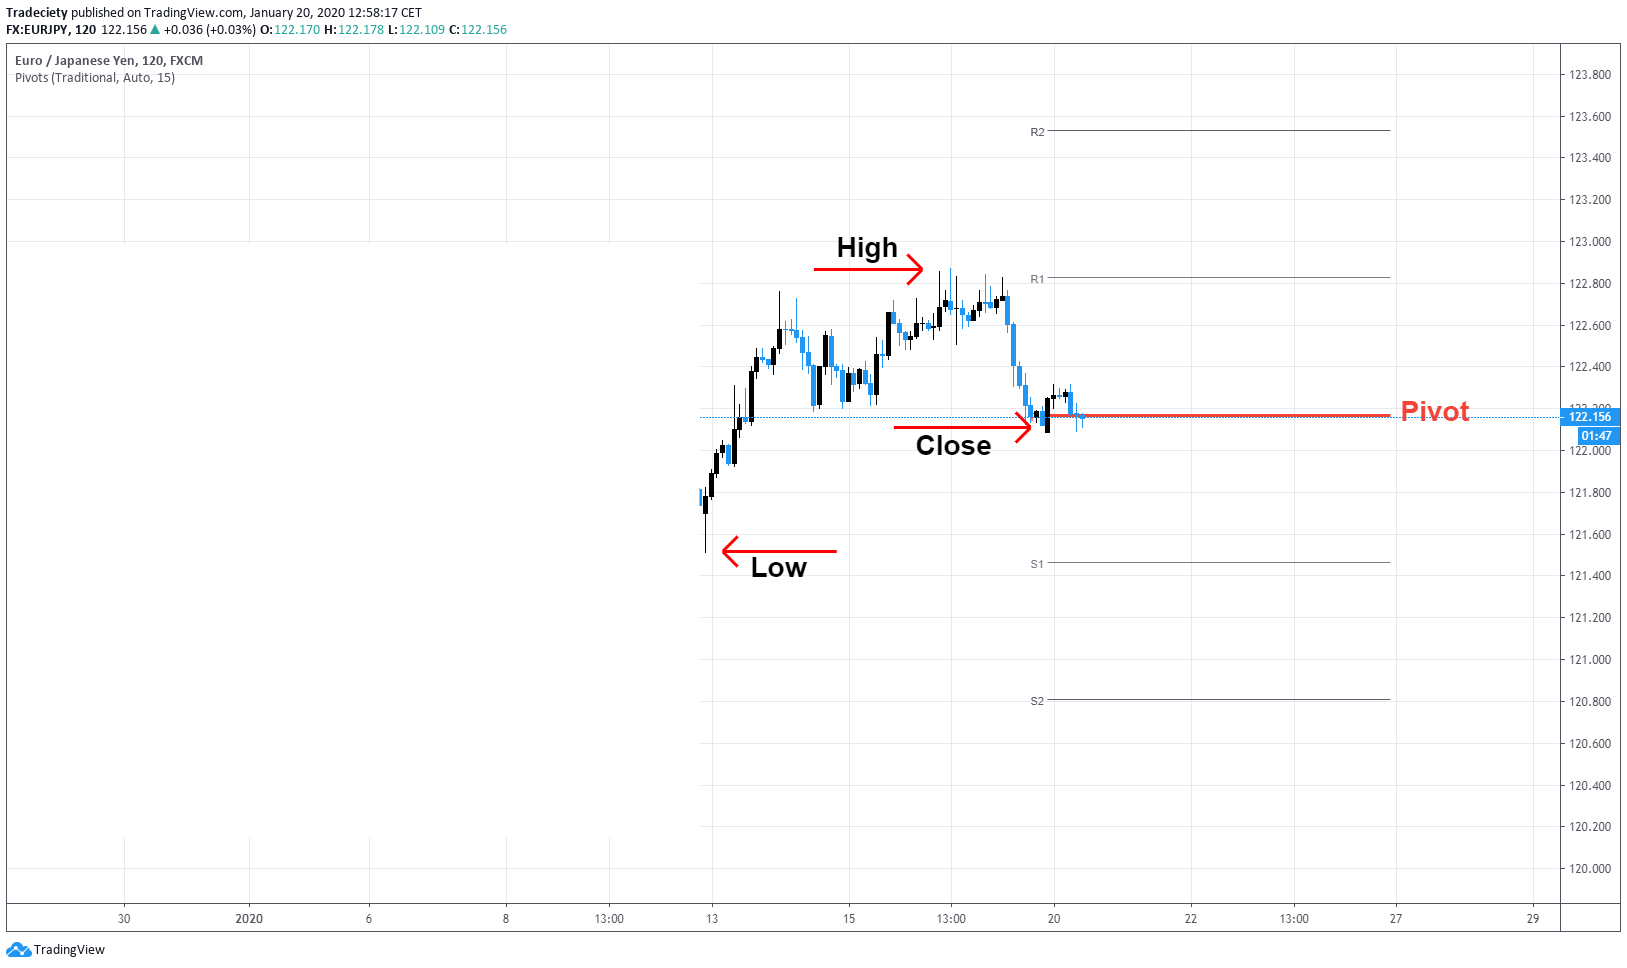
In the screenshot below, I marked the High, the Low and the Close of the previous week’s price action. The resulting Pivot Point (red line) is the average of those 3 price levels.
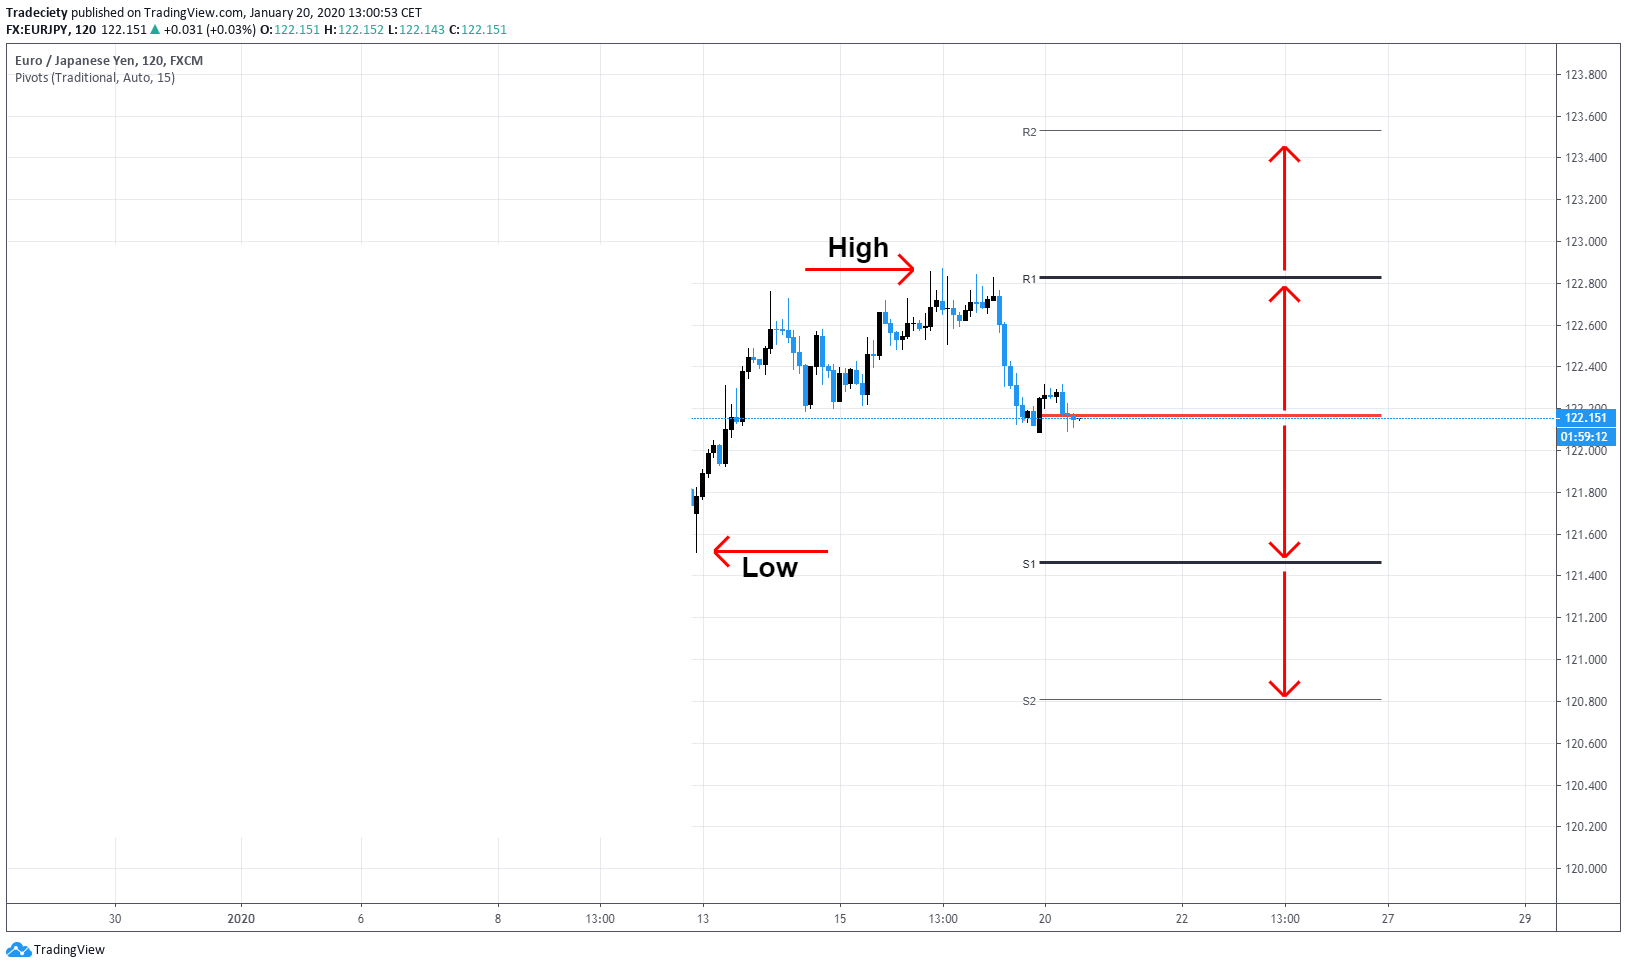
Above and below the central Pivot Point, further Pivot levels can be found. They are named R1 – R4 for the resistance Pivot levels above the central Pivot Point and S1 – S4 for the support Pivot levels below the central Pivot Point.
The S and R Pivot levels are calculated based on the central Pivot Point and the previous high and low of the price action. Therefore, the further away the high and the low from the Pivot Point are, the further away the S and R price levels.
There are multiple ways how you could use Pivot Points and in this article, I will introduce two trading techniques for Pivot Points. In our Masterclass, we also teach one day trading method that is based on Pivot Points, together with other trading tools.
But generally, Pivot Points are either used as a tool for support/resistance trading that then allows us to time trades more effectively.
On the left, you see how the central Pivot Point acted as support multiple times at point (1) and (2). At point (3), the central Pivot Point acted as a resistance. Especially the central Pivot Point works well because a lot of traders use it. In the later part of this article, we will take a look at trading strategies that are based on the central Pivot Point.
On the right, we see a Pivot Point rejection together with a flag pattern. Central Pivot Point rejections are a powerful tool and can build the foundation of various trading systems as we will see next.
Central Pivot Point rejections and fake-breakouts are one popular trading strategy.
For that, a trader would wait for the price to move into the central Pivot Point, make a move beyond it and when the price falls back, initiate a trend.
In the screenshot below, you see two such examples. The price tried, on two consecutive days, to break the central Pivot Point from below but failed each time. The price wasn’t able to stay above the central Pivot Point. Especially during long-lasting trending phases, trend-following entries could be times using the failed breakout approach.
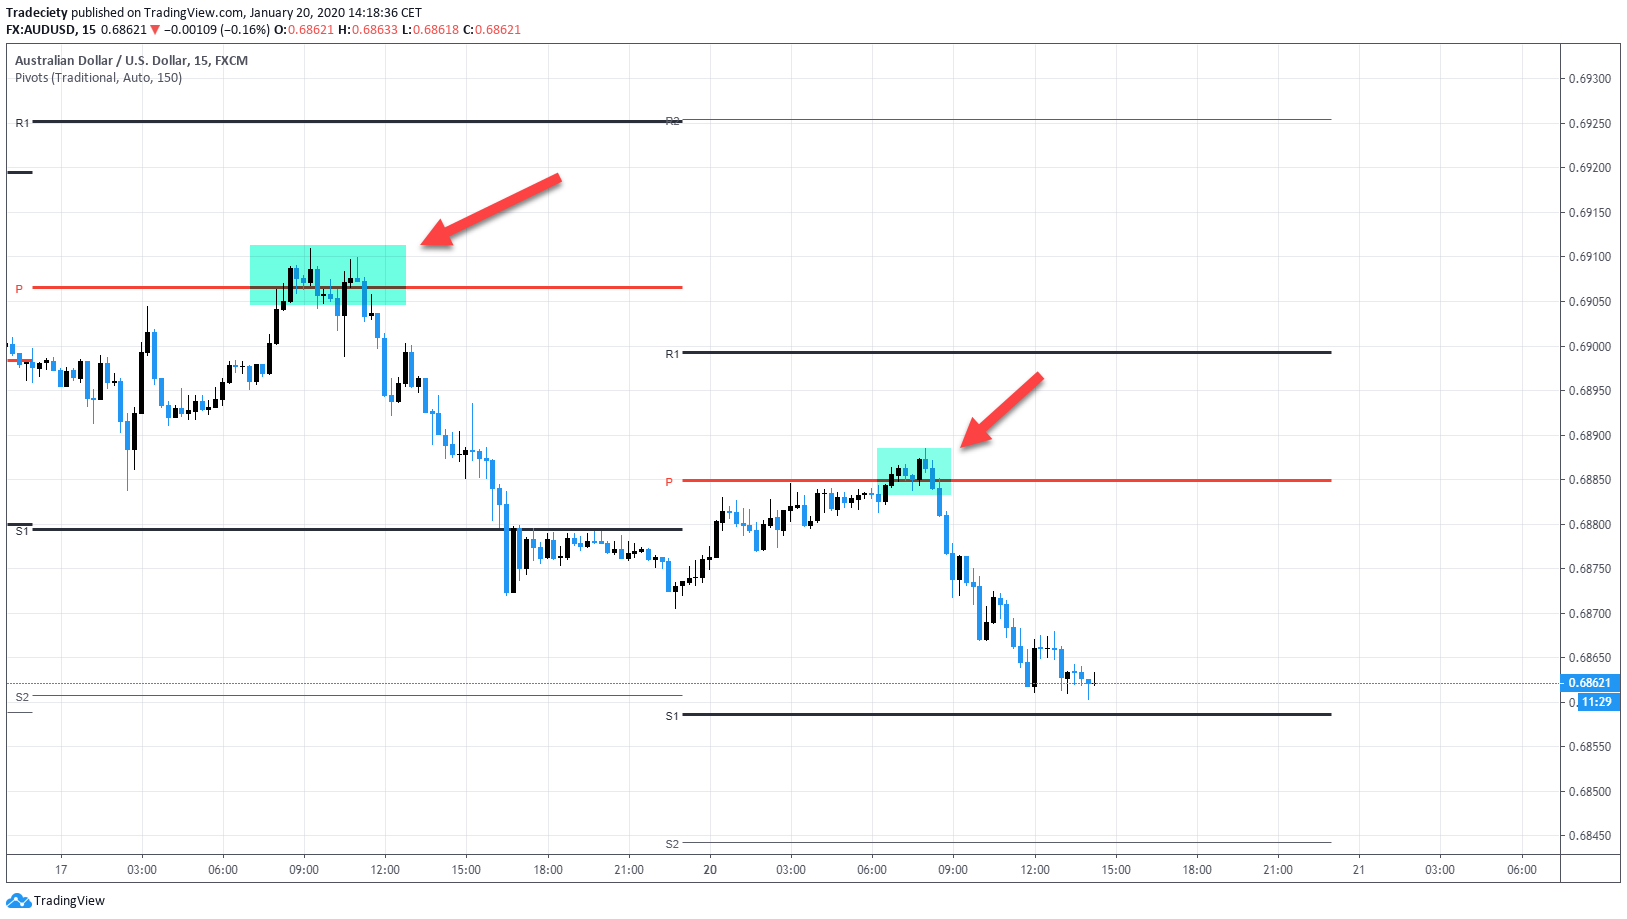
Sometimes, the fake breakout occurs with a candlestick confirmation signal. In the screenshot below, the price broke below the Pivot Point and the next candle formed a small pinbar. Ideally, pinbars should be larger in size, but the idea is the same. The pinbar shows a lack of follow-through and indicates rejection.
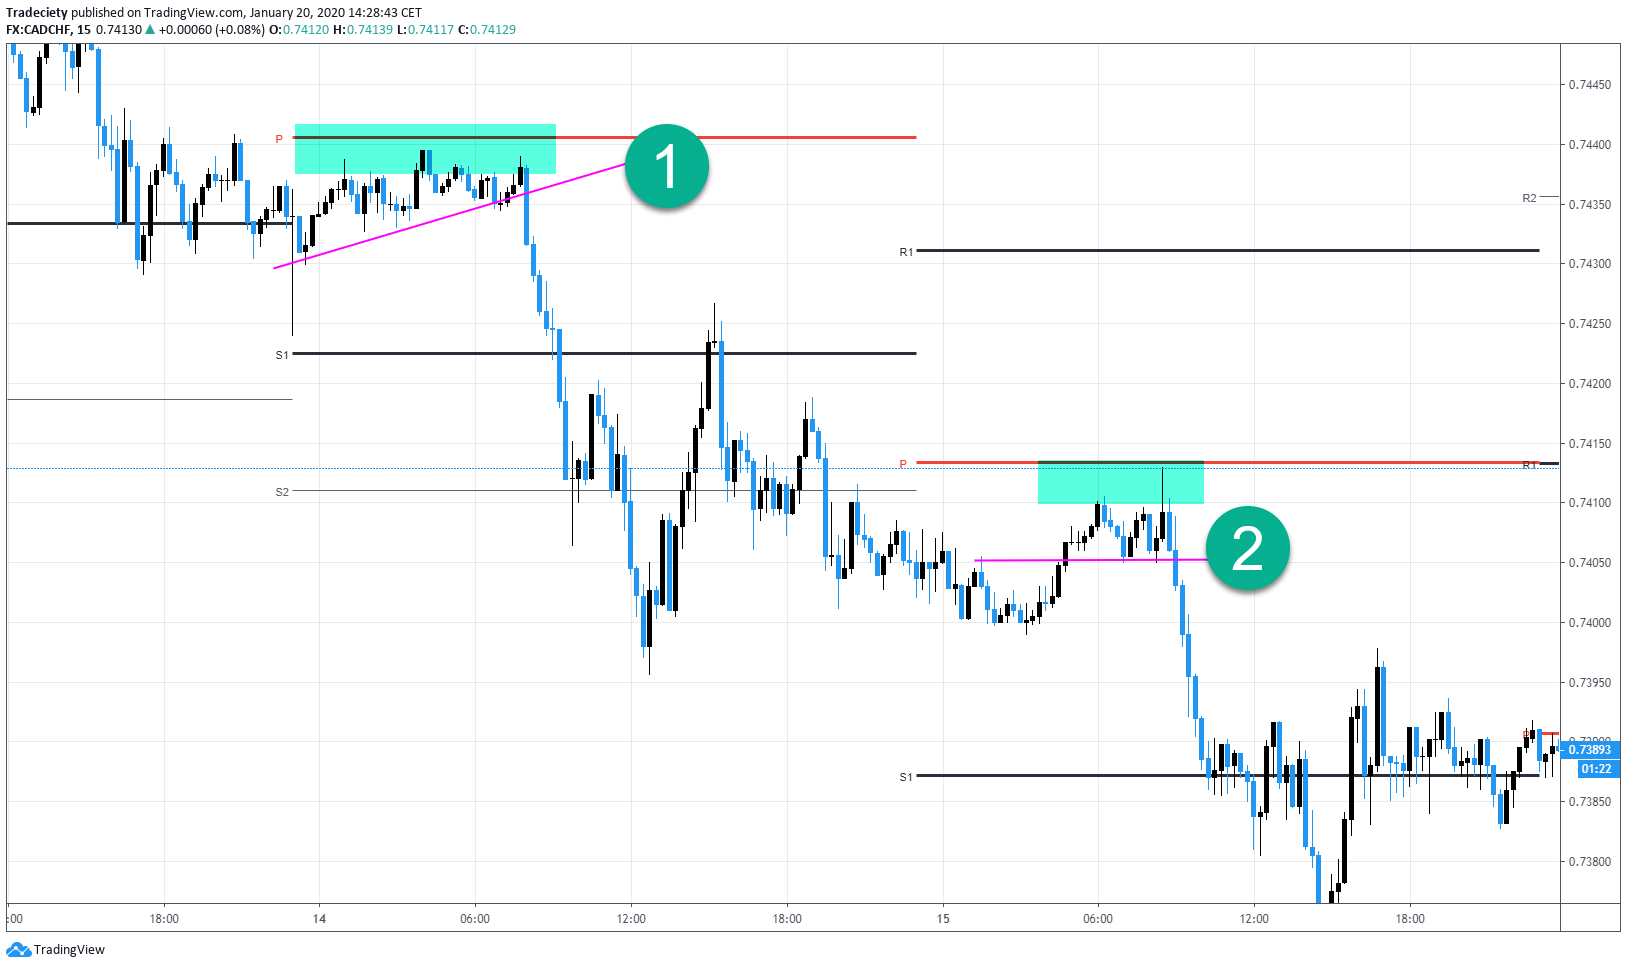
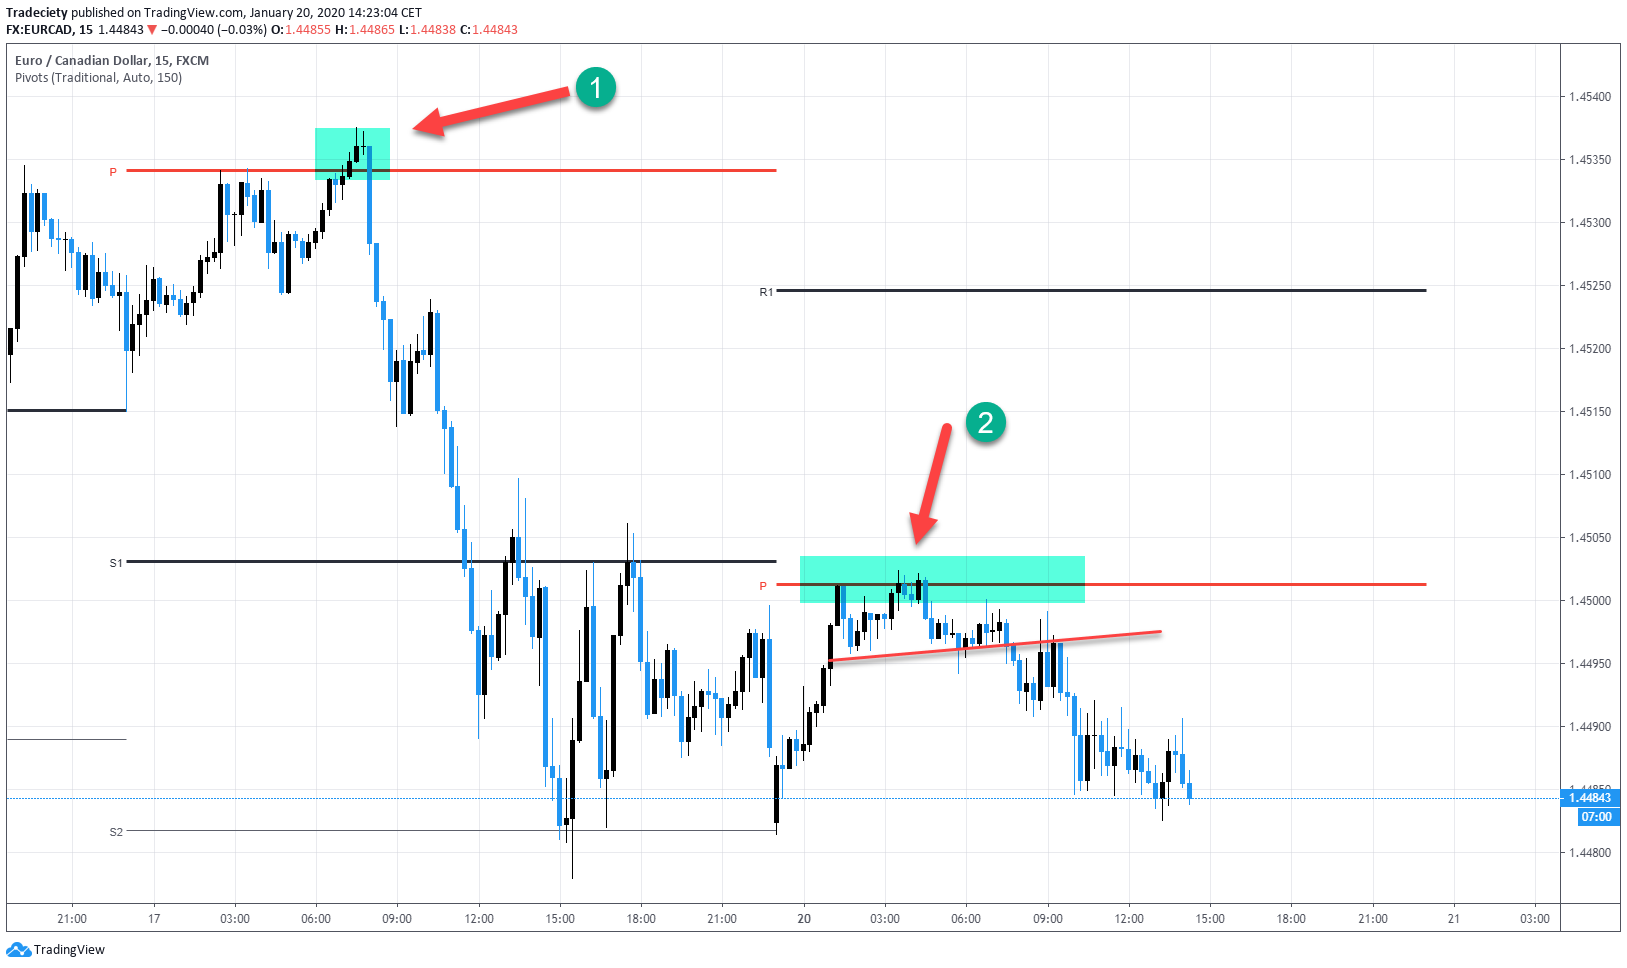
In the screenshot below we first see a Pivot Point rejection at point (1) where the price tried to break above it and then fell back below quickly. The candle that shows the rejection was the huge bearish candlestick that closed back below the Pivot Point. This large candle clearly shows a lack of buyers’ interest.
Point (2) foreshadows our next Pivot Point strategy. Often, you will see that the price is hovering on one side of the central Pivot Point without being able to break it. Sometimes, we will be able to identify a price action pattern around those levels. In this case, we can draw a trendline, marking a flag pattern. The break of the pattern then allows us to time trades away from the Pivot Point. The lack of momentum that didn’t allow the price to break the Pivot Point was the first clue here.
When the price hovers below or above a central Pivot Point for numerous candles without being able to break it, it already can indicate a lack of momentum.
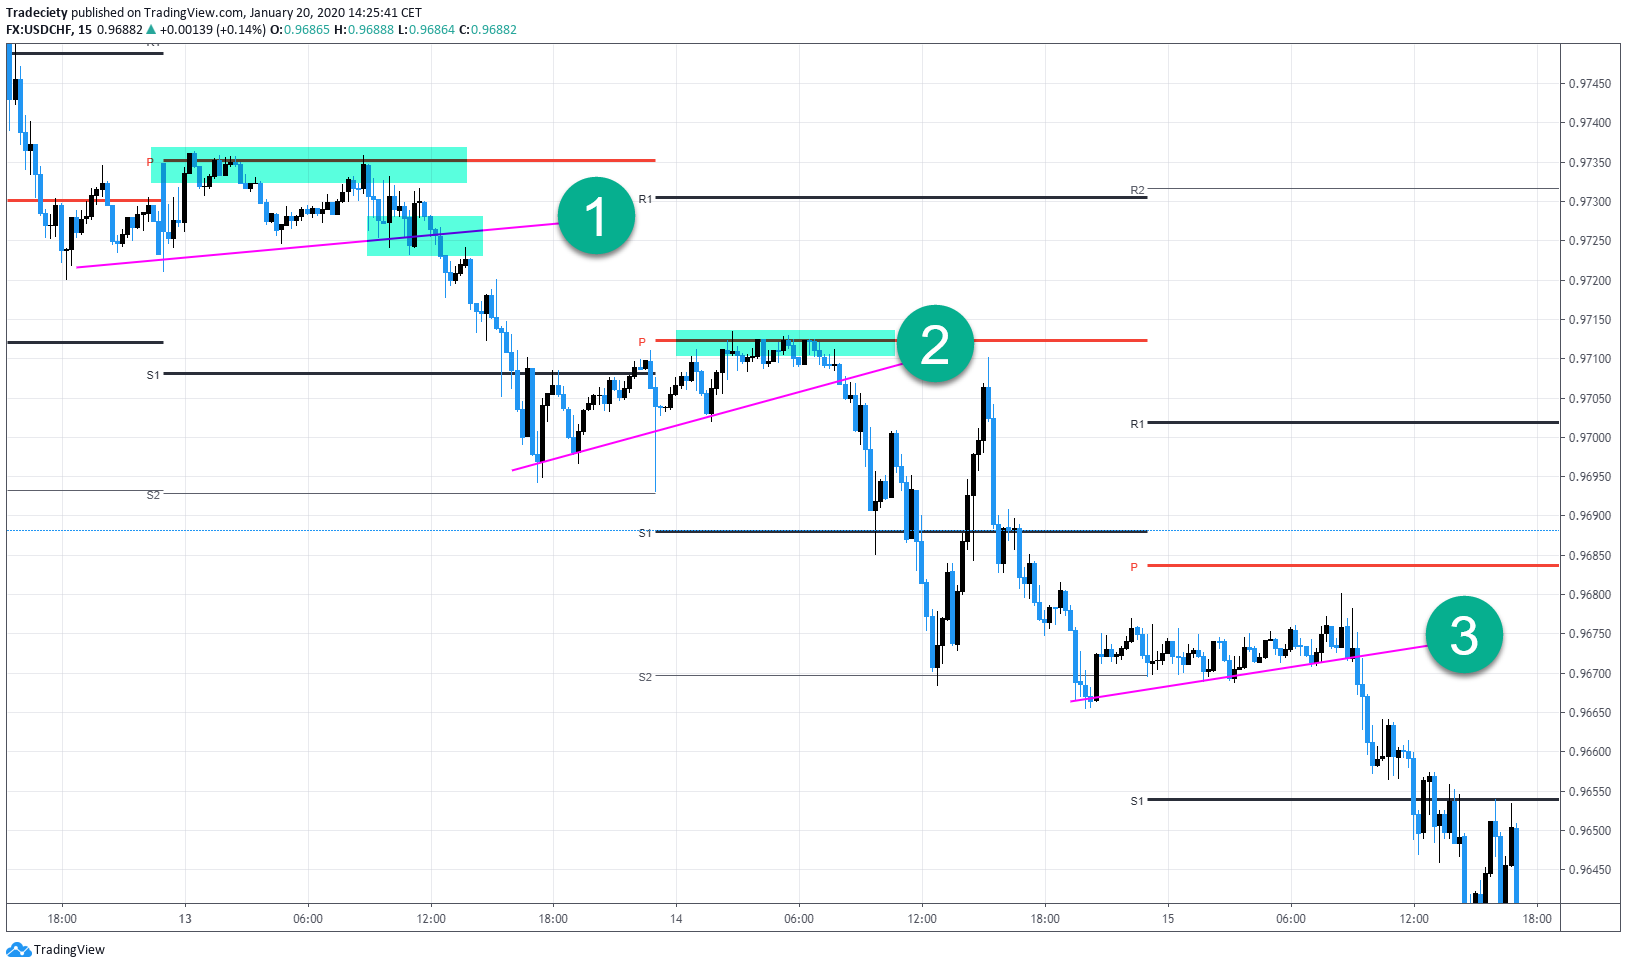
In the screenshot below, the price hovered below the central Pivot Point at points (1) and (2) for a long time. Simultaneously, a trendline was established during that time below the central Pivot Point. Then, a trader would only need to wait for the price to break the trendline to start looking for trading opportunities.
At point (3), the price had already been in a prolonged downtrend and the price didn’t even come close to the central Pivot Point while established the flag-trendline pattern.
During a trending market, such an approach may be used to time trades into the trend direction.
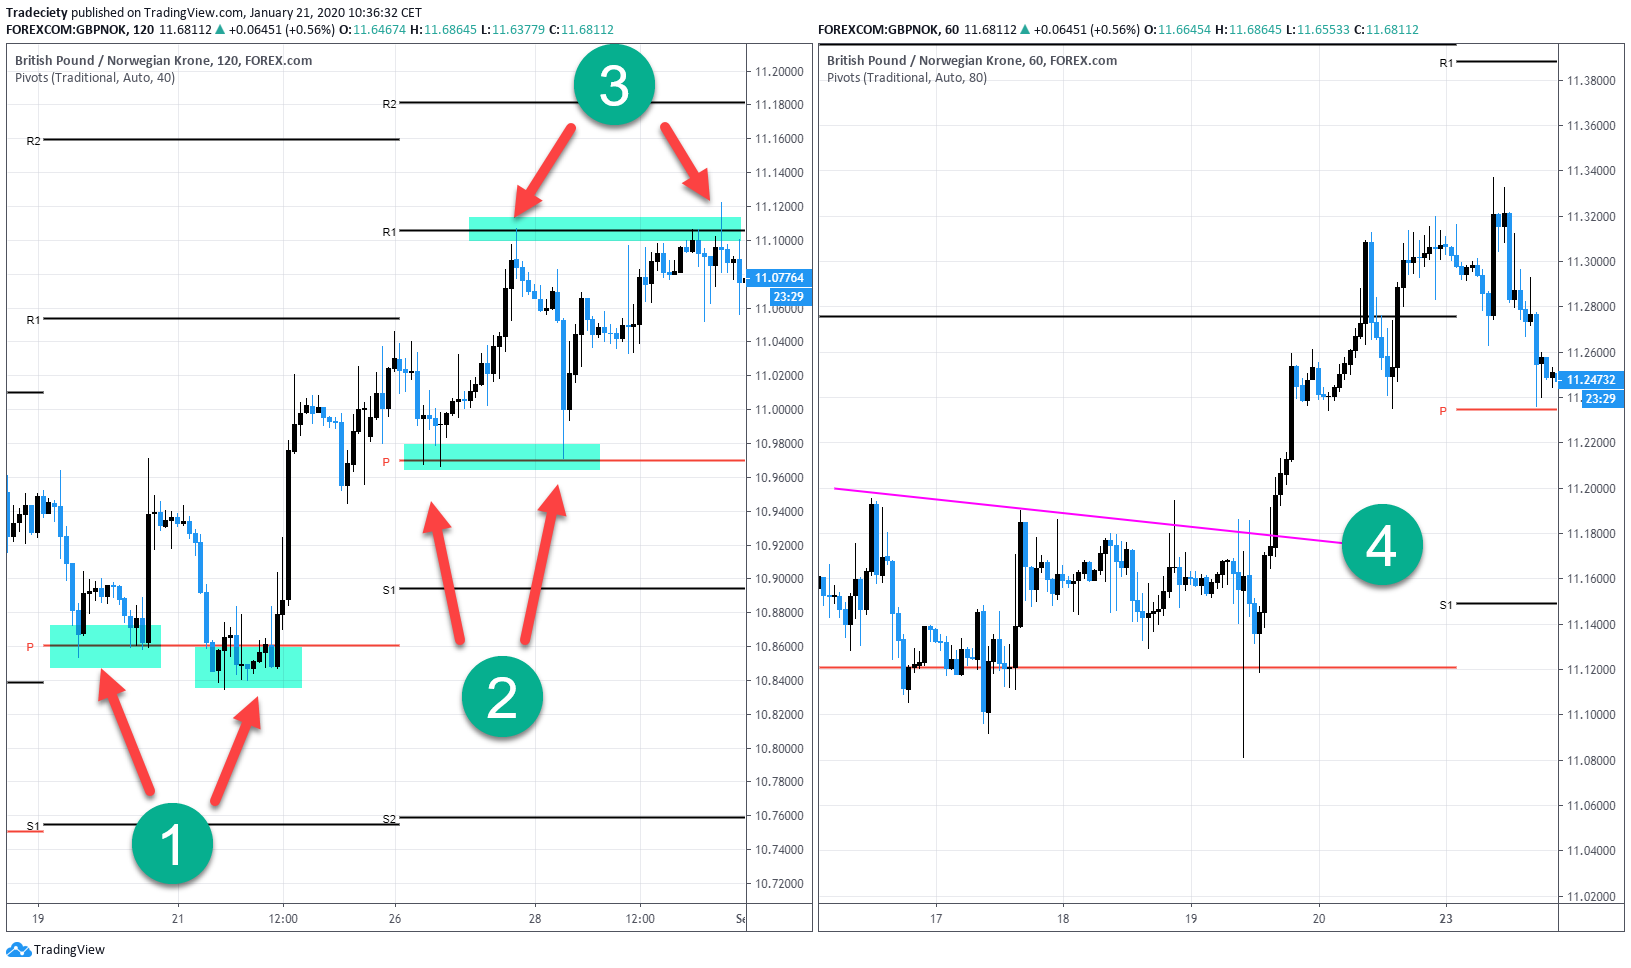
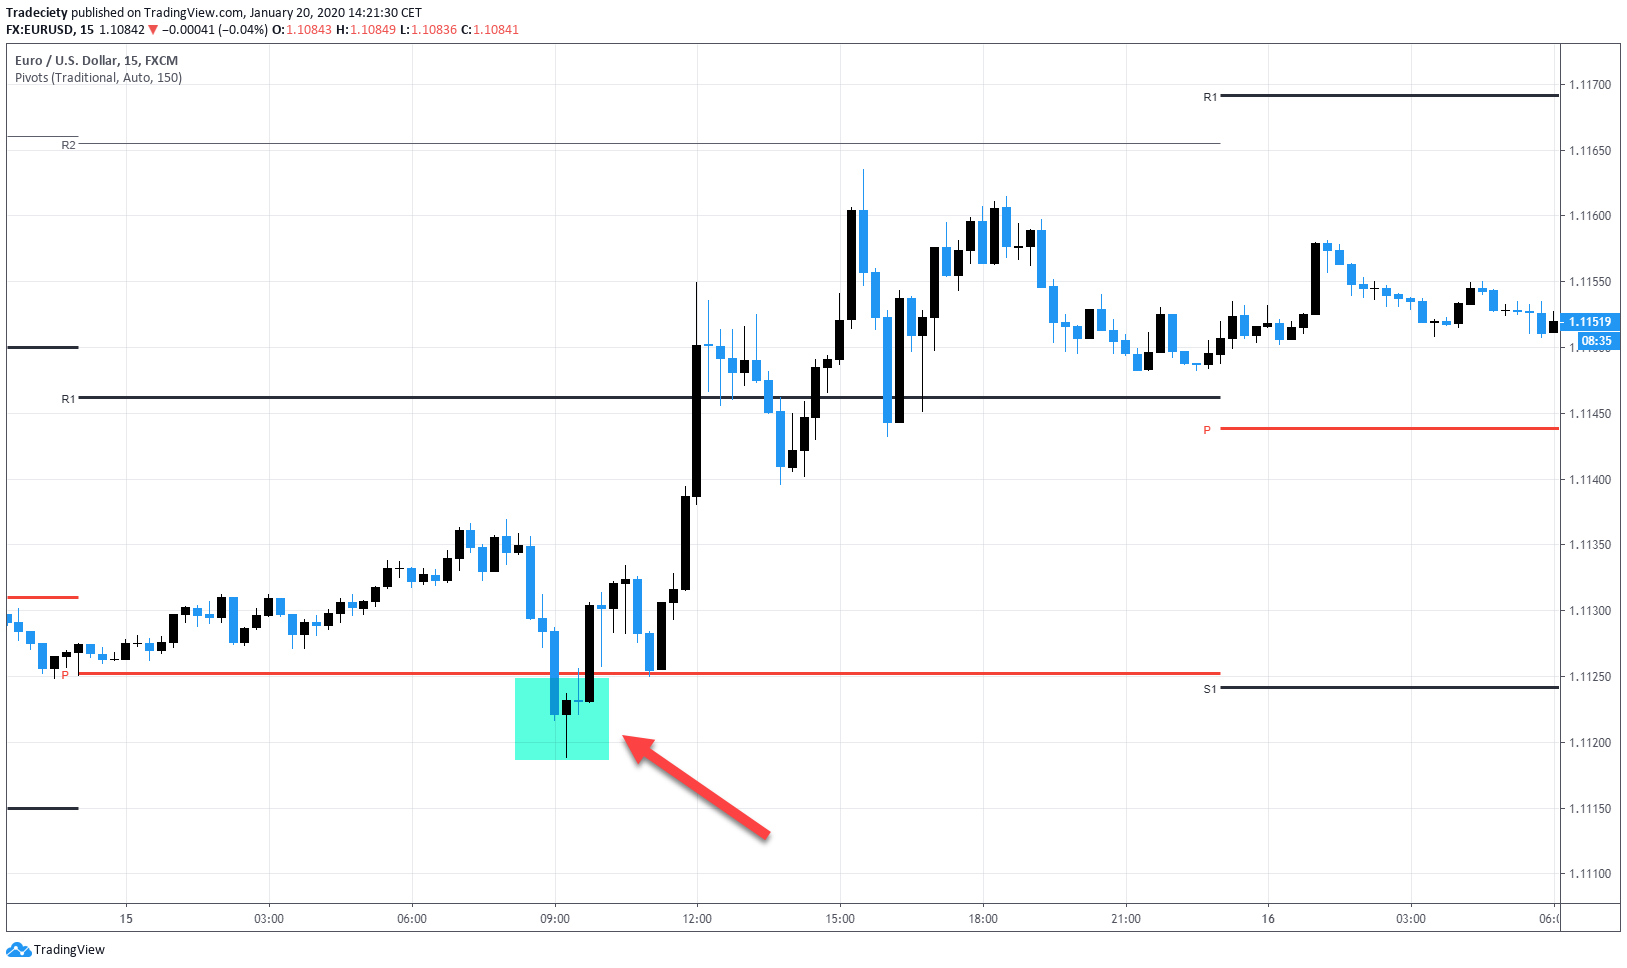
The scenario at point (1) in the screenshot below shows another trendline break just after the price hovered below the central Pivot Point for a long time.
At point (2), the price established a horizontal support level as the breakout level. The price also traded below the central Pivot Point in this example for a long time without being able to break about it. Whenever you are able to define a pattern with a horizontal support/resistance line or a trendline, you could look for trading opportunities if the Pivot Point context also indicates a potential trade idea.
Of course, trading Pivot Points on their own is usually not robust enough and it is always advisable to layer additional confluence factors around such a trading approach. But it is a great starting point for any trading strategy and as an alternative approach to common support/resistance tools.
external link:


We have been trading supply and demand strategies for over ten years, and they have stood the test of time remarkably well. Supply and demand is...

3 min read
Choosing the right trading journal is essential for traders wanting to analyze performance, refine strategies, and improve consistency. In this...

3 min read
“95% of all traders fail” is the most commonly used trading related statistic around the internet. But no research paper exists that proves this...