Supply and Demand Trading in 2026
We have been trading supply and demand strategies for over ten years, and they have stood the test of time remarkably well. Supply and demand is...
A trader who knows how to find, understand and trade chart patterns will be able to navigate the financial markets effectively. Chart patterns are at the origin of all major price moves, they are the connection between trends and they are one of the most important market phenomena.
In this article, you will learn everything there is about chart patterns and how to master them in your trading. Trading chart patterns can be a standalone-trading strategy. Furthermore, this article will help you understand chart patterns in a non-textbook environment whereas most trading resources just focus on memorizing and template thinking. The financial markets are complex and always changing and a trading approach should adapt to the ever-changing nature of financial markets. The goal of this article is to provide a framework for reading any market without the need to memorize textbook patterns.
When we look at any price chart you will see the following market phases:
Of course, the phases come in different intensities, shapes, and sequences. But a price chart is always limited to those three market phases.
Chart patterns are the connectors between two different market phases.
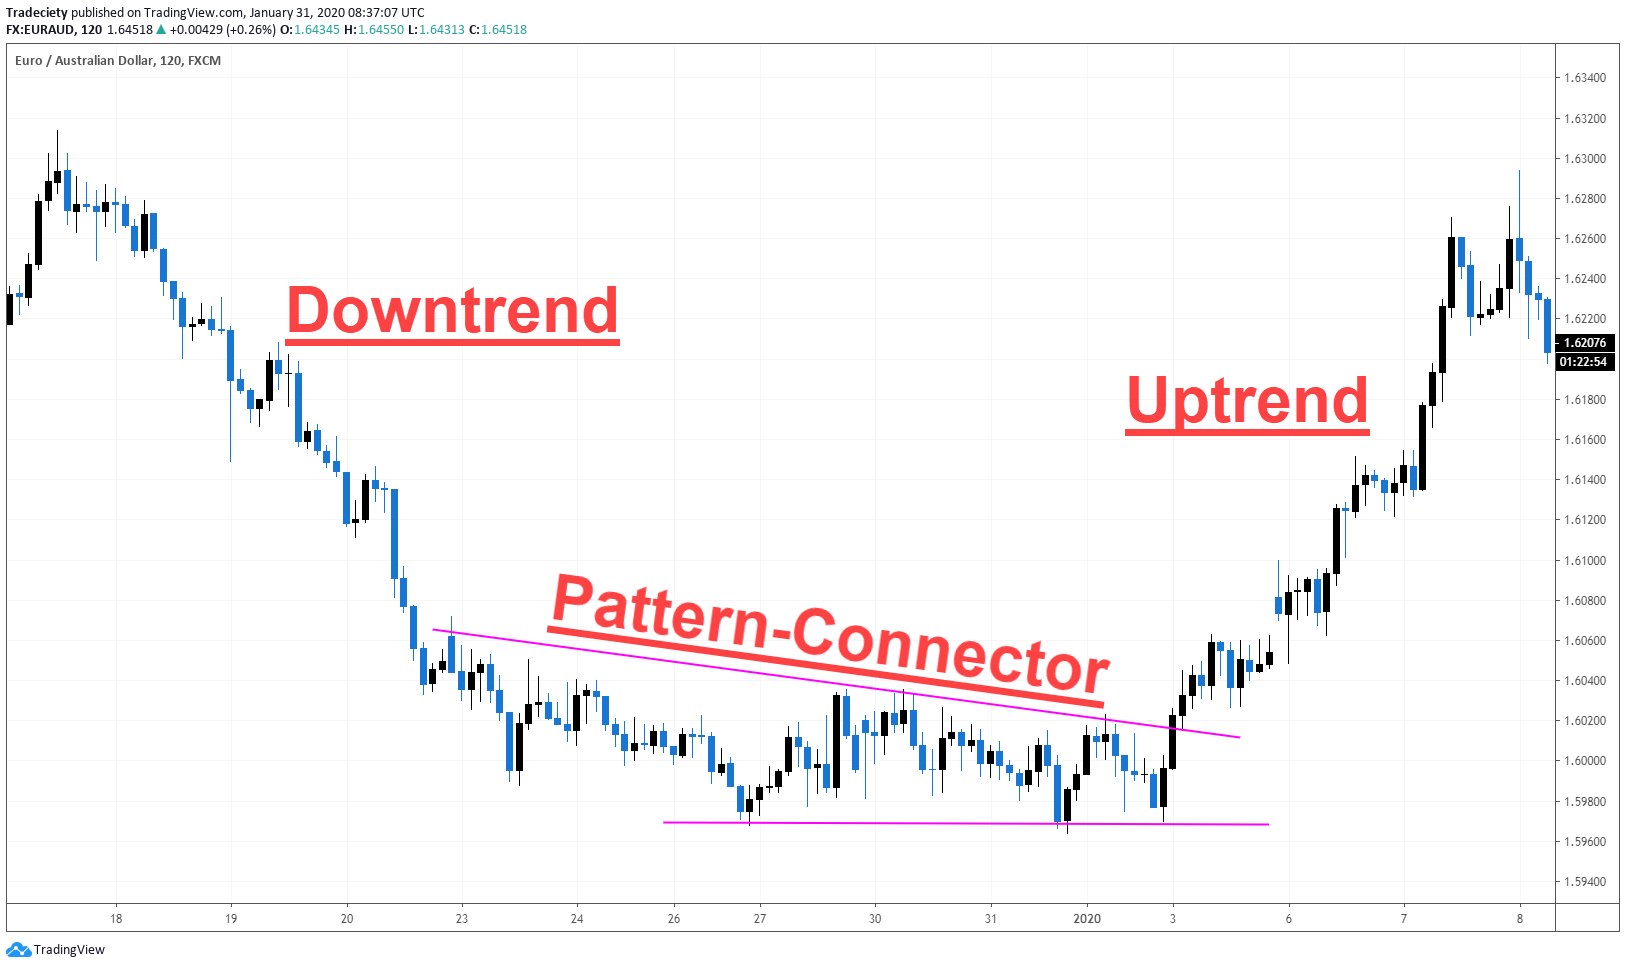
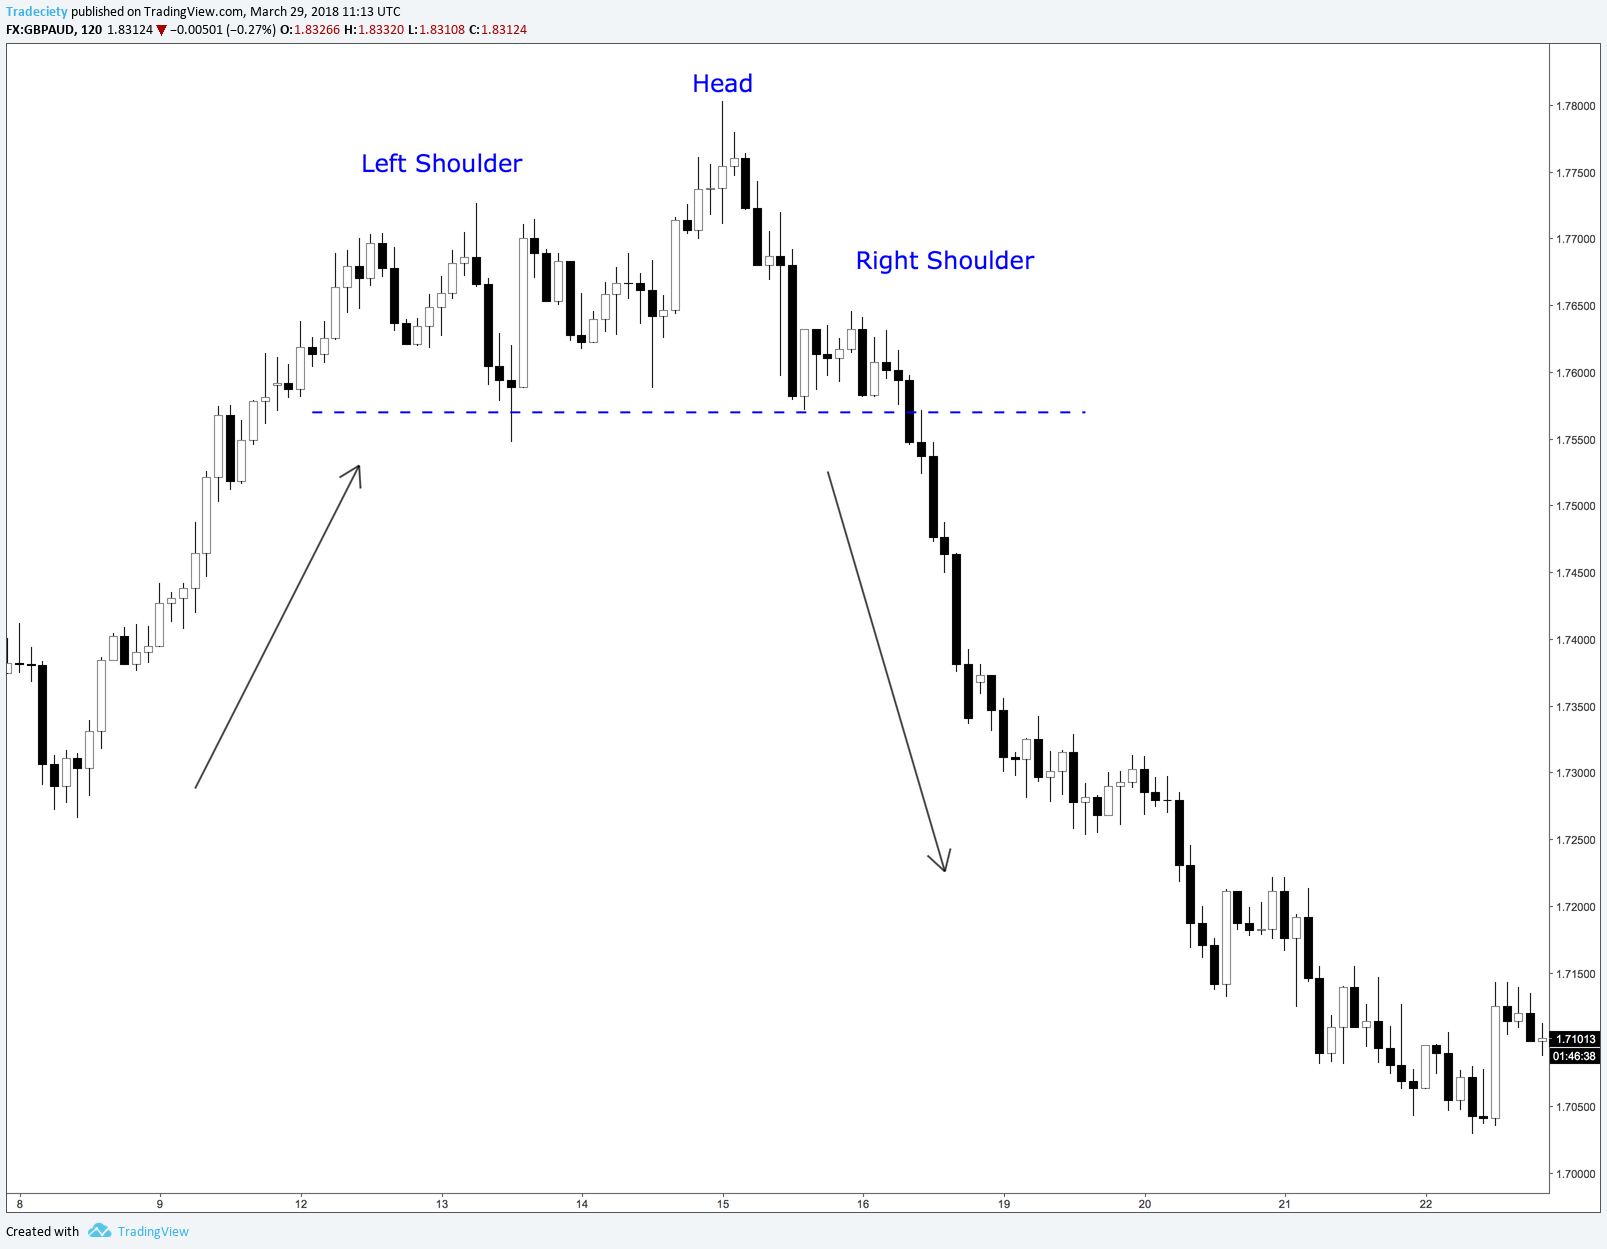
When an uptrend changes into a downtrend, a chart pattern is usually the connection between the trends. In such a case, traders talk about reversal chart patterns. The chart below shows such an example. We will get to know several reversal patterns and continuation patterns in this article.
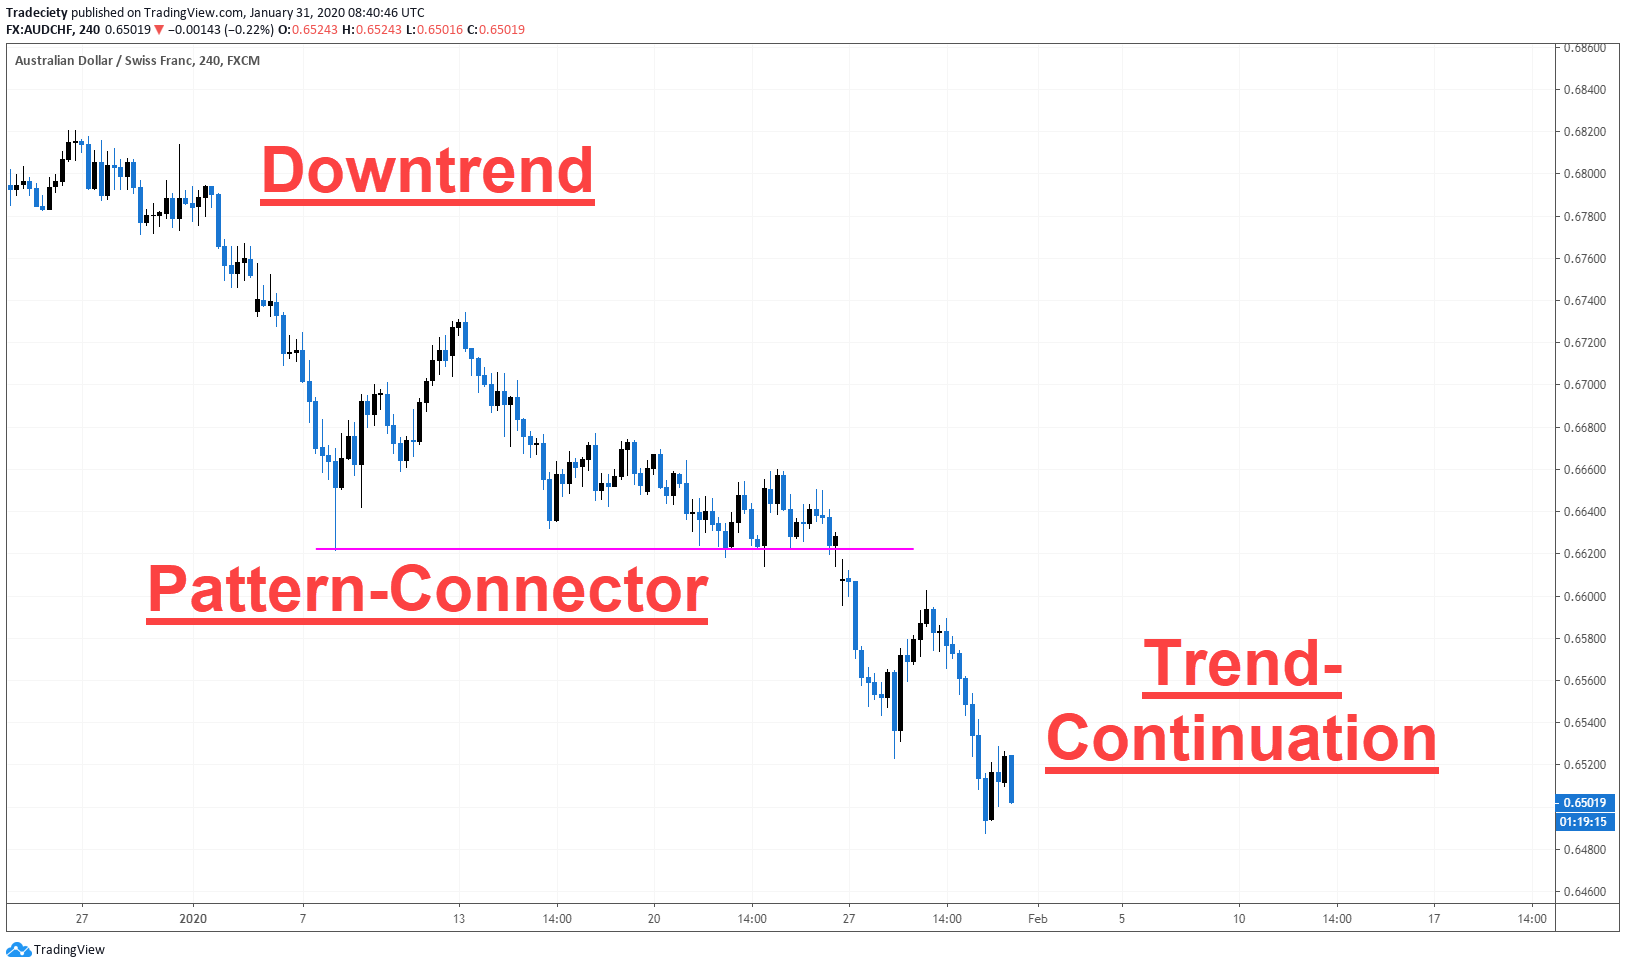
When a trend temporarily pauses and then resumes its original path, a chart pattern usually describes the pause (consolidation). In such a scenario, traders talk about continuation patterns. The screenshot below shows a primary downtrend and a chart pattern connects the two downtrend phases.
In the next part of this article, we are going to take a look at some of the most commonly known chart patterns but in order to understand them, we need to learn how to break down patterns into their building blocks. This will help us find and trade all sorts of patterns effectively.
To make finding the best patterns easier, we start with the pattern outline. Any pattern can be described by using a horizontal level or a trendline. Focusing only on patterns where you can find such an outline will improve your chart pattern skills significantly. The best chart patterns always show those characteristics.
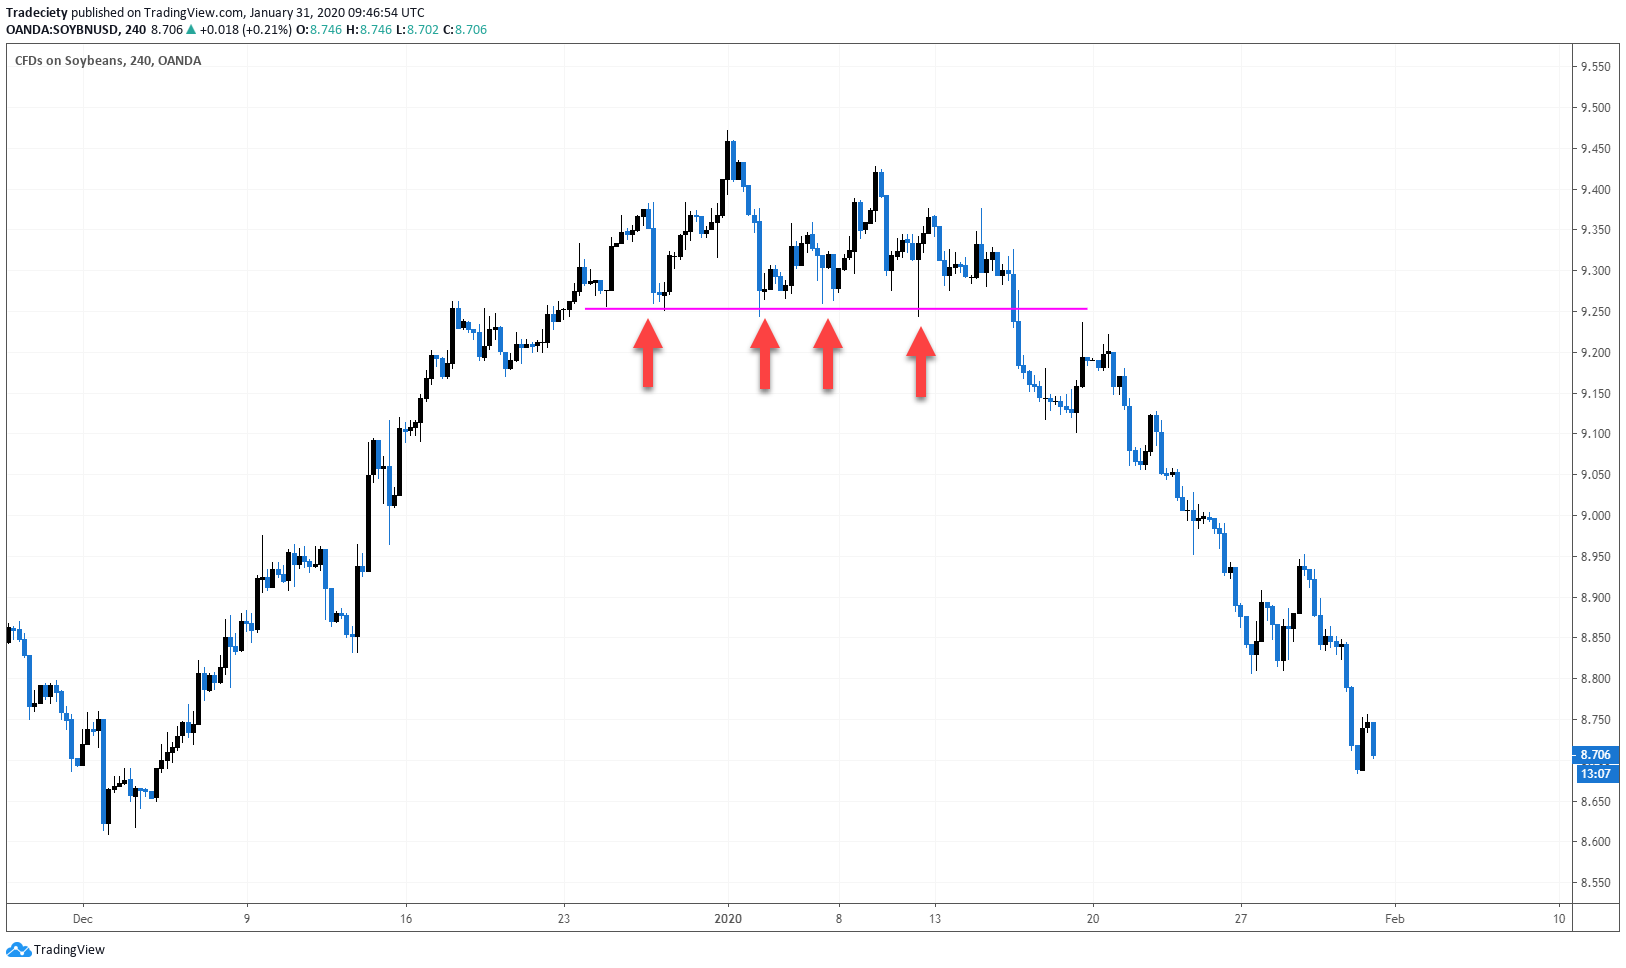
In the screenshot below, we can describe the reversal pattern using a horizontal support level. The level has at least four confirmation points and with each touch, such a level weakens.
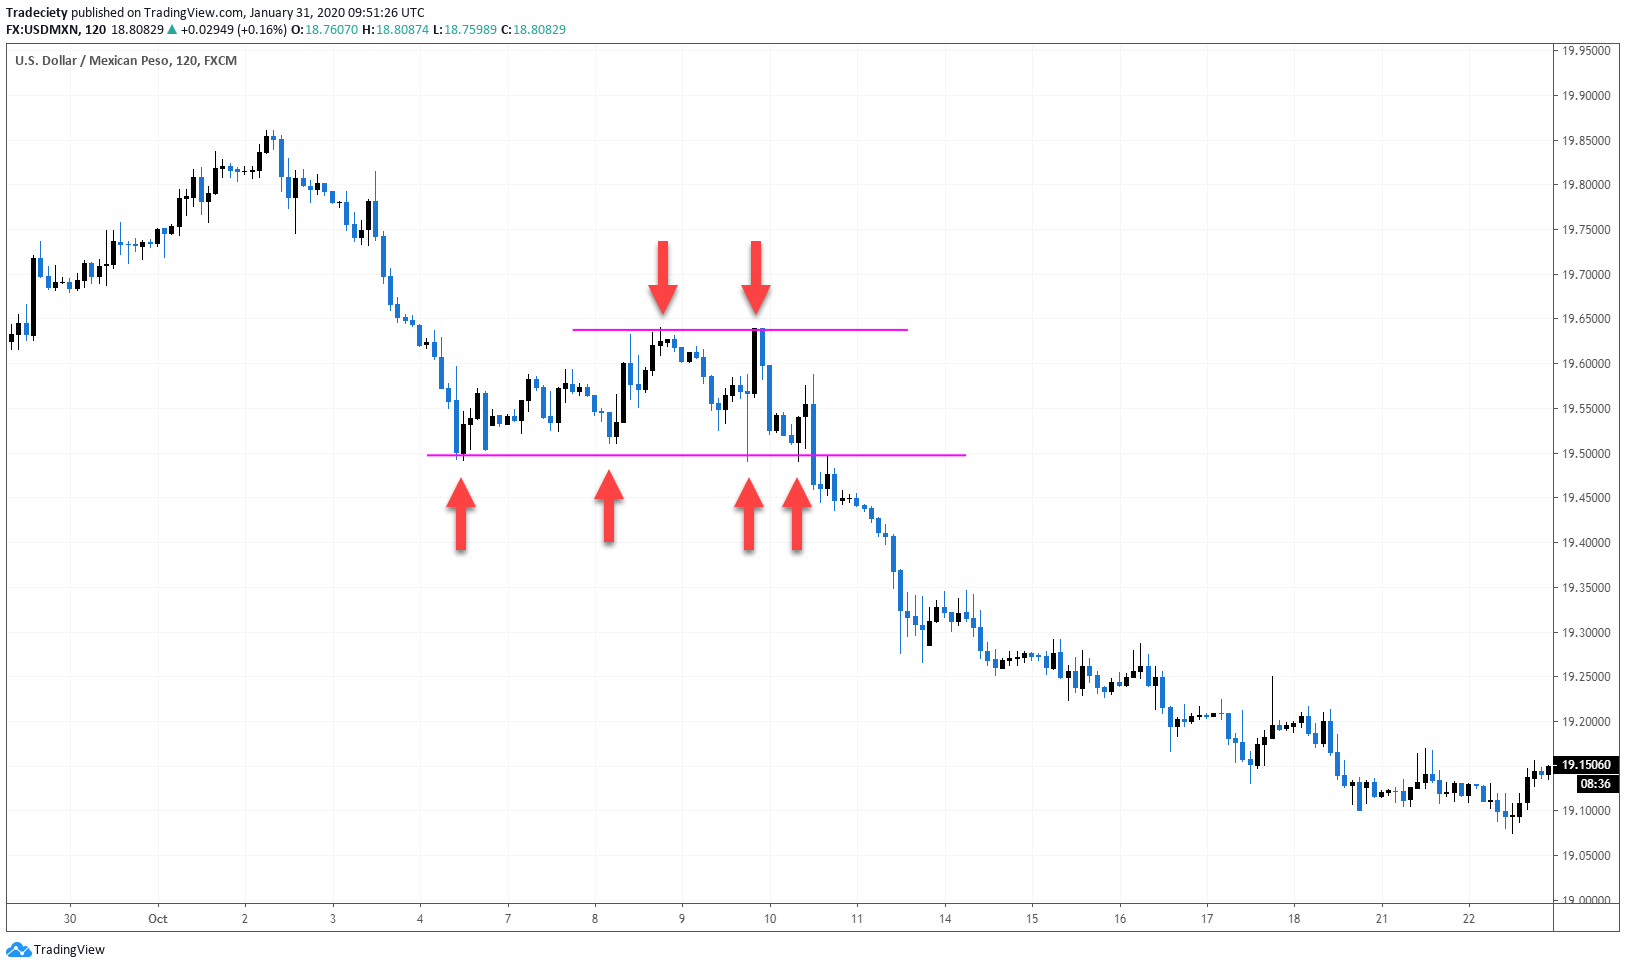
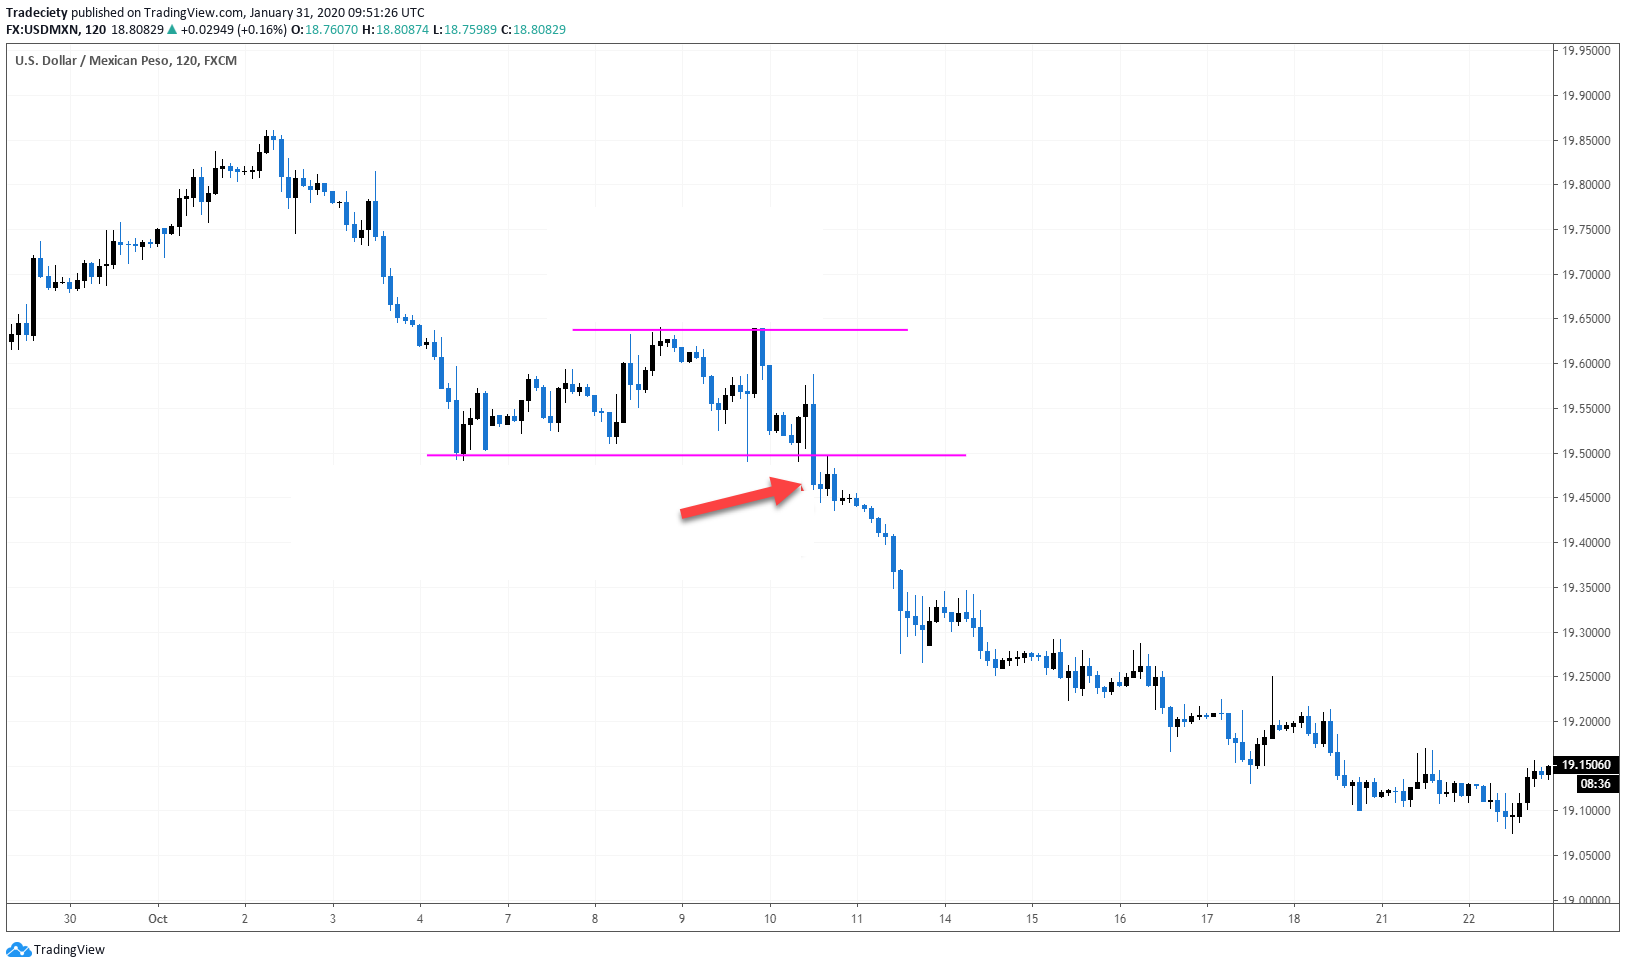
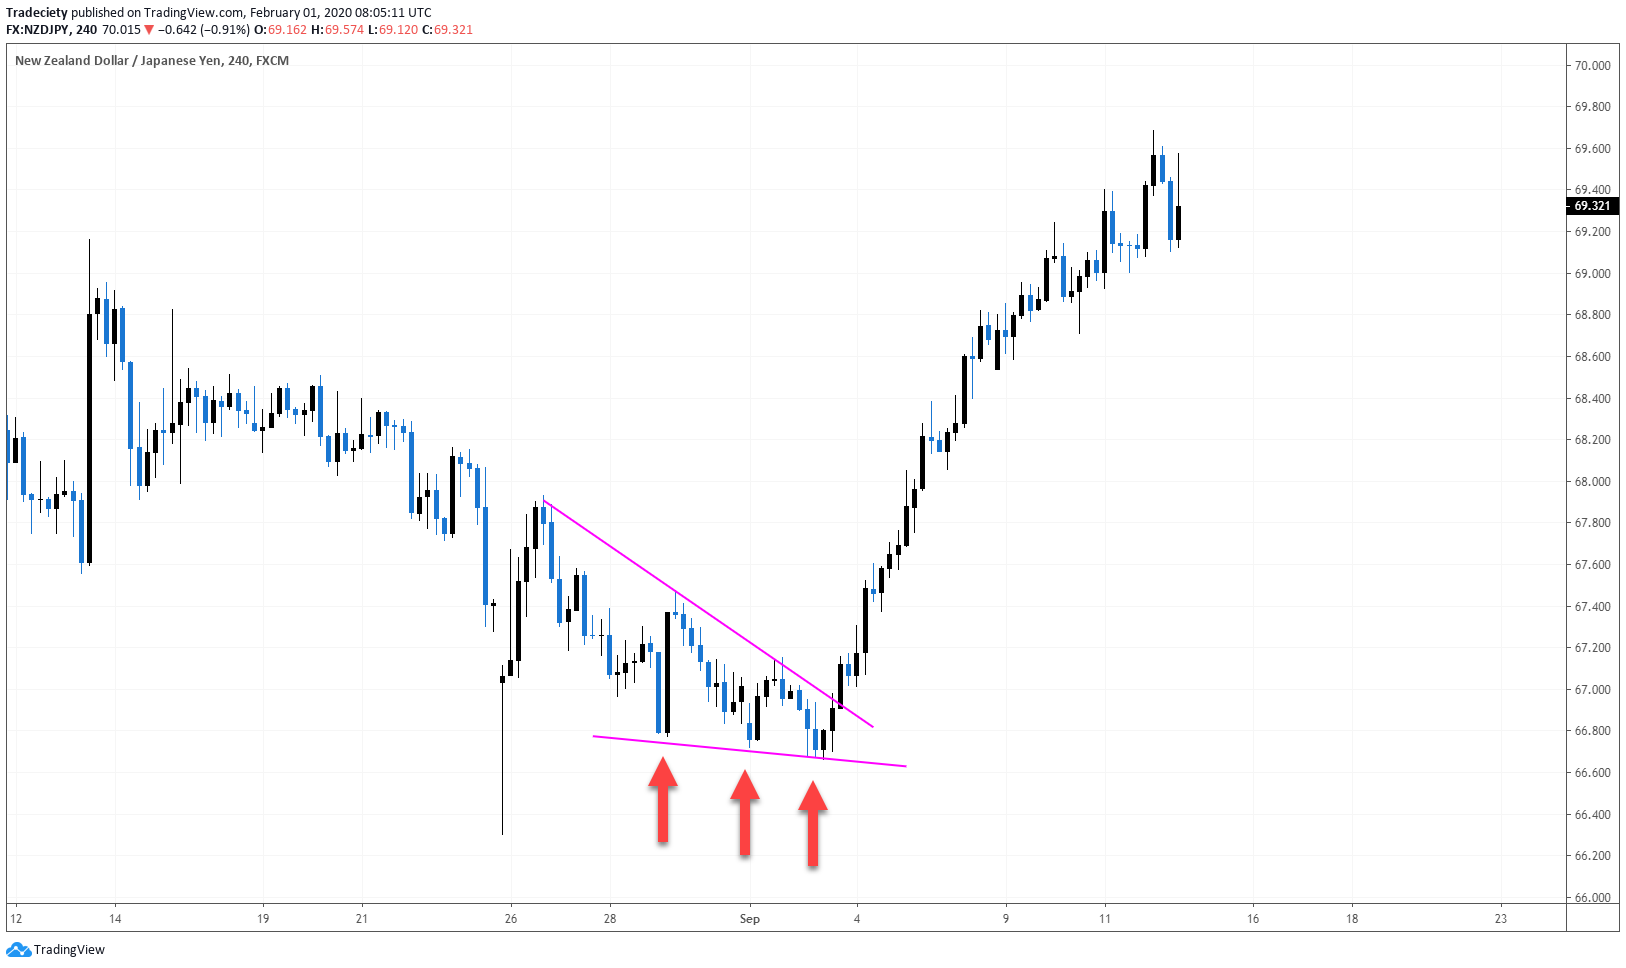
The continuation pattern below connects the two downtrend phases and the chart pattern outline consists of two horizontal levels. Trading such a chart pattern is very simple and it will simplify your trading once you limit your trading to such obvious situations.
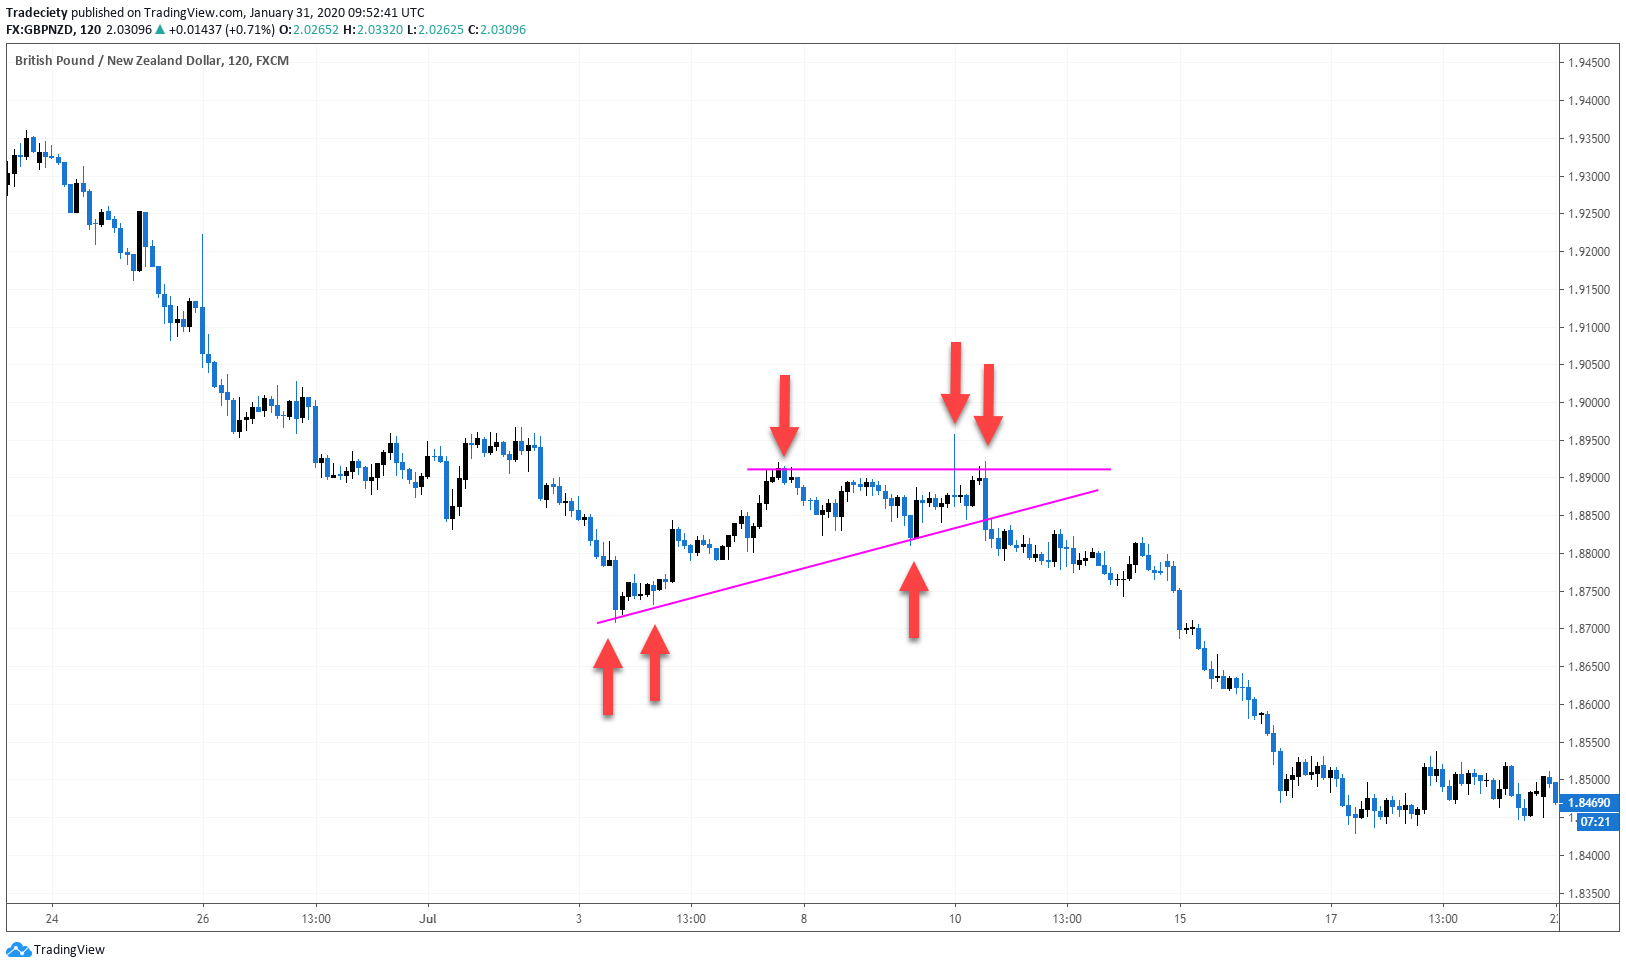
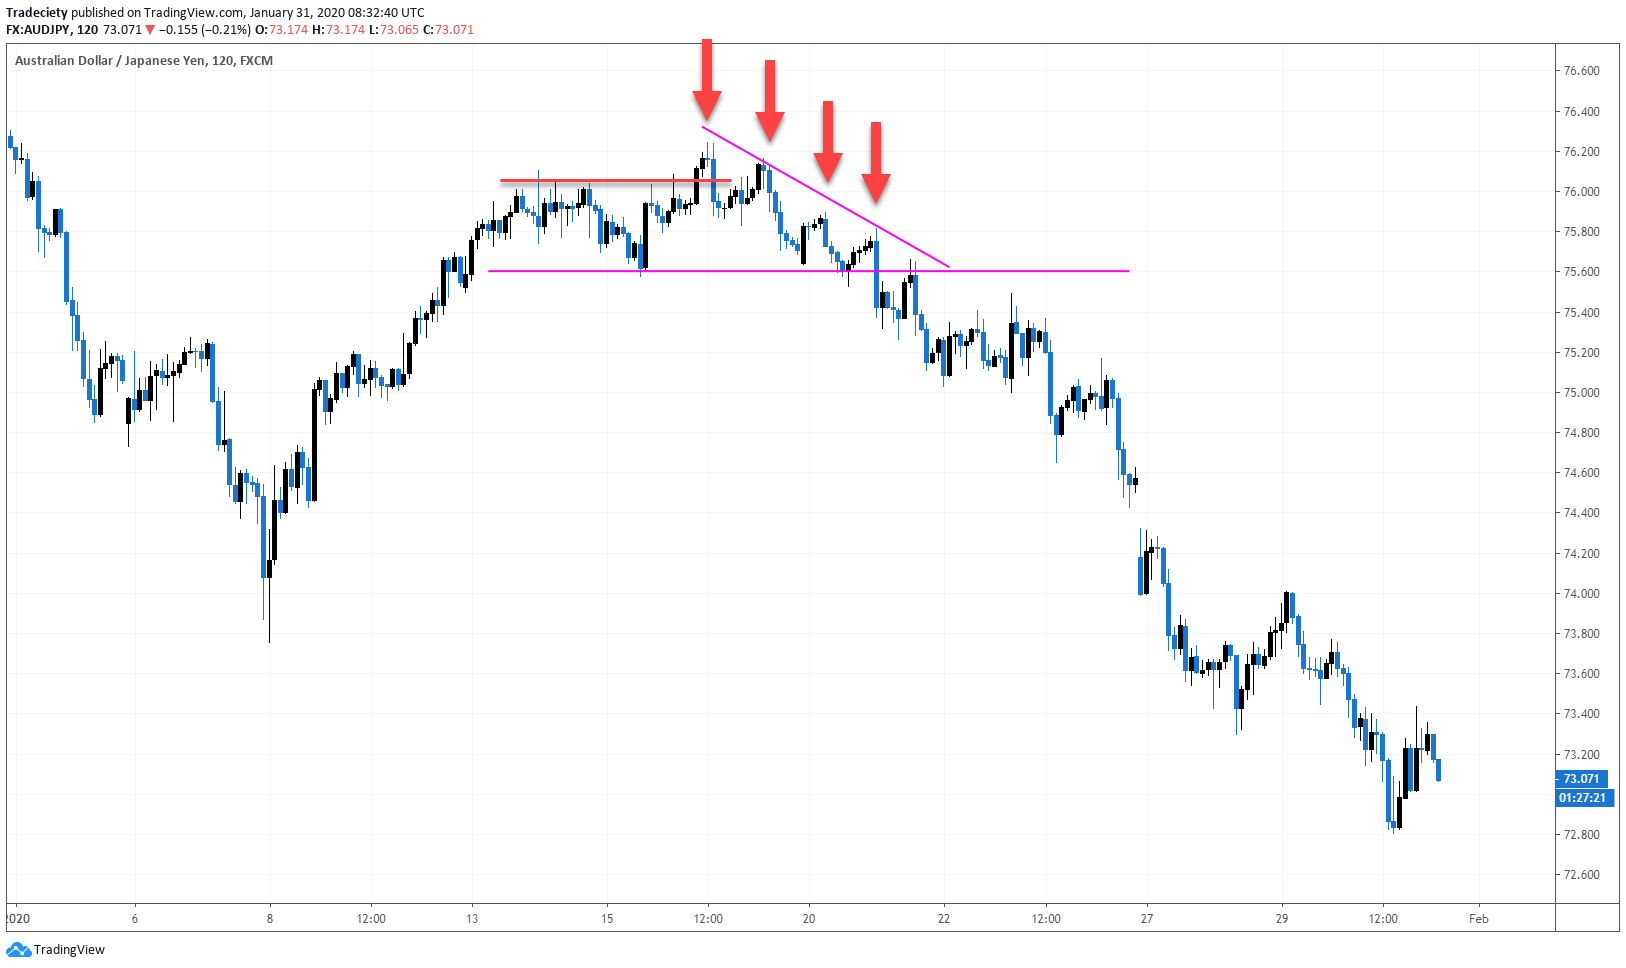
The continuation pattern below comes with a horizontal resistance level at the top and a trendline at the lower end. If the price would have broken above the horizontal level, this could also have turned into a reversal pattern. However, the price broke the trendline which defined the pattern and the downtrend continued.
The trend context is an important selection and filtering criteria. Many traders make the mistake and look for patterns everywhere which often leads to taking trades in a low probability context.
The best trading opportunities exist in trending markets when a market exhibits momentum and tends to move longer distances. You will not get caught in low momentum ranges where the market doesn’t move.
The best reversal chart patterns can be found after extended trending phases. When a chart pattern exists after/during an extended trend, the chances for a strong downtrend into the opposite direction increases. Especially in mean-reverting markets such as Forex. When you look at the previous chart examples in this article you immediately notice that all reversal patterns exist after extended trending phases.
The same holds true for continuation patterns. Look for a strong ongoing trend and once you can identify a pattern, then start paying attention to it.
Avoid ranging and/or high-volatility markets at all costs.
This is one of my favorite concepts when it comes to pattern trading and the way the price trades into a chart pattern level can tell you a lot about what is going on.
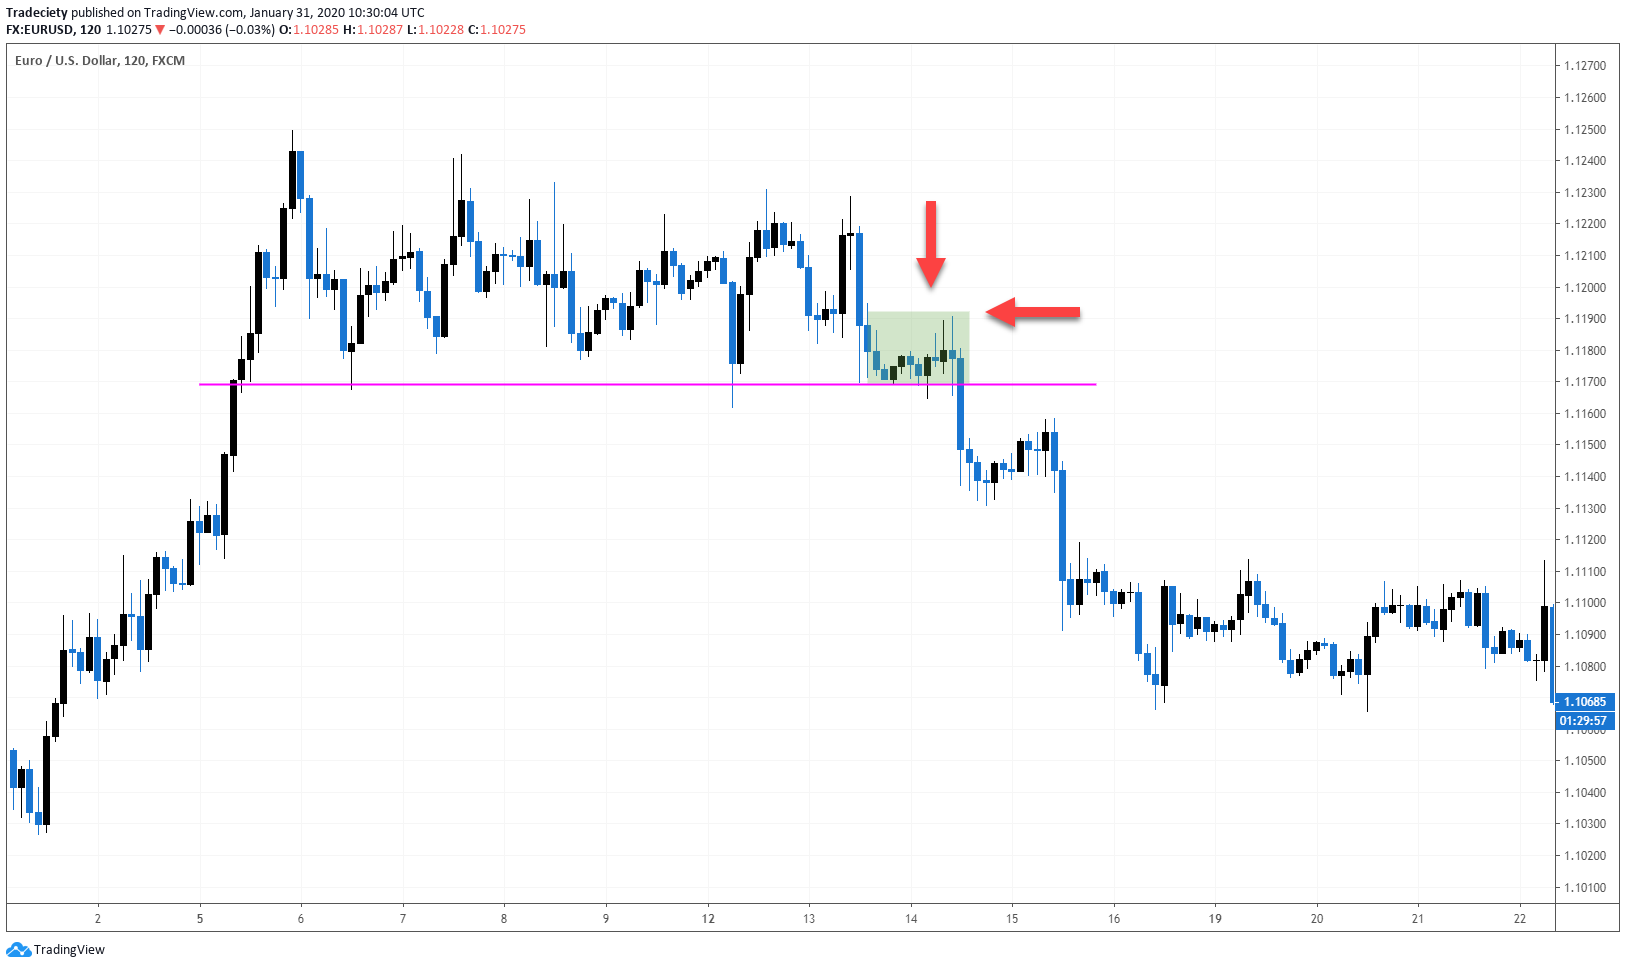
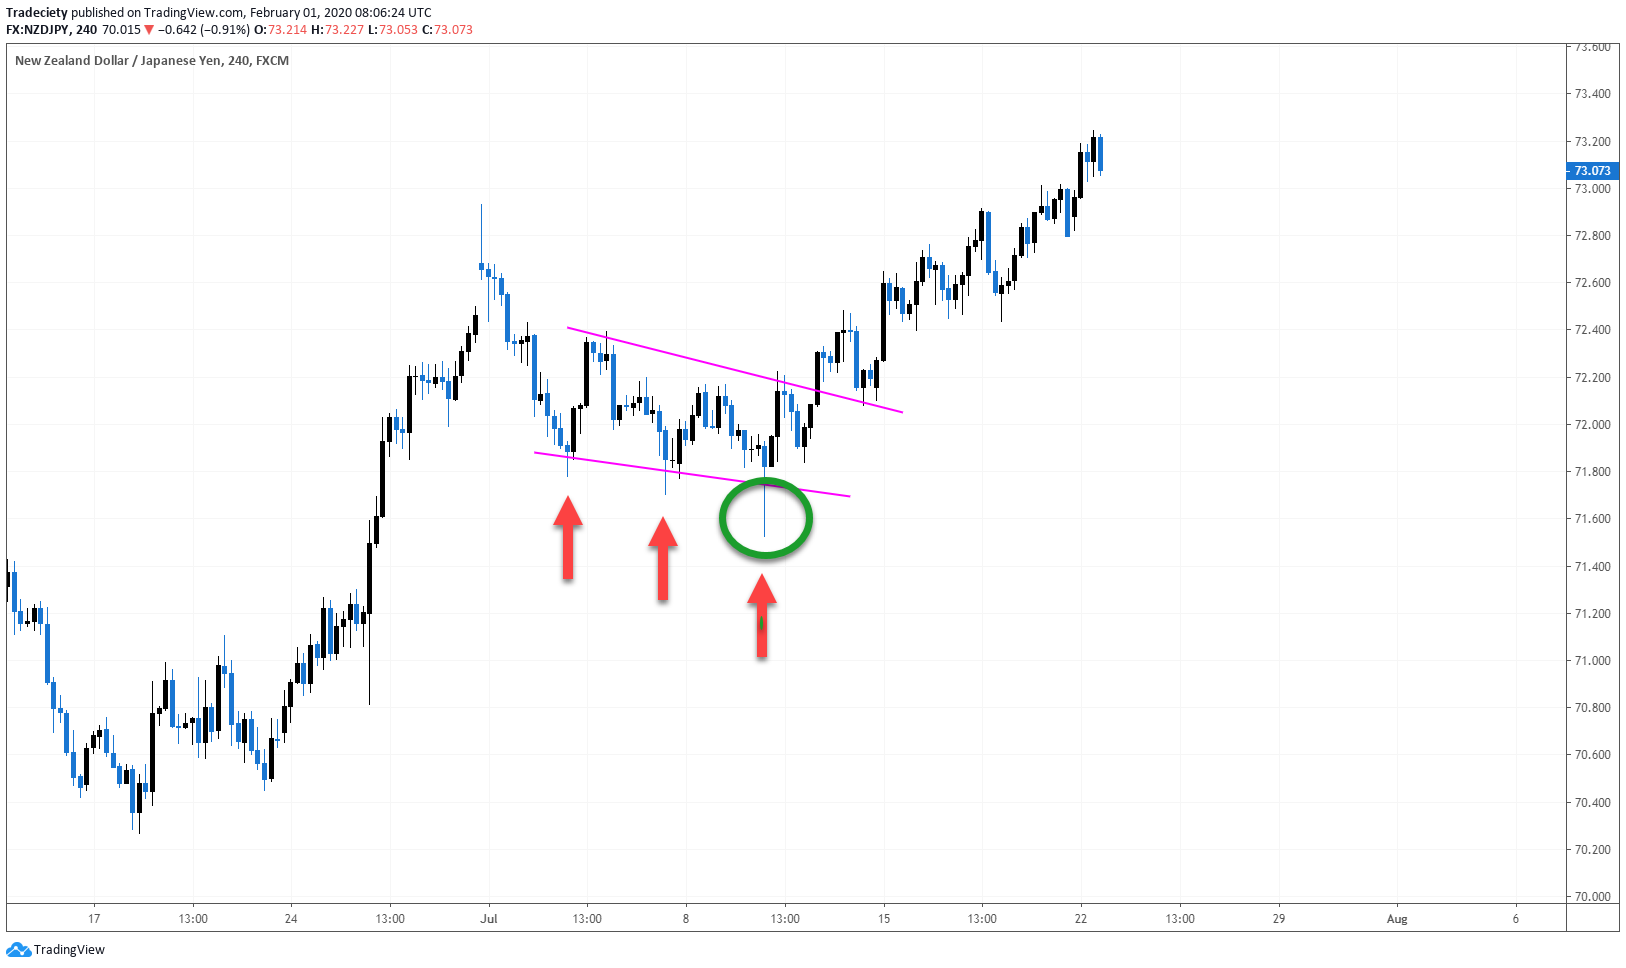
Once you have defined the pattern outline and you can see that the price is “sticking” to the outline level, a high probability breakout is often the result. In the screenshot below, the price was in an uptrend and then entered a sideways consolidation. The consolidation has a well-defined horizontal outline level and before the breakout happened, the price stuck to the level (arrows).
This shows that the buyers have left the market and have no power to push the price higher anymore. Previously, the price bounced higher easily off the outline level but just before the breakout, the bulls lost power.
I wrote a whole article about this lower bounce pattern previously.
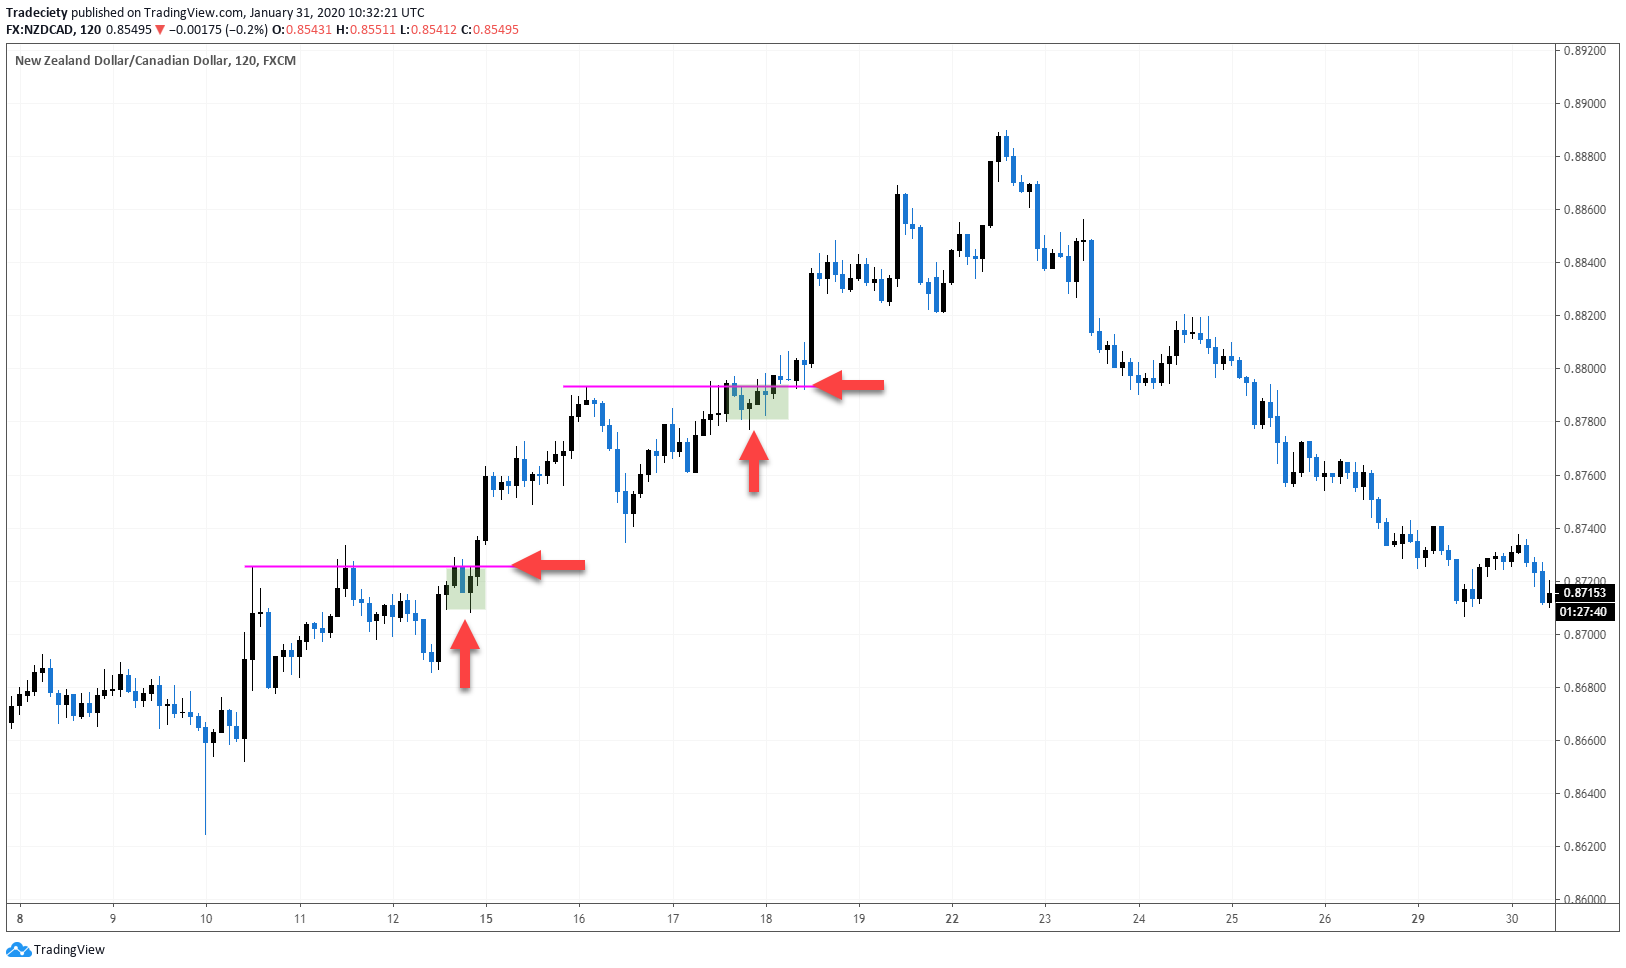
You can also apply this principle to continuation patterns and when you can see this lower bounce pattern during a chart pattern, it often foreshadows a high probability breakout scenario. The idea behind it is that the opposition of market participants has withdrawn and the price is not able to pull away from the pattern outline level at all.
Price waves are the building block of all price charts and we talked about general wave structure before (click here). Price waves also help us understand the chart patterns on a much deeper level as well.
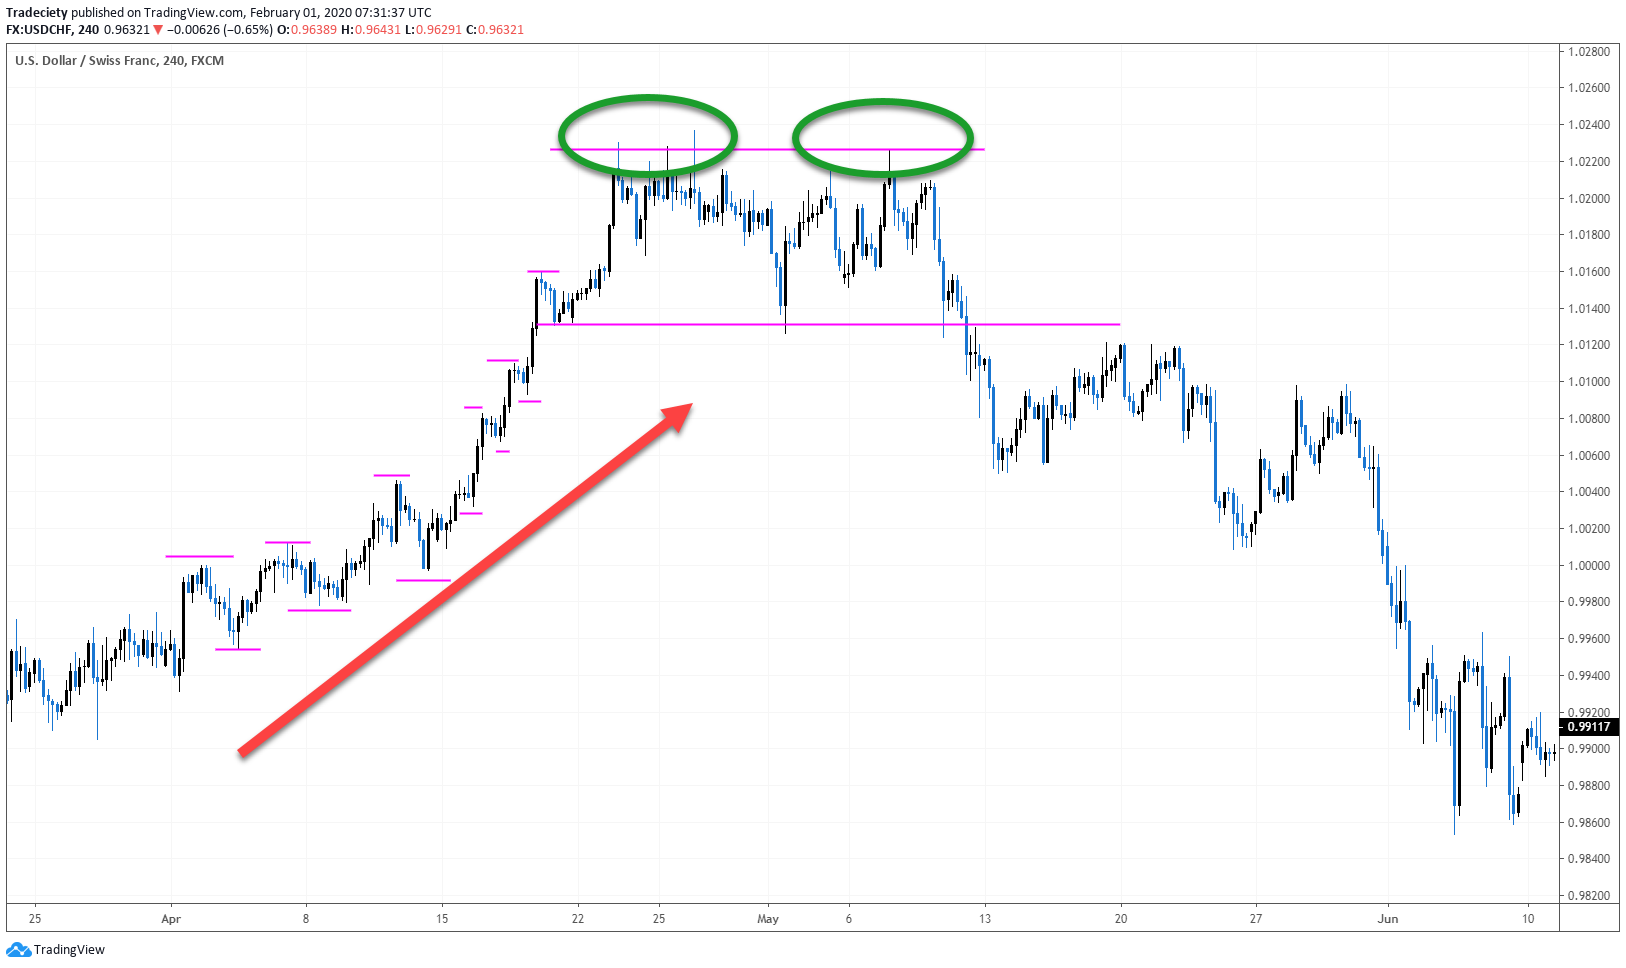
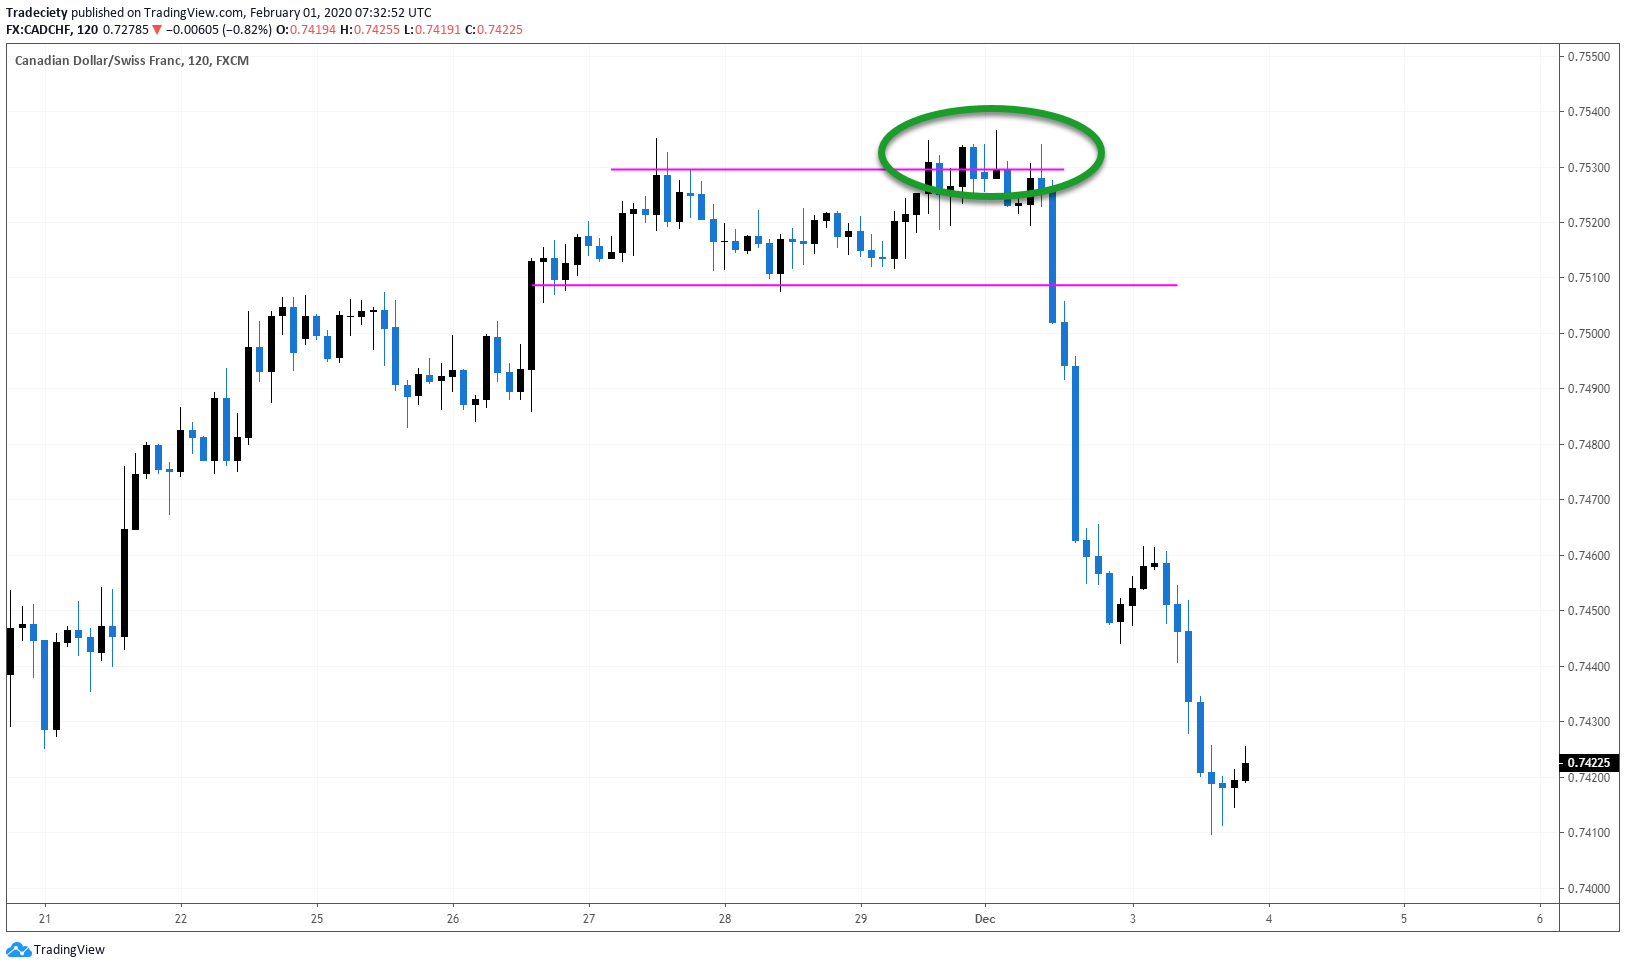
When it comes to reversal chart patterns, we look for exhaustion and signs that a trend has lost strength. In the screenshot below, the market was in a strong uptrend on the left and the market was effortlessly making higher highs and higher lows. Once the trend kept on going, the price shows signs of exhaustion by failing to break higher. The circled areas show how the market established a triple top and was never again able to make a new higher high. Of course, this is not enough to just go short yet, but it is an important piece to the puzzle. And if you look closely, before the price broke the chart outline support level, there was even a lower bounce, adding more context and help us build confidence in the setup.
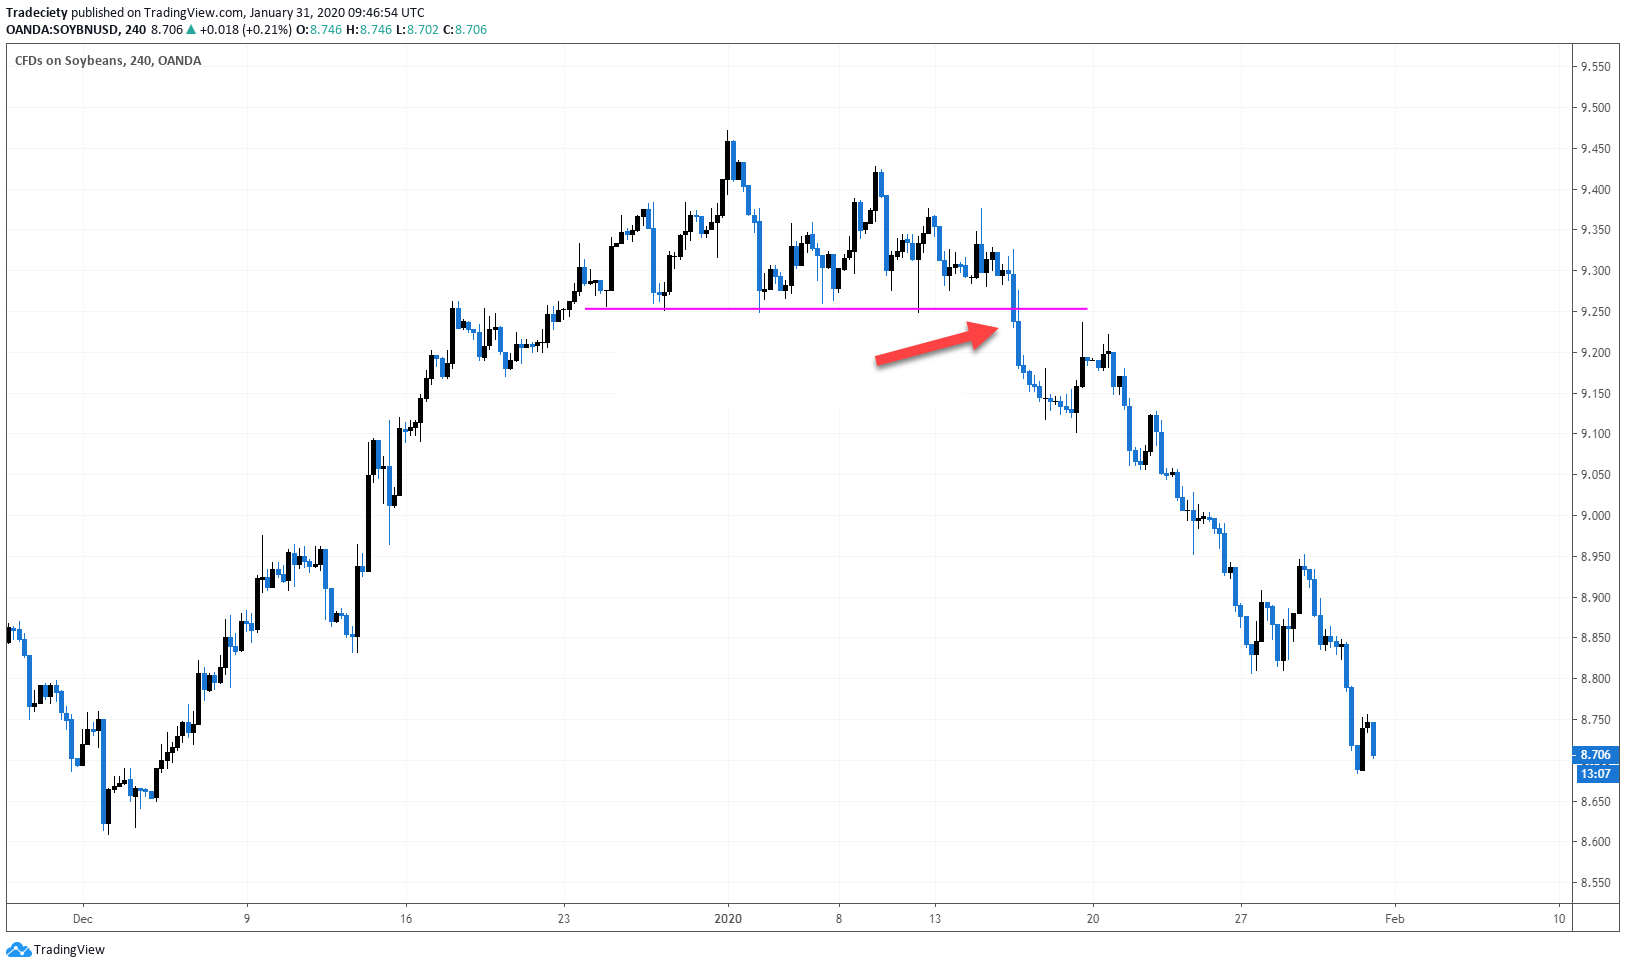
The screenshot below also shows signs of exhaustion at the circled area and although the price tried to break higher, it struggled and just barely made a higher high. If you see that the price fails to make a significantly higher high, we can observe the lack of buying support. Just after the failed trend-continuation attempt to move higher, the price completely collapsed and then started the new downtrend when the price broke the support level of the pattern.
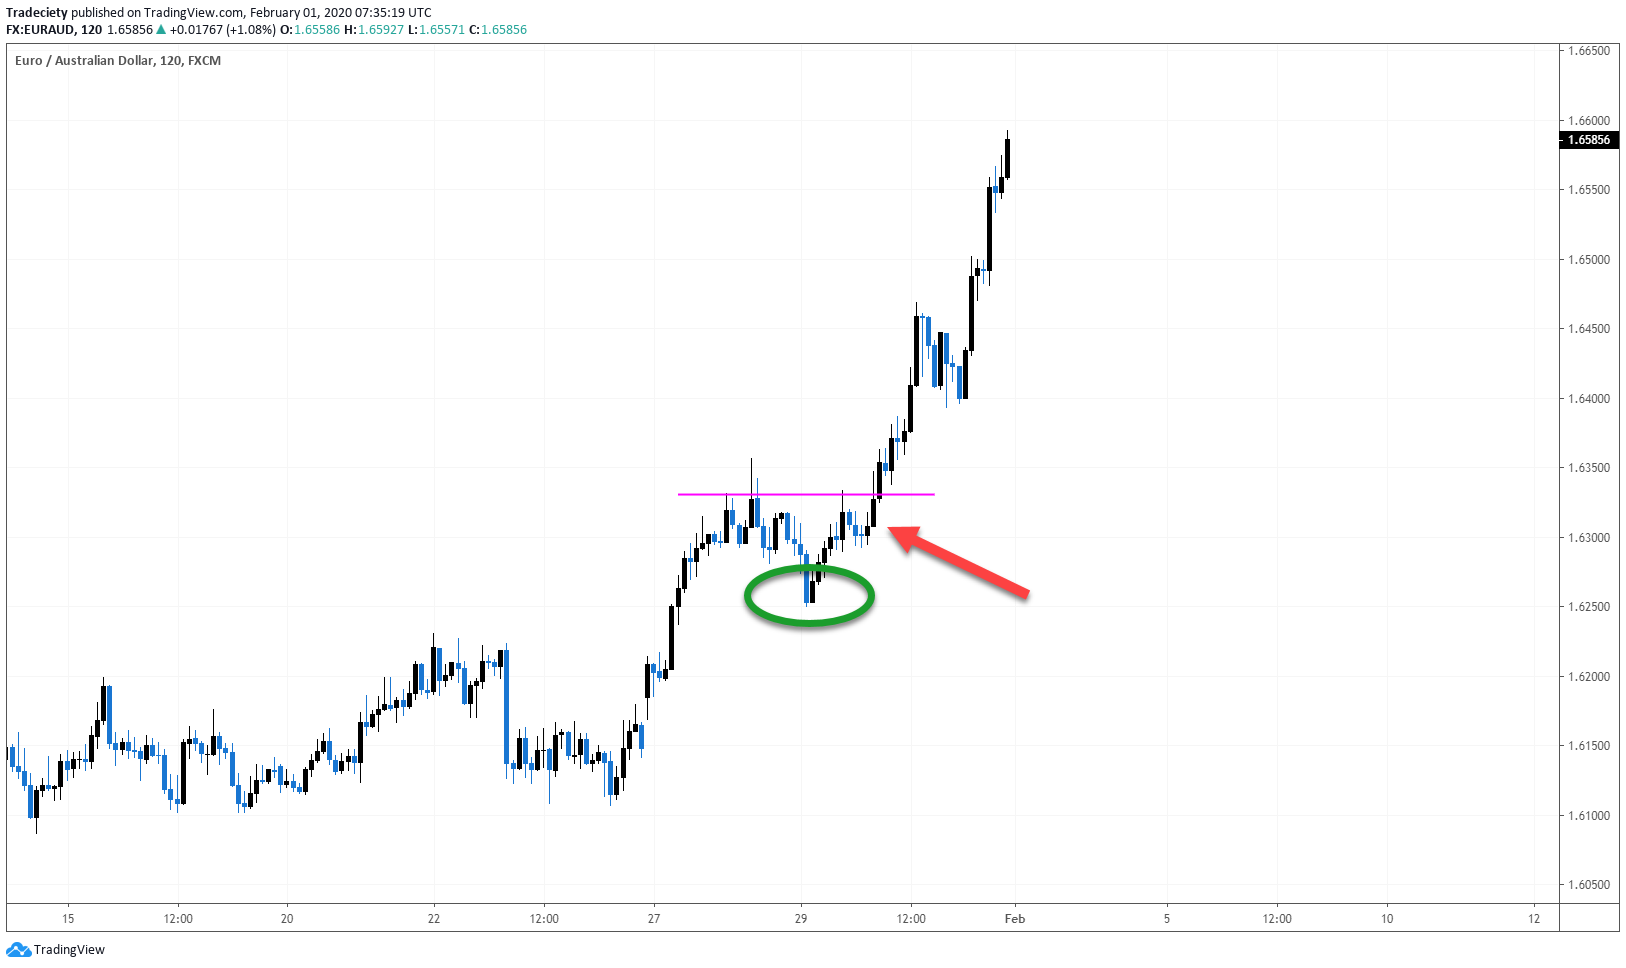
When it comes to continuation patterns, we look for wave structure during the consolidation as well. In the example below, the price actually tried to move lower and I circled the area where the price tried to move lower. But the price was immediately pushed higher back into the pink resistance level. Then, the market made a lower bounce right into the pink resistance level, indicating that the buyers are back and do not allow the price to move lower again. Those are clear signs that the buyers are still in control and the breakout above the pink resistance level confirms the continuation of the uptrend.
It is very tempting to jump into the market early because traders fear that the market will take off without them. Over the long-term, however, waiting for a confirmed breakout increases the chances for success. Of course, sometimes you will miss trades when the breakout happens too fast but you will also avoid many fake/failed breakout attempts.
Rule #1 for chart pattern trading is: only enter when the breakout candle has fully closed outside the pattern. No mid-candle decisions!
In the example below, the chart pattern trigger point is very clear. It is the first candle that fully closes below the outline level. Previously, the price spiked into the level often and many traders will prematurely open trades mid-candle. You must resist the temptation and only make end-of-candle decisions.
The trigger point on the continuation pattern is very obvious and clear as well. The strong momentum candle that closed below the outline level triggered the breakout and the downtrend continued.
Now, let’s apply our knowledge to the classic chart patterns and see how we can now better understand patterns in general.
The Head and Shoulders (HnS) is the perfect example to test our knowledge and we can see all concepts in action:
You can see, we can very nicely apply all previous points to this pattern. This approach will help you read and trade any chart pattern and you are not limited to just the textbook patterns because you can understand all chart situations.
Now let’s examine one triangle pattern and see how we can dissect this scenario:
Flags are powerful continuation patterns and we can see one in action below:
Wedges are reversal chart patterns and the story they tell us are very clear:
If you want to add an indicator to your pattern trading, then there are two categories to choose from which complement chart pattern trading perfectly.
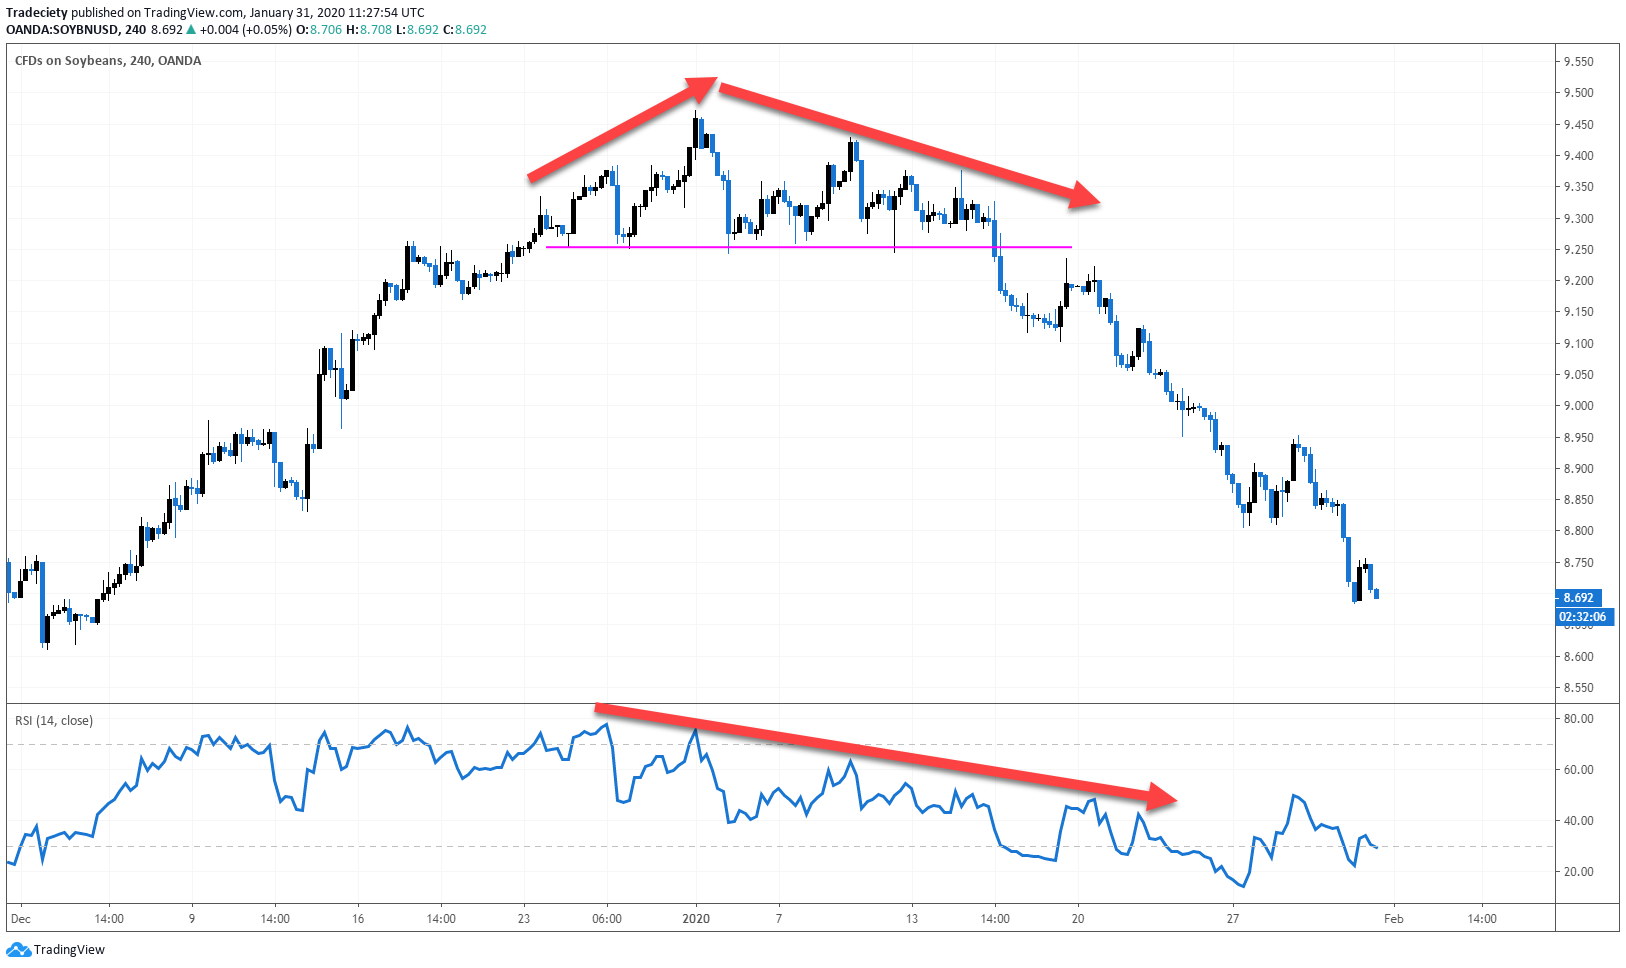
A divergence shows that the trend is slowing down and especially for trend reversal chart patterns, the divergence is the perfect confluence factor.
In the screenshot below, the first arrow on the price action part shows the divergence nicely. The price was making high highs but the indicator already showed that the momentum was slowing down. As the chart pattern progressed, the RSI further confirmed that selling pressure was increasing and the sellers started dominating the market. The RSI gradually fell lower which confirms the bearish pressure.
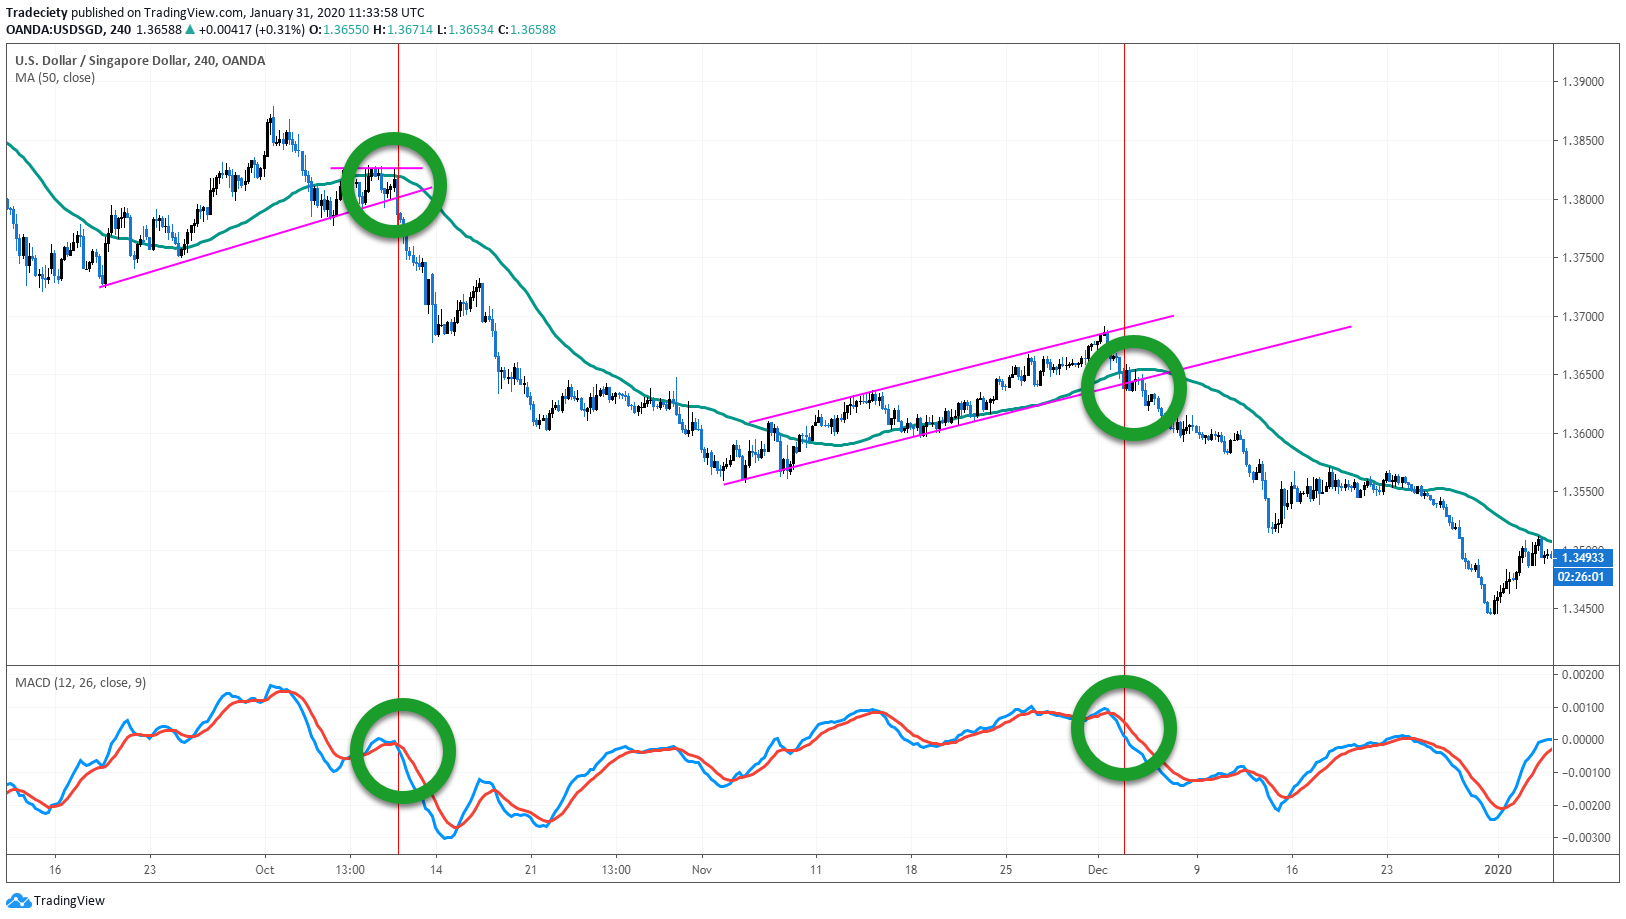
Moving averages and/or the MACD indicator are ideal when it comes to trading trend continuation patterns. Each time the trendline-based chart pattern was triggered, the MACD also crossed bearish. The price was also below the 50 period moving average which confirms the downtrend. Moving averages are great trend indicators and work well for continuation scenarios. Especially long-term moving averages (50 or 100 periods) work well as a trend-direction filter.
Now it is up to you to apply the knowledge to your charts. In the beginning, I’d recommend going through charts, trying to identify chart patterns that match the criteria and all the context that was laid out in this article. It also helps to save screenshots of the scenarios you find and build a library of chart patterns. In the end, technical analysis is pattern recognition and the more you look at patterns, the easier it will be for you to find them.
Then, do your market scan every weekend or every morning (depending on the timeframe you choose) and try to look for current chart patterns. Do not trade them right away, but follow how they play out and try to learn as much as you can about the concepts. After a few weeks, this will become second nature.
external link:


We have been trading supply and demand strategies for over ten years, and they have stood the test of time remarkably well. Supply and demand is...

3 min read
Choosing the right trading journal is essential for traders wanting to analyze performance, refine strategies, and improve consistency. In this...

3 min read
“95% of all traders fail” is the most commonly used trading related statistic around the internet. But no research paper exists that proves this...