
Supply and Demand Trading in 2026
We have been trading supply and demand strategies for over ten years, and they have stood the test of time remarkably well. Supply and demand is...
When it comes to chart pattern trading, the head and shoulders pattern is among the most well-known and widely used patterns, and this is for good reason. The head and shoulders pattern is more than just a formation but it demonstrates the shifting powers in the markets, helping traders anticipate the next trending phase.
Understanding and identifying this pattern enhances a trader’s decision-making, providing a visual signal for predicting market movements. This article explores the head and shoulders pattern, covering identification, psychology, trading strategies, real-life examples, common mistakes, and integration into a trading plan. Mastering this pattern can significantly improve trading outcomes for both novice and experienced traders.
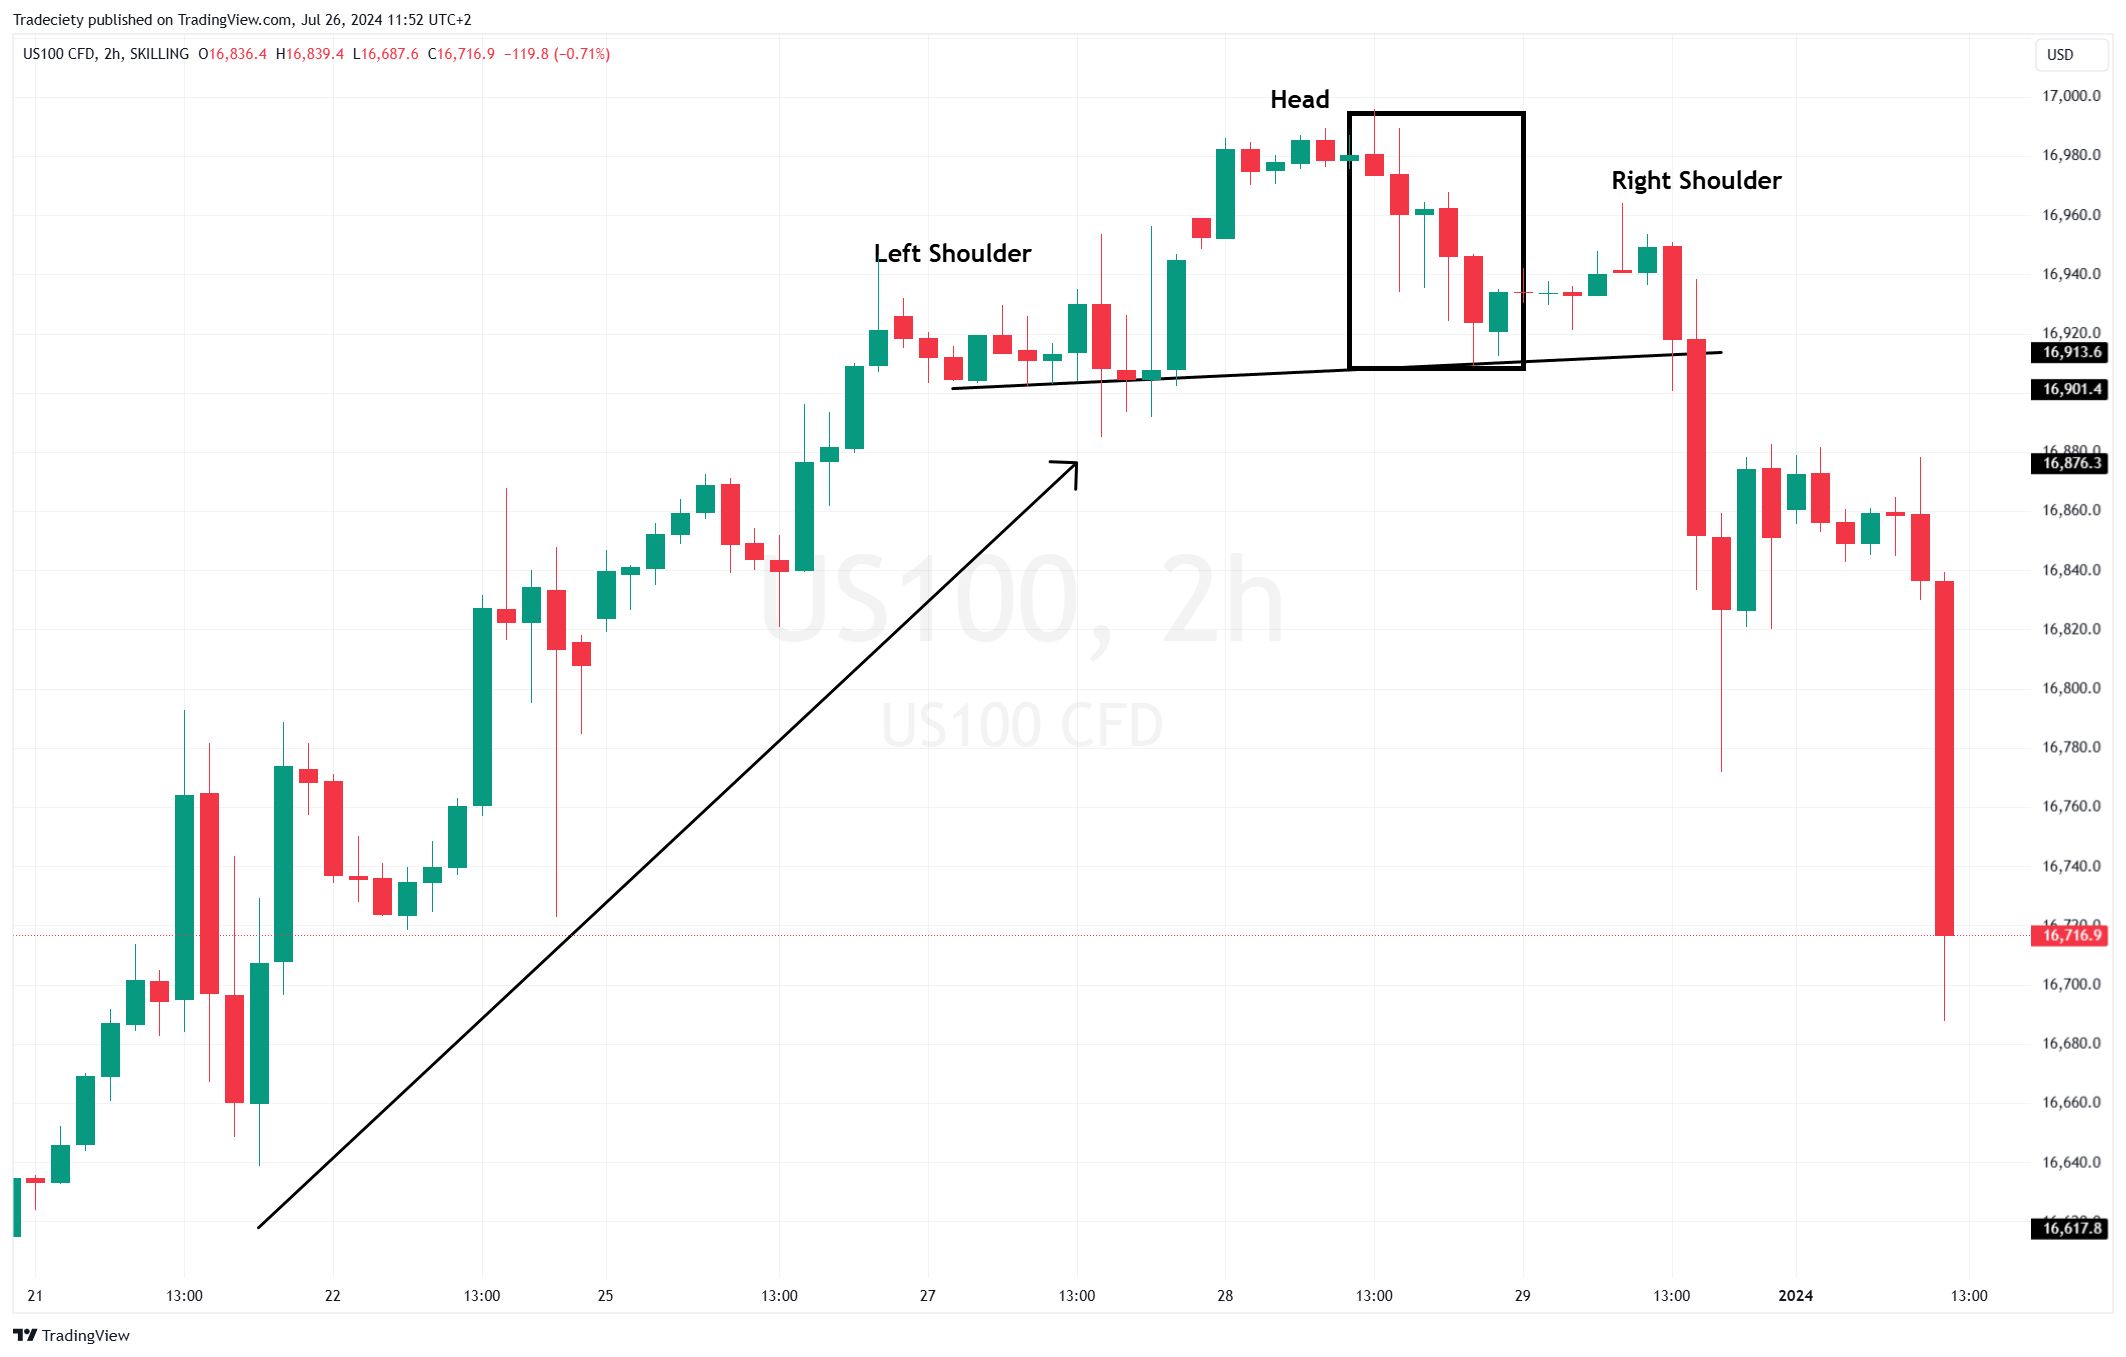
The head and shoulders pattern consists of three peaks: the left shoulder, the head, and the right shoulder. The left shoulder forms after a significant uptrend, followed by a price decline. The head is created when the price rises again to a higher peak, and then drops once more. Finally, the right shoulder forms when the price rises but fails to reach the height of the head, then declines again.
This pattern indicates a potential reversal in the current trend. In a standard head and shoulders pattern, it signals a transition from an uptrend to a downtrend.

Key to trading this pattern is the neckline, which connects the low points of the left shoulder, head, and right shoulder. The neckline's slope can be either upward, downward, or horizontal. Traders look for the price to break below the neckline which then signals the start of a new downtrend.

The head and shoulders pattern is more than just a visual chart formation; it reflects underlying market psychology and investor behavior.
The formation of the left shoulder occurs when a strong uptrend shows signs of weakening. Whereas the trend still looks healthy from the left shoulder to the head, the trend-continuation from the left shoulder to the head is often weaker and the price doesn't advance as much as it did in the early trend.

However, the first true signs of trend weakening occur when the right shoulder forms below the head. The lower high is an important warning sign to all bullish market participants.
Furthermore, the drop from the head to the neckline also requires careful analysis. The drop from the head to the neckline is often a strong bearish price reaction, typically much stronger than past bearish correction moves during the uptrend. In the example below, the strong bearish market phase after the head is highlighted in the black box.

The neckline represents a psychological support level. When the price breaks below this line, it confirms the shift in market sentiment. Traders interpret this break as a signal that the prevailing trend has reversed, prompting them to adjust their positions accordingly.
Most head and shoulders-based trading strategies suggest looking for trading opportunities around the neckline. We will explore some variations shortly.

The inverse head and shoulders pattern is a bullish reversal pattern that signals a potential change from a downtrend to an uptrend. It follows the same principles as the standard pattern but is flipped on its head.
You find inverse head and shoulders patterns at the end of a downtrend, where it shows the shifting powers from a bearish to a bullish market phase. The right should is hereby the first higher low and with the break of the neckline, the price is initiating the start of the bullish trend.

The key to trading the head and shoulders pattern lies in identifying the right entry points, setting appropriate stop-loss levels, and determining profit targets.
Entry Points: The common entry approach is to time a trade when the price breaks through the neckline. In a standard head and shoulders pattern, this means entering a short position when the price drops below the neckline.
Alternatively, many traders wait for a retest of the neckline from underneath before entering short. Often, the price action after the neckline break is volatile and unpredictable when the market shifts from one trending phase into the next. Thus, waiting for a retest is another common trading approach.
Stop Loss: Setting a stop-loss order is crucial for managing risk. Typically, the stop-loss is placed above the right shoulder in a standard pattern or below the right shoulder in an inverse pattern.
Alternatively, more aggressive traders choose to place their stop loss just above the neckline. However, such an approach is more vulnerable to stop runs and volatility spikes.

While the head and shoulders pattern is typically known for signaling trend reversals, it can also be used as a trend continuation pattern under certain conditions.
In this context, the pattern forms within a larger, prevailing bullish trend as a temporary consolidation. The price move from the left shoulder to the head can look like a reversal attempt into the bearish side. However, when the price makes a higher low from the head to the right shoulder, the bullish uptrend structure is present once again.

The break above the neckline signals the bullish trend continuation.
This approach allows traders to capitalize on temporary pauses in the trend, leveraging the pattern for trend-following entries.

Trading the head and shoulders pattern can be highly effective, but it’s not without its challenges. Many traders fall into common traps that can lead to losses. Here’s how to avoid these pitfalls.
1. False Signals: One of the most frequent mistakes is acting on false signals. Not every head and shoulders pattern leads to a reversal. To mitigate this risk, traders should wait for a clear break of the neckline with significant volume before making a move.
Confirming the pattern with other technical indicators can also help reduce false signals.
Furthermore, if you experience a lot of stop runs after trading the neckline breakout, consider testing the previously explained retest strategy.
2. Over-reliance on the Pattern: While the head and shoulders pattern is powerful, relying solely on it can be risky. Traders should use it in conjunction with other analysis methods, such as trend lines, moving averages, and momentum indicators. This comprehensive approach provides a fuller picture of market conditions.
3. Ignoring Market Context: The broader market context is crucial. A head and shoulders pattern within a strong, long-term trend might not perform as expected. Traders should consider overall market sentiment, news events, and economic indicators to validate their pattern analysis.
Always check your higher timeframe to make sure that the head and shoulders pattern occurs in the correct context.
4. Poor Risk Management: Failing to set appropriate stop-loss orders can lead to significant losses. Traders should always place stop-loss orders above the right shoulder in a standard pattern or below it in an inverse pattern. This ensures that losses are minimized if the trade goes against the expected direction.
5. Misinterpreting Volume: Volume plays a key role in confirming the head and shoulders pattern. A neckline break without increased volume might not sustain the trend reversal. Traders should look for a significant increase in volume during the breakout for confirmation.
6. Premature Entry: Entering a trade before the pattern is fully formed can be costly. Patience is vital. Waiting for the complete formation and a clear neckline break helps ensure that the pattern is valid and the reversal is likely.
By being aware of these common mistakes and taking steps to avoid them, traders can more effectively utilize the head and shoulders pattern in their trading strategy, leading to better outcomes and reduced risk.
By understanding its formation, psychology, and effective trading strategies, traders can leverage the head and shoulders pattern to enhance their decision-making and improve their trading outcomes.
Key points to remember include accurately identifying the pattern, waiting for confirmation with a neckline break, and implementing proper risk management techniques like setting appropriate stop-loss orders. Additionally, integrating the head and shoulders pattern with other technical analysis tools and considering the broader market context can lead to more informed and successful trades.
Avoiding common mistakes, such as acting on false signals or over-relying on the pattern, is crucial for minimizing risks. Patience and thorough analysis are essential to maximize the benefits of using this pattern.
external link:


We have been trading supply and demand strategies for over ten years, and they have stood the test of time remarkably well. Supply and demand is...

3 min read
Choosing the right trading journal is essential for traders wanting to analyze performance, refine strategies, and improve consistency. In this...

3 min read
“95% of all traders fail” is the most commonly used trading related statistic around the internet. But no research paper exists that proves this...