
Supply and Demand Trading in 2026
We have been trading supply and demand strategies for over ten years, and they have stood the test of time remarkably well. Supply and demand is...
(00:34):

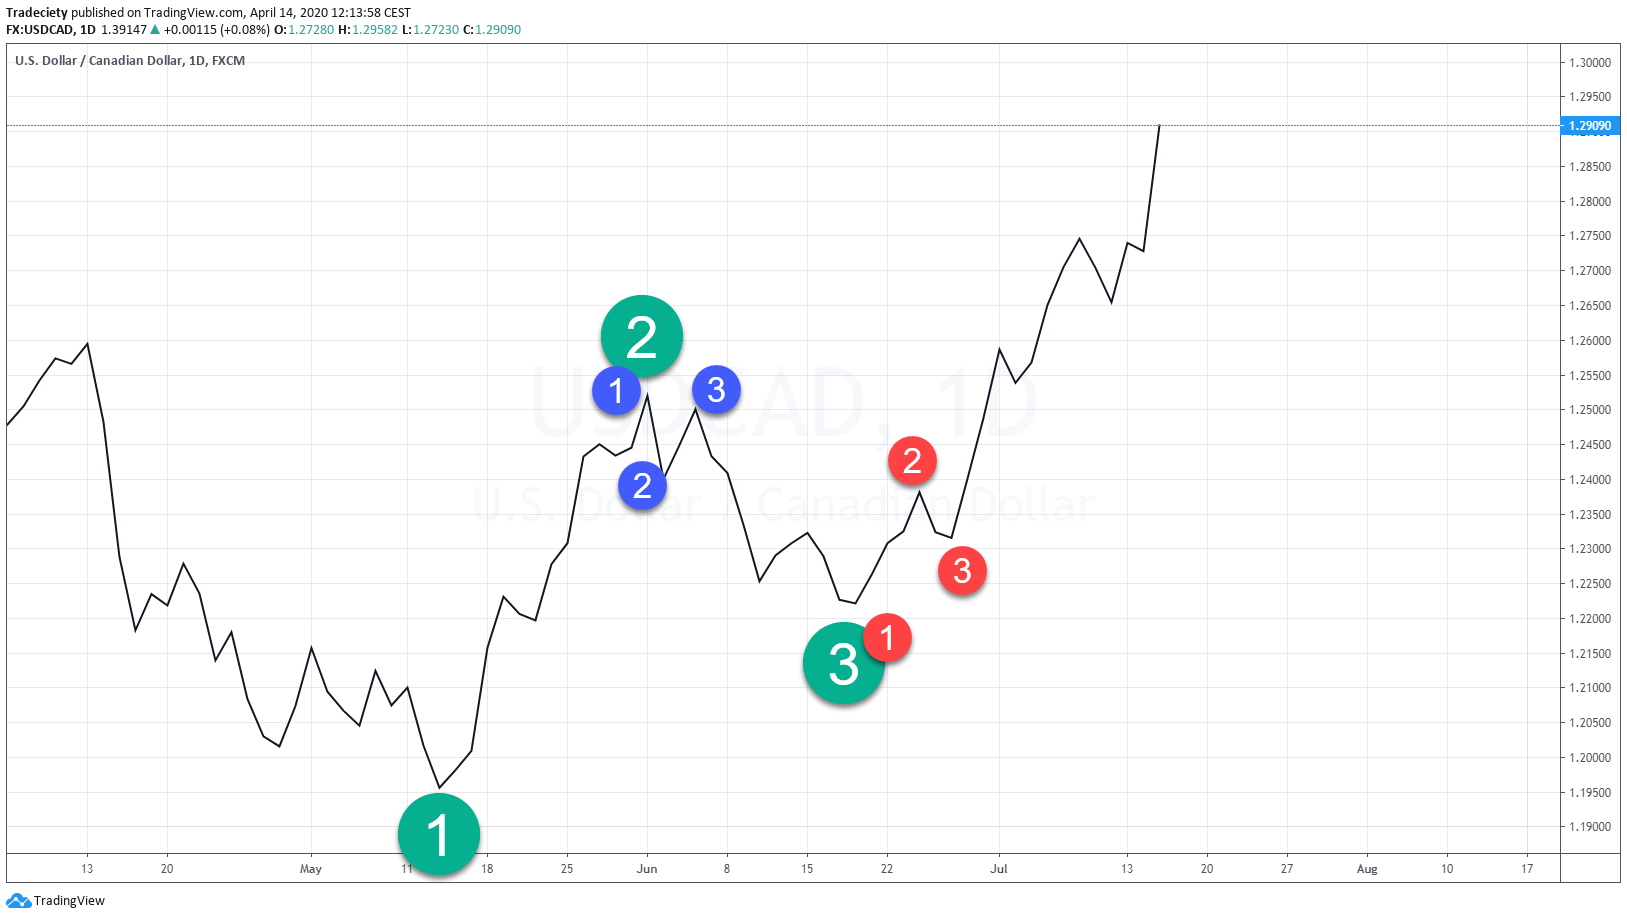
Let’s get into the eight price action strategies that I picked for this video. And we are starting with a one, two or three pattern, which is very famous, very popular, and it can build a robust foundation for further price analysis. So when we look at any price chart, we usually look at trending markets and we try to understand trending markets and we can understand the one, two or three pattern, or we can understand price action in the context of the one, two, three pattern very, very effectively. So in this one I marked several one, two or three price movements. And we have talked about those when we, when we look into Fibonacci’s and Fibonacci’s retracements and every star, every trend can usually be described in its initial wave or in its initial form with a one, two, three starting points.

(01:20):
So at a new uptrend starts at the bottom, then it has its first up trending leg comes to the end at point 2 and then the first retracement stops at point 3 and this is often where traders look for pull back opportunities because now it is obvious that the market has made a higher low and that the trend is really rolling over to a new uptrend. And then a trader look for pullback entries around a point 3 and when we break down waves and when we break down price to an even smaller level, we will be able to find one two three patterns across the board. So within this one to two move, we can look at the smaller price action here and you can also see a one, two and three moves. So the trader looking at granular price movements may be able to trade a disk downward leg to point 2 to three.
(02:12):
In the bigger picture with this help of the little one, two or three pattern. So looking for a retracement here at a points three level maybe a breakout below point 2which is very, very common as well. And even here on, on the right hand side, so let’s assume we have a bullish and we have a trend following trader who is looking to trade to the longer term uptrend. Once you’ll have the one to two pattern, you wait for the three to form. And when is the three points confirmed, when the price starts moving away. And you could either wait for the price to break above the recent to the major point 2 or you can look for a smaller one two three pattern around a point three in a bigger context. So here you can see you have the one, two and three and then you can see it as this where uptrend started.
(02:58):
So even within the bigger picture you will often be able to find the one two three pattern. And you could either wait for the point 3 to form, you could wait for the point 2 to break into new high. That is then up to the trader how he likes to structure those traits and when we look at the other seven trading strategies, you will be able to combine those as well. So maybe you use the one two, three as your core foundation and then you, you lay over the trend line break or the deceleration and acceleration, maybe a spring formation. All of those will be discussed in a bit. So here you can see we have a downtrend and at the origin of the downtrend we have one, two and three but obviously we need to wait for the three to form. And if you don’t want to get in too late, and by late means that usually people wait for point 2 to break,
(03:47):
you’re going to look for granular price actions. So around point 3 you see that here is to up the highest point. Then you have a small point 2 and point 3 again to point 3 in a downtrend must be lower than the point 1 which is very, very important. So in this example, the trader might be looking for a potential sell trait and then he is looking after point 3 on the bigger picture has formed. He’s waiting for the point three on a lower petal to form as well. And then you can see instead of waiting here for the point 2 to break in the bigger picture, he could wait for a point two to break on to smaller one, two, three pattern, which will help him to pinpoint entries a little bit more effectively. The next one is the breakout buildup. What is one of my most favorite patterns and breakout buildup.
(04:35):
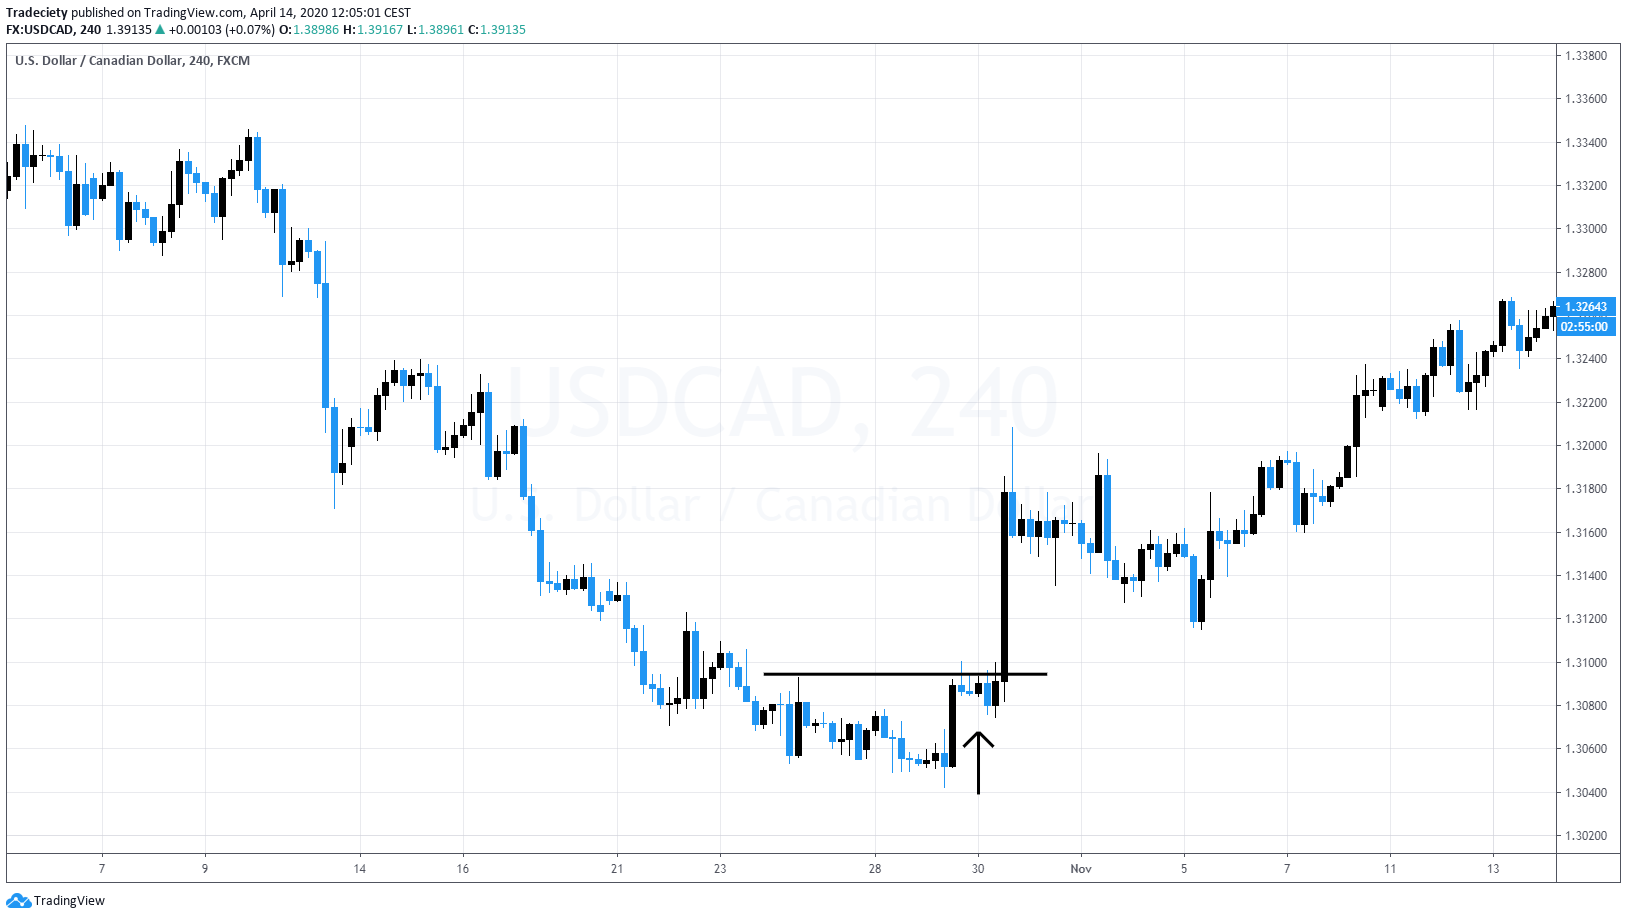
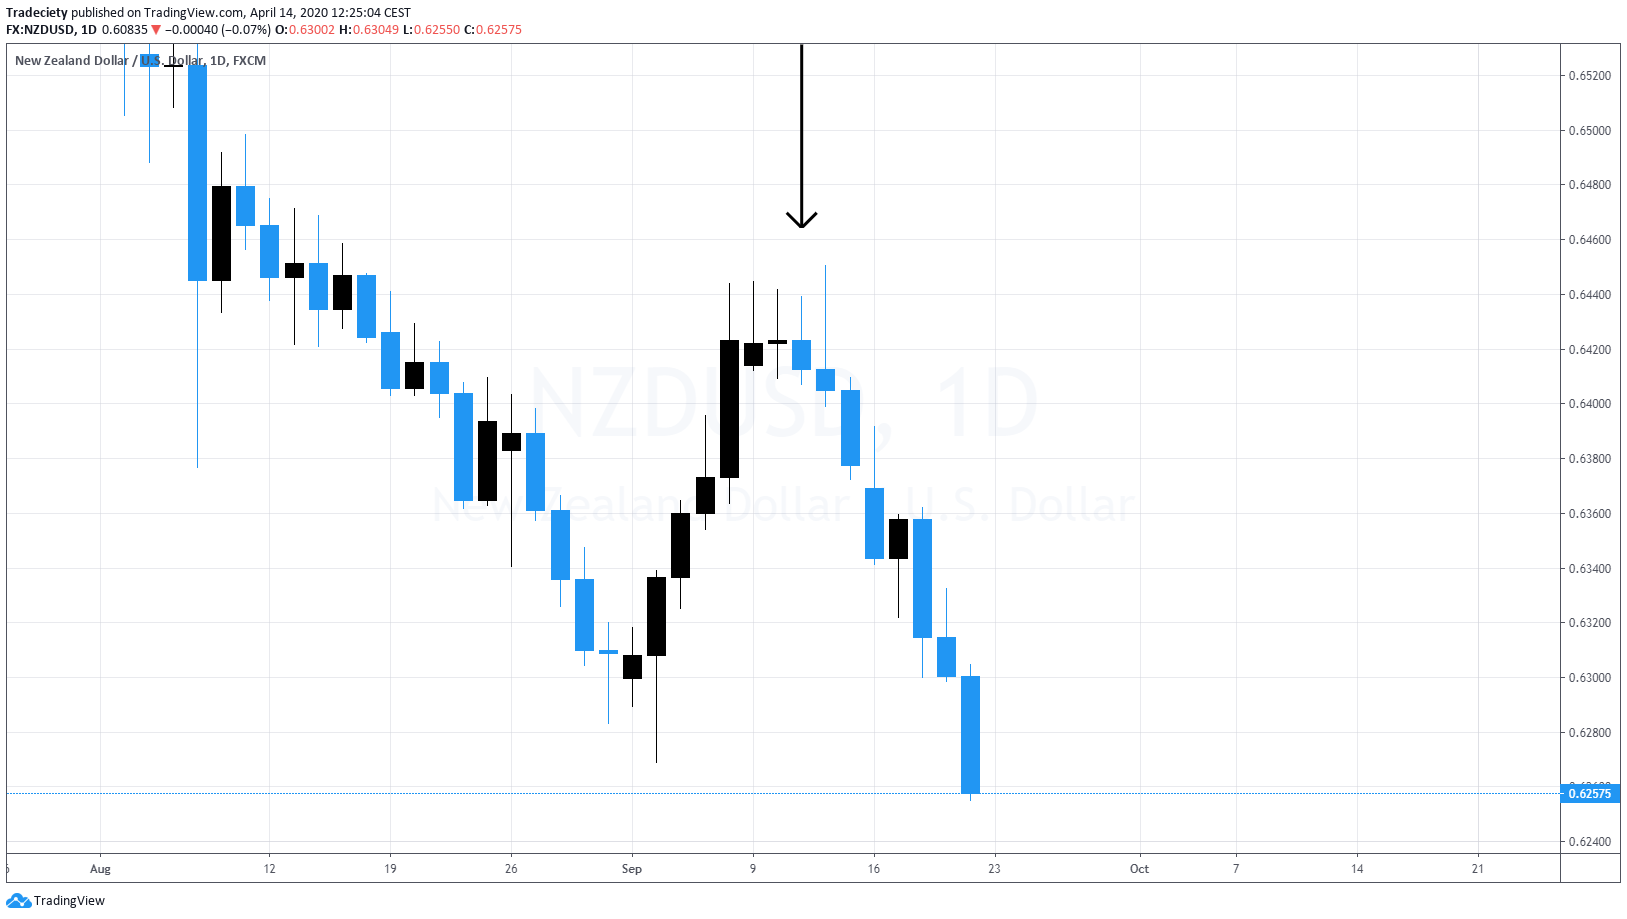
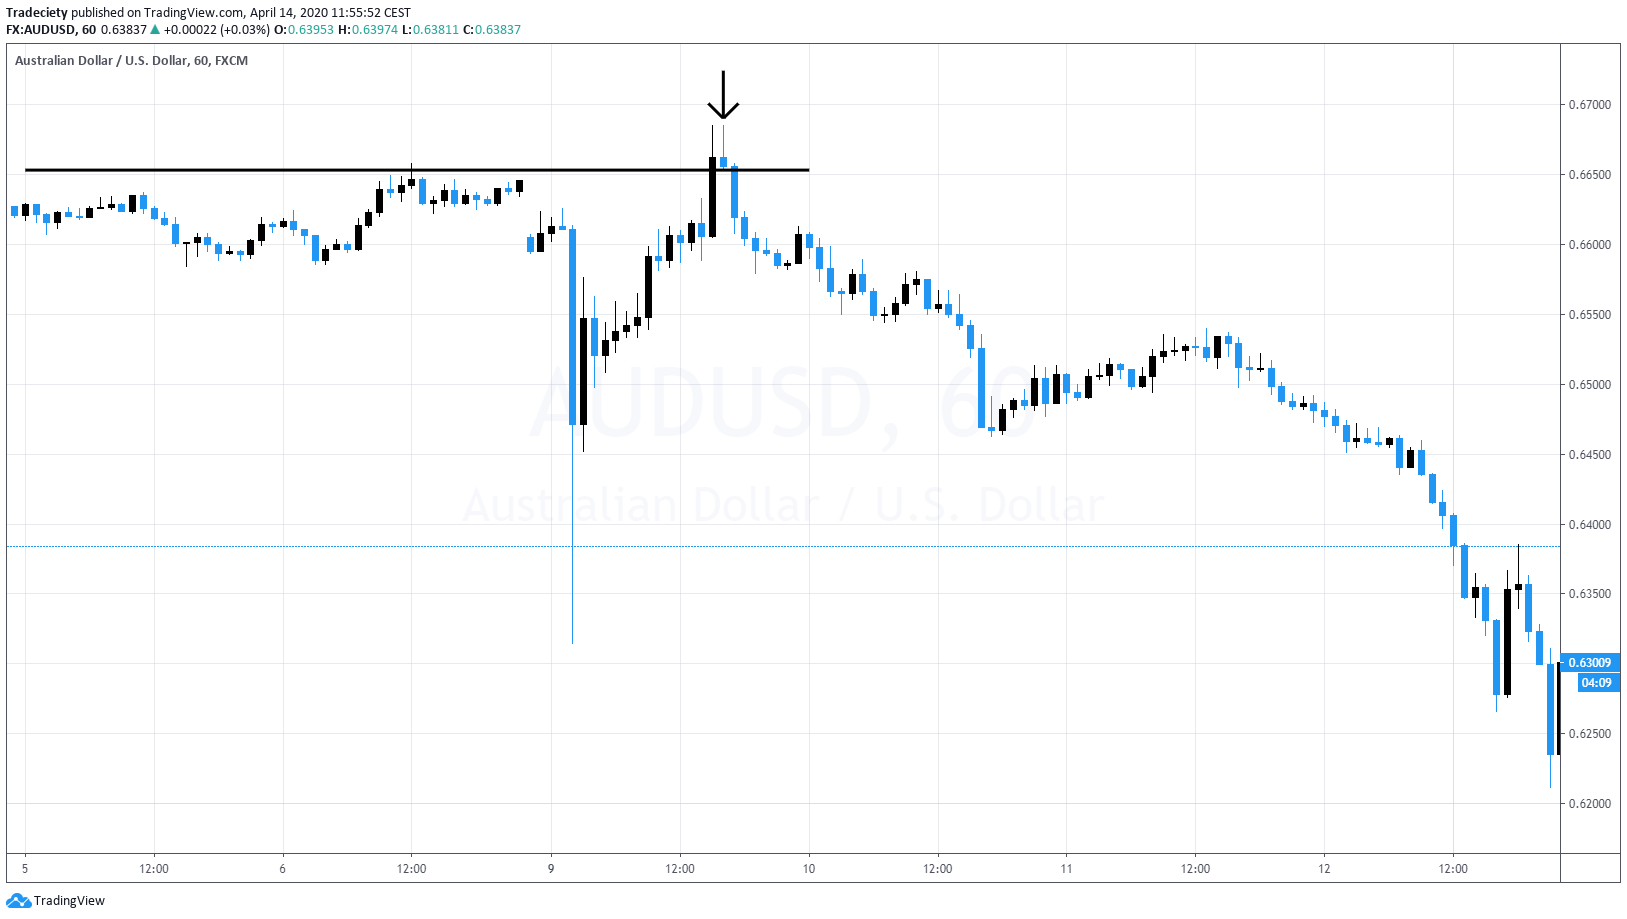
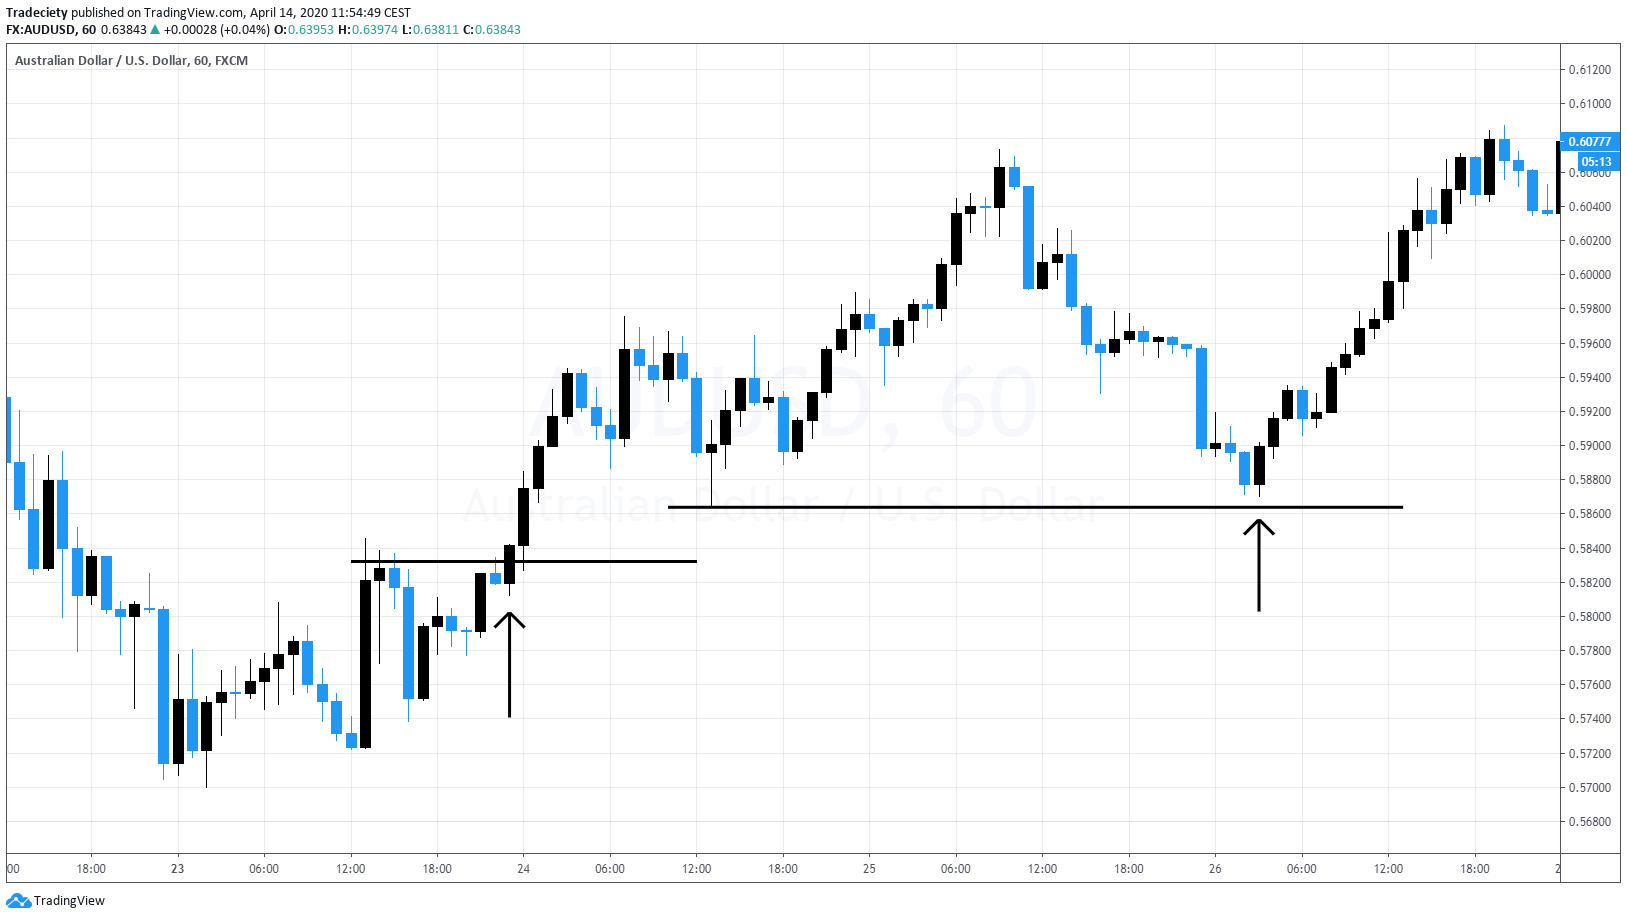
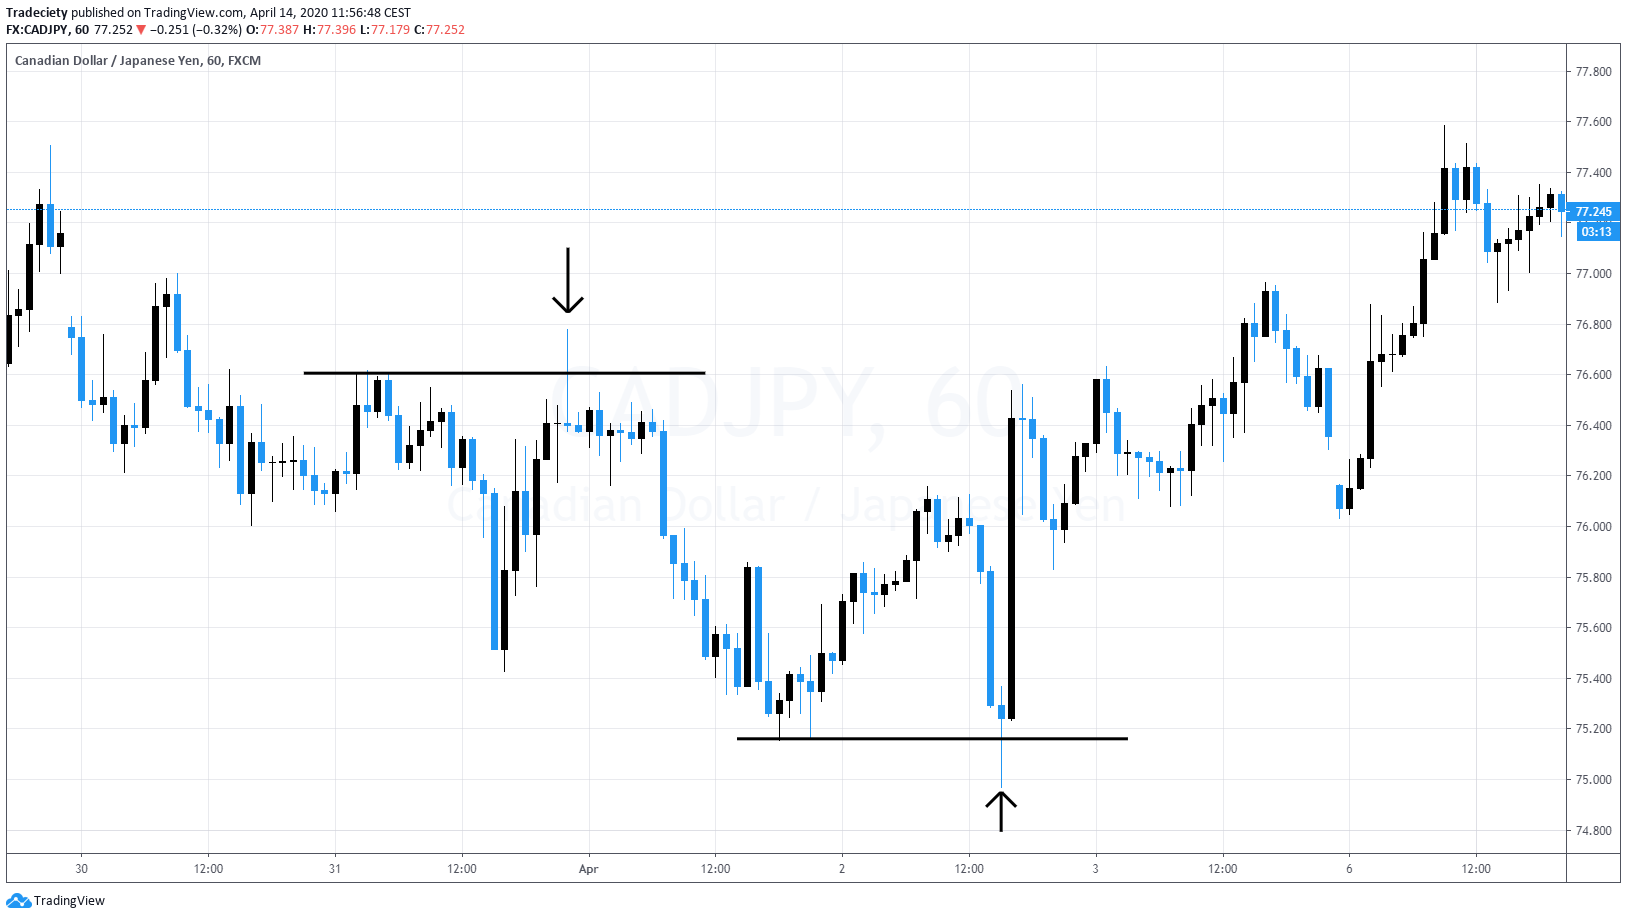
I’ve talked about this a few times and what it means is that you look for an established downtrend or an uptrend. In this example, we have a downtrend. You wait for the pattern and for the price action to slow down. Here in the bottom when you put an RSI for example or a Meg D, you will see that we have a divergence here and then you have this double top here but at the low of the pattern so we have one swing point high. We have another swing point here and before the market takes off, this is the buildup. The market is really sticking to the level. It’s not able to break higher but more importantly it’s not able to push lower so it’s not coming close to the previous low at all which already indicates more building bullish pressure and then you could go to a lower timeframe and wait for the breakout to happen here to time your entry. Here we have a bearish scenario.
(05:24):
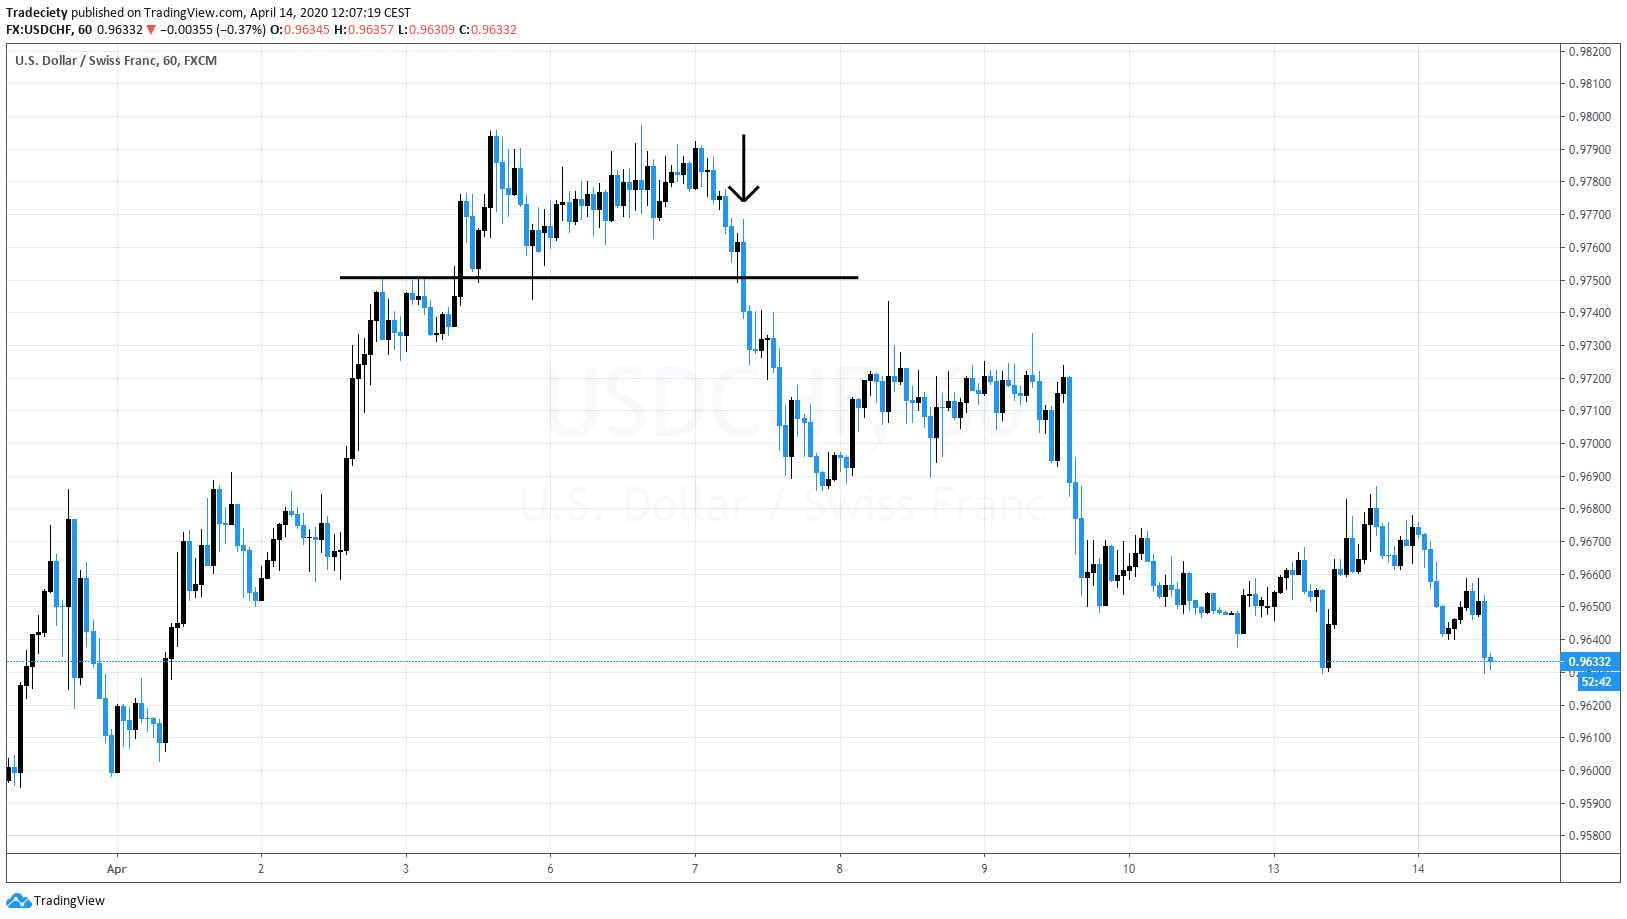
So the market wasn’t an uptrend. Then uptrend ran out of steam. You can see we have a double top here. You might be able to also include here a trend line breaker which we are going to look at later and before the breakout you will see that the market is just giving you here this little inside pin bar candle which shows you that there’s not a lot of strengths in the market and the buyers are not really strong so the prices really sticking to the level and then the breakout candle is a very strong one and you can see it as this also an outside bar which we are going to cover in a later part of this video as well. So there are a few things coming together with this breakout buildup as well, which is very, very important to analyze. And the most important feature about a breakout buildup is that before the breakout happens, you can see a very, very small reaction, which means that the bulls are not strong, the bears are taking over and you better get ready for a potential breakout.
(06:20):
Deceleration acceleration really integrates nicely with all the strategies that we have discussed and the other ones from all my other YouTube videos. And this basically means that you analyze price, action and momentum. So here, you can see the market is an overall downtrend to down trending phase was over here for. For now, then you can see there is a potential or is a bullish reversal and you can see the candles are getting longer here, very, very long candle here with this bullish candle. And then you can see here we have one, two, three very, very small candles. We can see after the long candle, the momentum suddenly died down and there’s very, very small momentum only. So very small candles, which means deceleration. It’s like a ball. When you throw it in the air, it will be very quick in the beginning and as nearest, as the top, the momentum slows down and the movement becomes smaller.
(07:13):
And then here it slowly rolls over. You can see we have this pin bar here and then to the downside, the candles size accelerates again, same when the ball accelerates its movement to the downside, it will accelerate and accelerate. So this is the concept behind deceleration acceleration. Here we can see it in the context of a trending market, so the market, wasn’t a strong uptrend and this is called an evening star or Morningstar pattern. You have strong candlesticks leading into the turn into the top. Then you have a very small dodgy pin bar candle which shows you that the momentum is decelerating and then on the other side the momentum is accelerating to the downside. So we can really nicely follow this momentum and we can really nicely see how the momentum is turning. When you look left, you could also include a support resistance area.
(08:02):
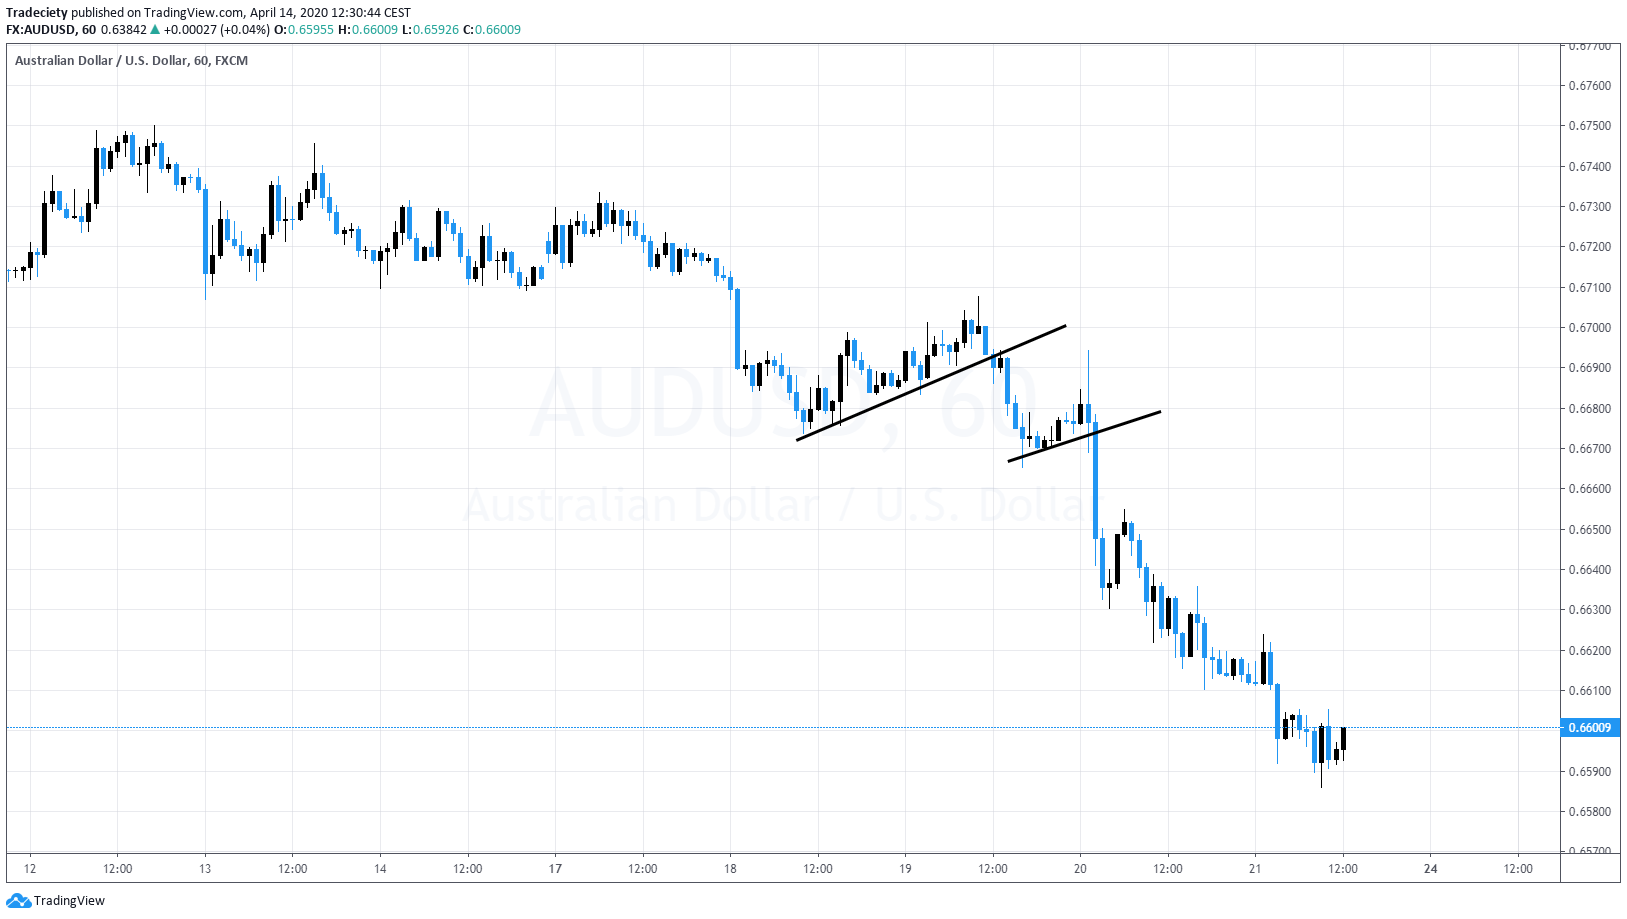
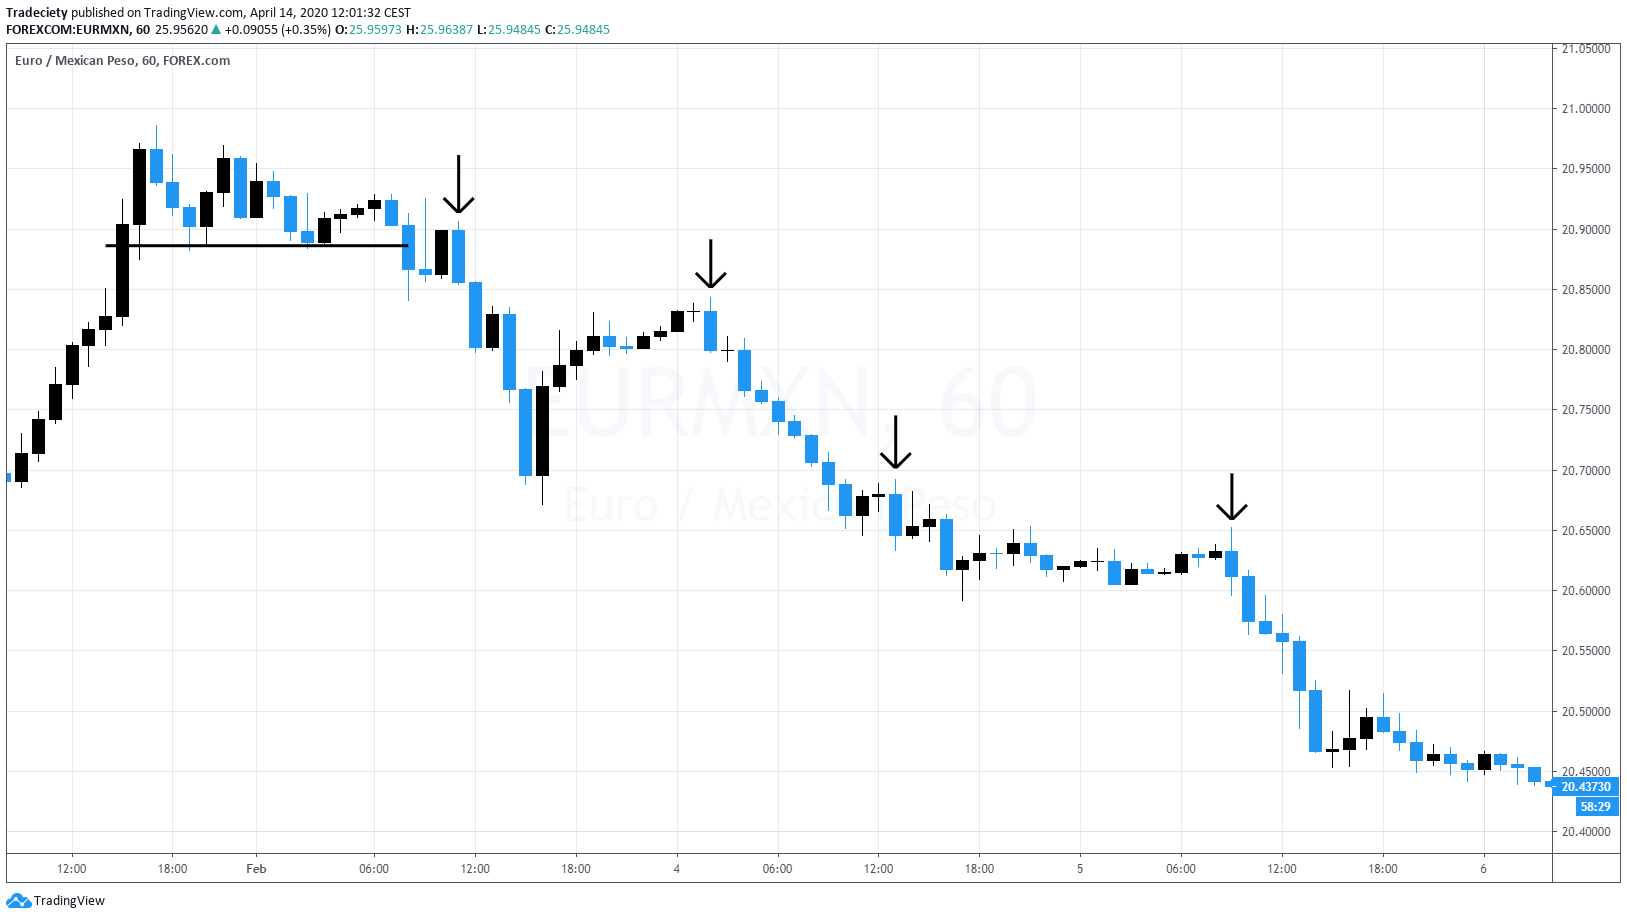
So maybe you only take deceleration acceleration traits when you see that they are happening at previous strong turning points to increase your odds. Flags are very, very powerful. They are usually trend continuation patterns. So the market is in a downtrend and usually when you look at trending markets, the price will not just fall and move in one straight line. There will be ups and downs, it will be back and forth and flags help you understand this back and forth pattern. So the macro wasn’t a downtrend then it stopped. But how did it stop? Very, very weak. So there was not a lot of bullish interest. You can see the market here fell very quickly, very strong, a bearish move and then here, the bullish move was very, very weak. So it already tells us that there are not a lot of bulls in the market.
(08:49):
And then you can see once that flag breaks, the downtrend accelerates. Here we have concept of deceleration again. The bulls are not really taking over very small up trending phase or very small consolidation already shows us again that there’s not a lot of bullish pressure and then here, uh, once the flag breaks the momentum really accelerates to the downside.
Here another example again in the context of a downtrend, very strong downtrend and then here a very weak bullish phase and this is obviously showing us that there’s not a lot of buying pressure behind it and we better get ready to look for continuation traits then the market, market falls. Very strong selling momentum here during the downtrend. The downtrend stops here temporarily, but only very weak. You can see the market only moves sideways. There’s no impart in this, no attempt from the bulls to drive the price higher before the break out of the flag we have here also, a break out build up, so the market is coming back into the level quicker, significantly lower high compared to what we have seen here.
(09:49):
And then the market as accelerates to the downside, comes back into, into the flag and gives you here another re-entry opportunity. The re-entry opportunity looks here also like a deceleration so you can see we have strong candle and then here a small candle and then to the downside the market accelerates again.
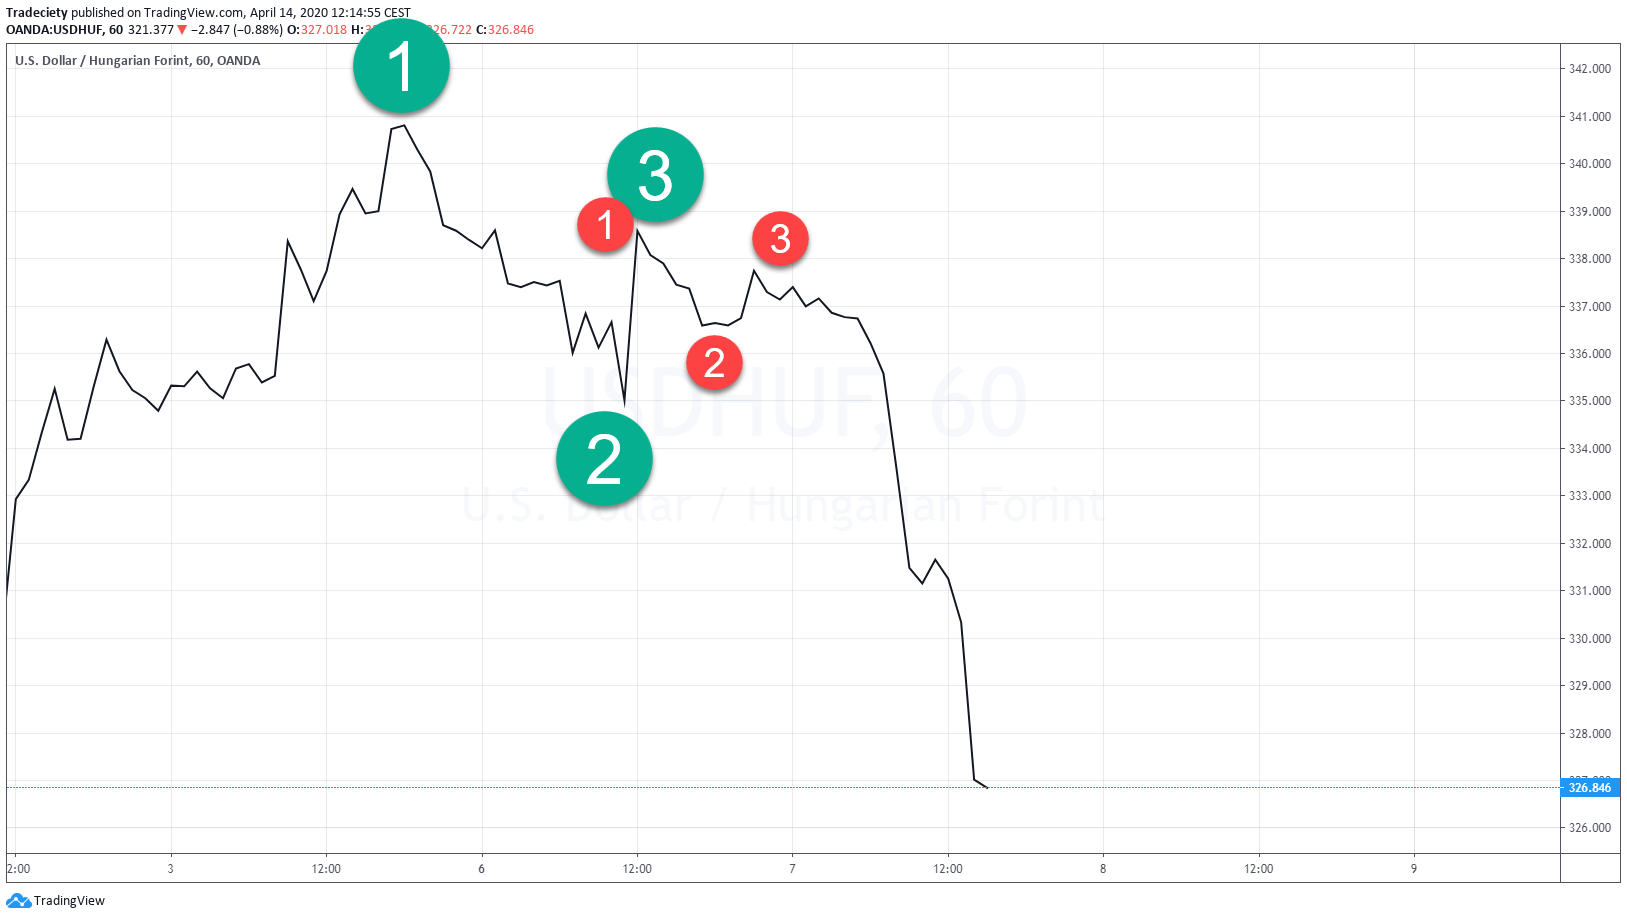
Tweezers are very famous because they are built around to pin bar pattern, but it’s not only a single pin bar but the tweezers, user’s two pin bars next to each other. So this is usually what a pin bar, what a tweezer looks like. You have a very strong resistance level. The market moves into the resistance level, gives you one rejection candle, gives you another rejection candle. Two very strong pin bars showed rejection of the level. No momentum year, no interest to really break higher. So there’s no bullish power behind this move. And then to the downside, the market accelerates and continues to bearish pressure.
(10:43):
Here we have a multi top tweezer. You can see that the uptrend really accelerates into the top. Then we have two dodgy bars. So in total we have three tweezer tops here, which again show us that the market tried to break higher, but there was not a lot of momentum here behind this move. So the bulls are not really convinced and they are not strong enough to move the price higher. And then here to the downside, the market slowly accelerates so we can see this concept, eh, in work or at play here again and you can see to the downside then it accelerates and starts and continues this downtrend. So tweezers can be very nicely combined with other concepts that we’ve talked about. We will talk about the spring pattern later and this also would fit in nicely so you can already see how you can include multiple trading strategies to form an even more robust trading approach.
(11:37):
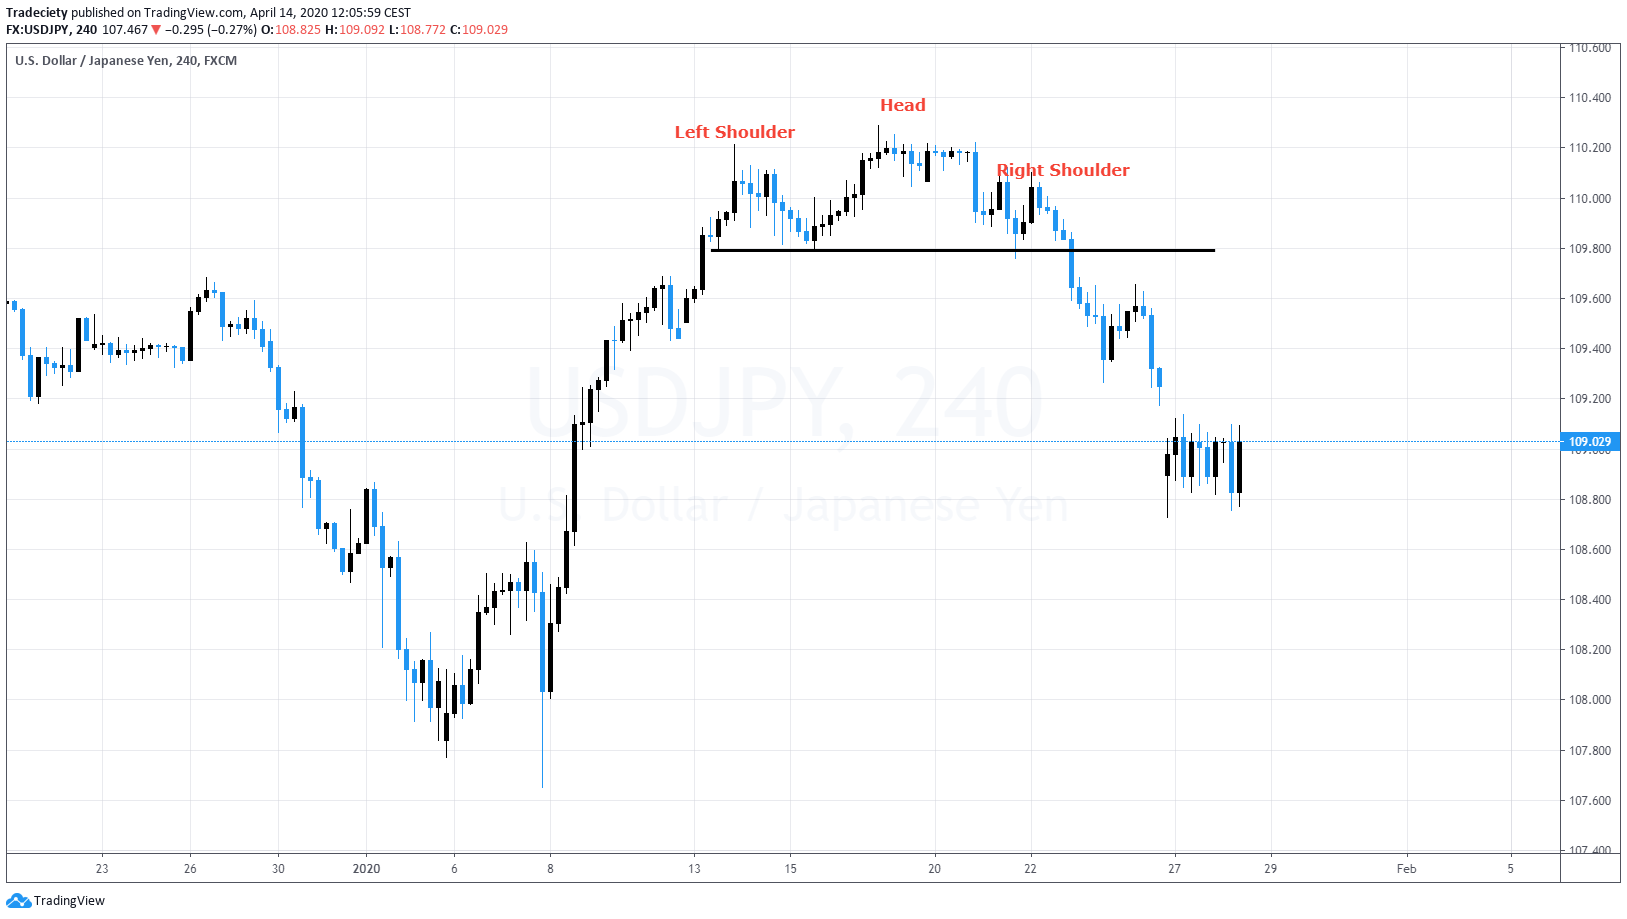
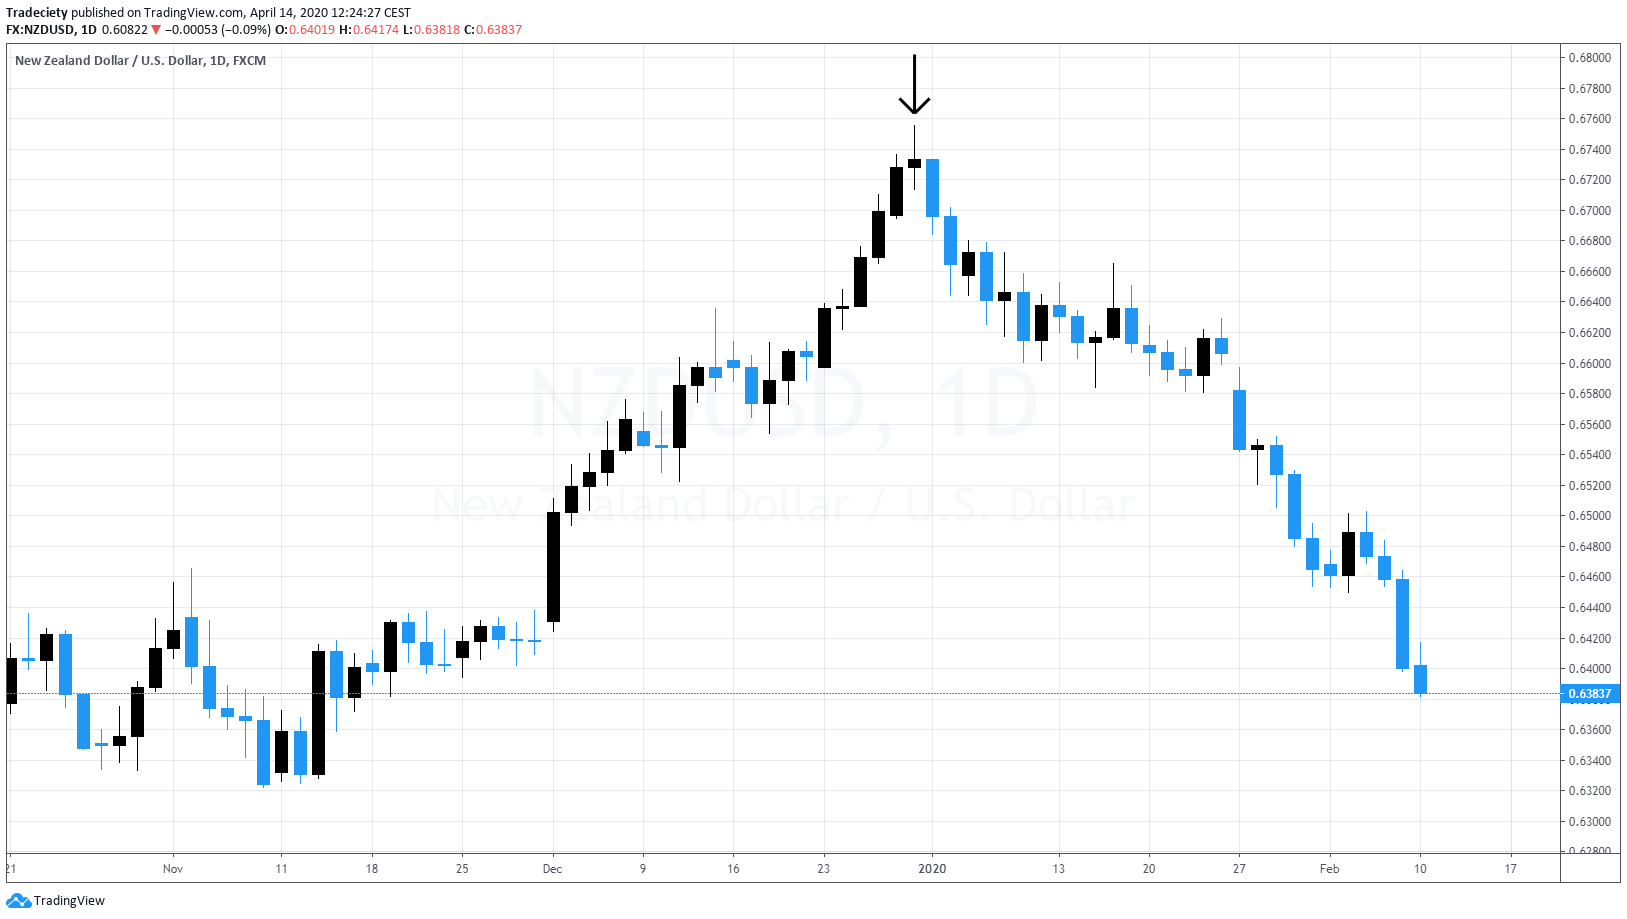
Head and shoulders, now we look at a broader market pattern and we try to analyze and understand the, the price action in market context with wave analysis. So head and shoulders are usually best used after trending markets when you are looking for a head and shoulder reversal. So you can see after this fake or a failed breakout, the market starts this uptrend here, this is also a spring pattern which we’ll come to know later. And then you can see the, the uptrend via accelerates until it moves here into this top. And then from here to here, the market was only barely able to break below the previous highs or above the previous highs, which is already a very, very important market. It tells us that although the market made a higher high, there was not a lot of momentum here and the price was barely able to break higher.
(12:25):
If you put a RSI or stochastic or Meg D, you will see that this is also giving you a divergence because it shows that the market is actually losing strength. And then here to the downside, you can see from the head to the right shoulder. Now we make a significantly lower high, which indicates that this is the first time that the market during the uptrend actually changed its high and low structure. Whereas previously during the uptrend you see only higher highs and higher lows. Now we are making a lower high which is a very, very important factor. We have our support level here and once the support breaks the new downtrend is started.
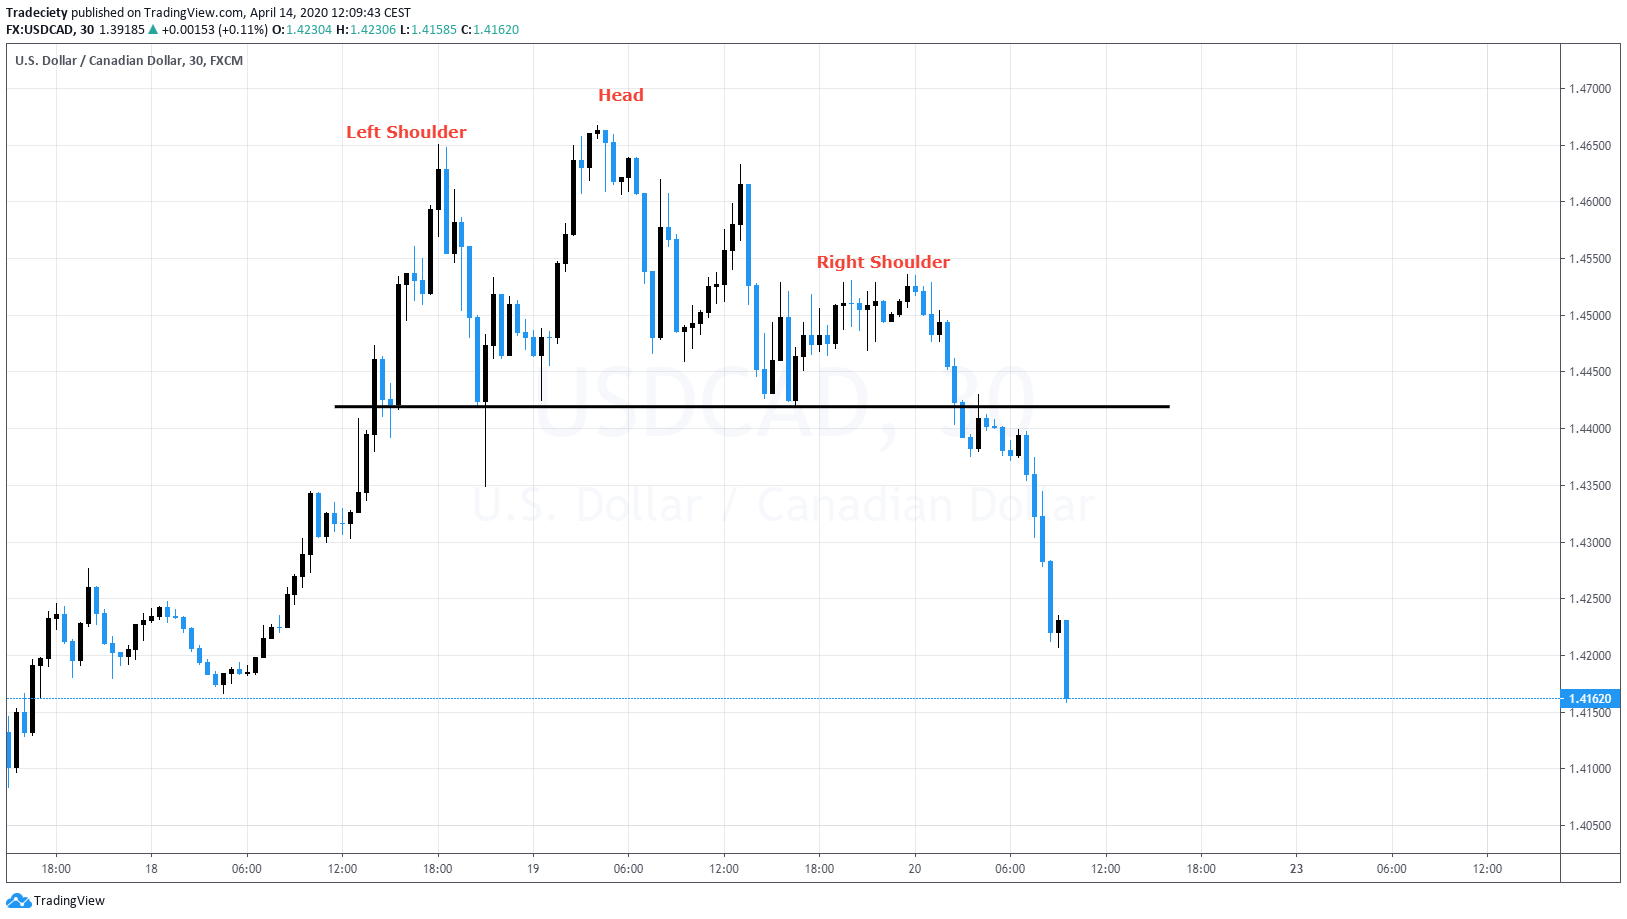
Here another example, the market is coming from an uptrend. Then from this area to this area the price just barely was able to make a higher high, which is already here, a very weak signal and you can see after we have established a top, you can see we make lower high and lower high and that here significantly lower high, which also looks a little bit like the breakout build up.
(13:21):
Not as strong as what we’ve seen in the other picture or the other examples, but regardless or nevertheless, a lower high, a significantly lower high, which tells us that now the bears are coming into the market, the bulls are not able to push the price higher and you can see we have then to final break or below this support area and then the downtrend was initiated. So the head and shoulder is usually a connector pattern. It connects two trending phases and when you look for head and shoulder as a reversal pattern, it connects, connects two opposing trending phases. So it connects this uptrend to the downtrend.
The outside bar strategy, we talked about this in previous videos, but let me recap it again and explain it in this context. So the outside bar as the name suggests is completely outside of its previous candle stick.
(14:09):
So here you can see the market has a very strong bullish candle, then a very small bearish candle and then here it has a strong bullish candle. Here we have the same picture, small bullish or bearish candle and strong bullish candle. It is not enough to trade an outside bar on its own. They are not strong enough signals. Keep or remember or just seeing in this context you will see that those are just single candle sticks so we need to apply context and other rules to the outside bar. It is example we or I use support and resistance and swing highs and lows to complement as trading idea. So here you can see this outside bar happens right at the previous high point so this isn’t a breakout confirmation. The market is breaking above the previous highs, continuing the uptrend that was already started. In this context, the market is coming back into a previous support level.
(15:02):
Here is a significant support when you connect this low and this low in those closest here and you see the market dip below that have failed to break lower and then the next candle fell back into the range with a strong outside bar and then continued this up trending move.
Here we have a few outside bar signals and scenarios and those are used in a trend following context so the market did roll over here. We have a triangle pattern here at the top, we have to break out or the break out does not initially succeed. You can see an inside pin bar, then a small bullish counter, and then here this is the outside bar that really triggered this down trending move and very, very often behind or after an outside bar. You will often see the trend really accelerate. You can see here afterwards, after this down trending phase, the market shows you a little bit of a consolidation, very weak, very small candles,
(15:54):
that’s very, very important. You always need to put everything into context. So a very, very strong, a weak up trending face here, very small candles, doesn’t show a lot of bullish interests and doesn’t show that the bulls are really ready. And then here you can see again the deceleration with a dodgy acceleration with the form of this outside bar. And then the new downturn was started. Here again, small consolidation, strong down, outside bar, continue to downtrend, long consolidation but very weak, the prices, not even able to make a higher high. So the market is not having any bias here in the market. And then you have this outside bar which tends signal to continuation of this downtrend.
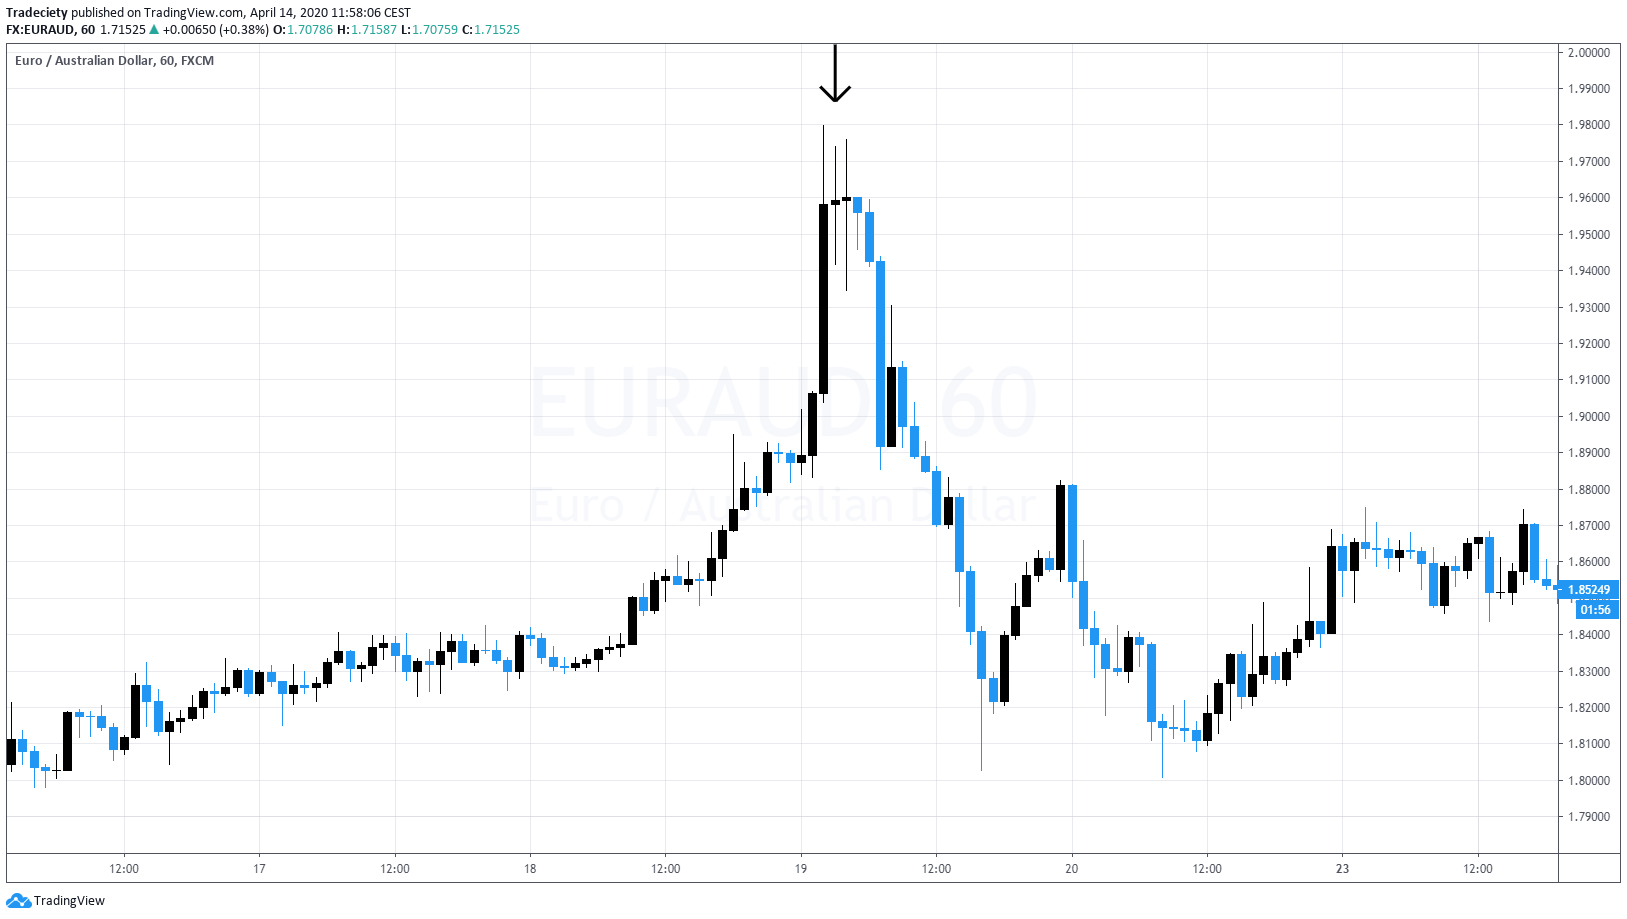
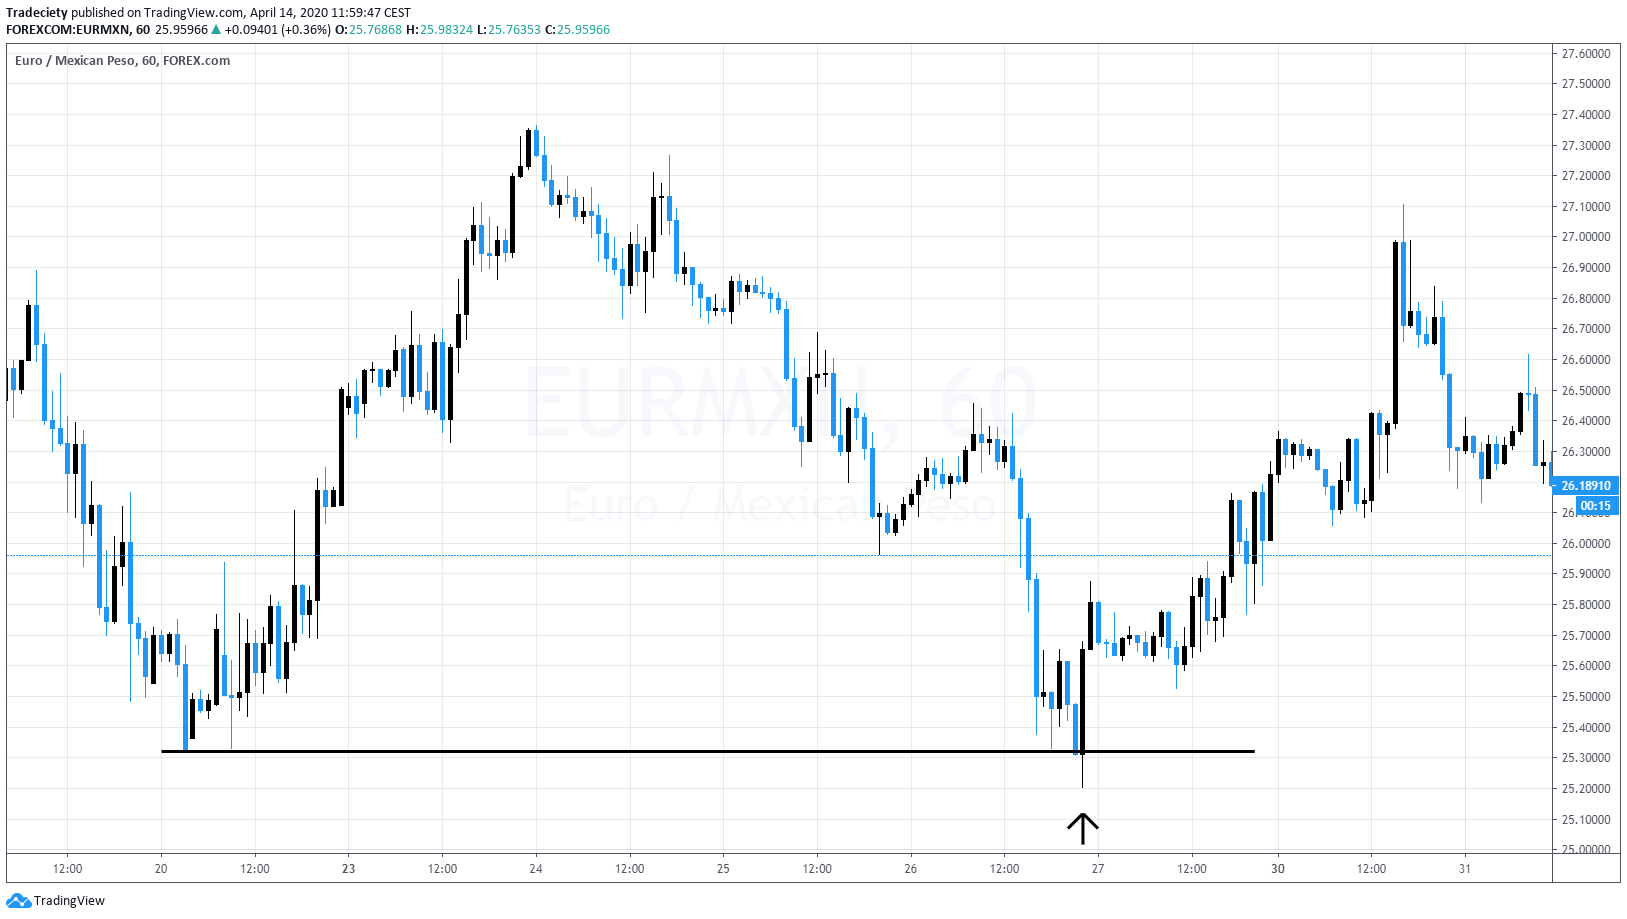
The spring pattern integrates also very nicely with the previously discussed concepts. So here we are looking for springs and fade breakouts, at previous support and resistance levels so we draw a line across or around previous important swing highs and lows and then you, when you see such a strong fade breakout, it often indicates that the market is going to move away from the direction of the wick.
(17:04):
So if the wick is pointing high up. Very often you will see that the market is then falling lower away from the wick because the wick shows that although the price tried to move higher, although the price tried to break out above the highs, there was not a lot of bullish support and the sellers completely took over this market here, which shows us that not a lot of bullish pressure but a lot of selling pressure is here in the market, especially when you see it in the context of where does this happening. Then the downtrend was continued to downtrend, put in a low here. The price came back into this low and shows you again a failed breakout. We can see the concept of deceleration and acceleration again with a pin bar or with this spring here. So very, very great pattern to combine with the other factors that we already discussed.
(17:50):
Here again, we want to look for spring patterns, at key support and resistance area. So here we have a very, very important turning point. This turning point led from a bullish, from a bearish trend to bullish trend. So clearly this is a very, very important level. Then we wait for the market to come back in this level, we have our fake breakout and even more we have an outside bar, sort of spring happens together with an outside bar and you can see it’s the origin of the next bullish trending leg. So a great, great pattern to know about.
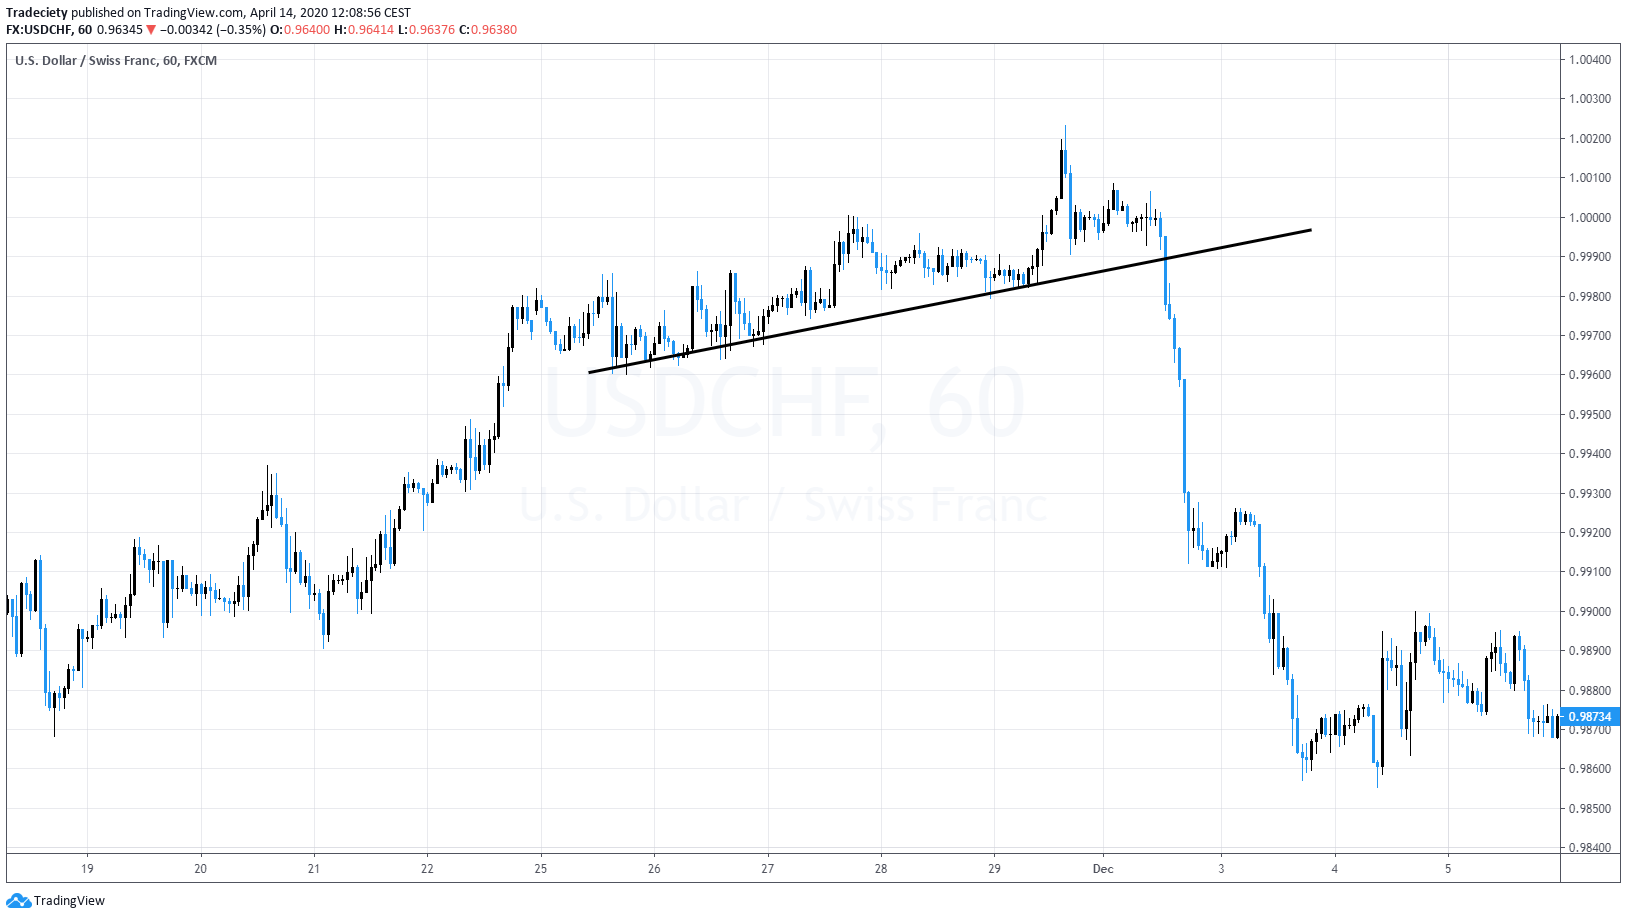
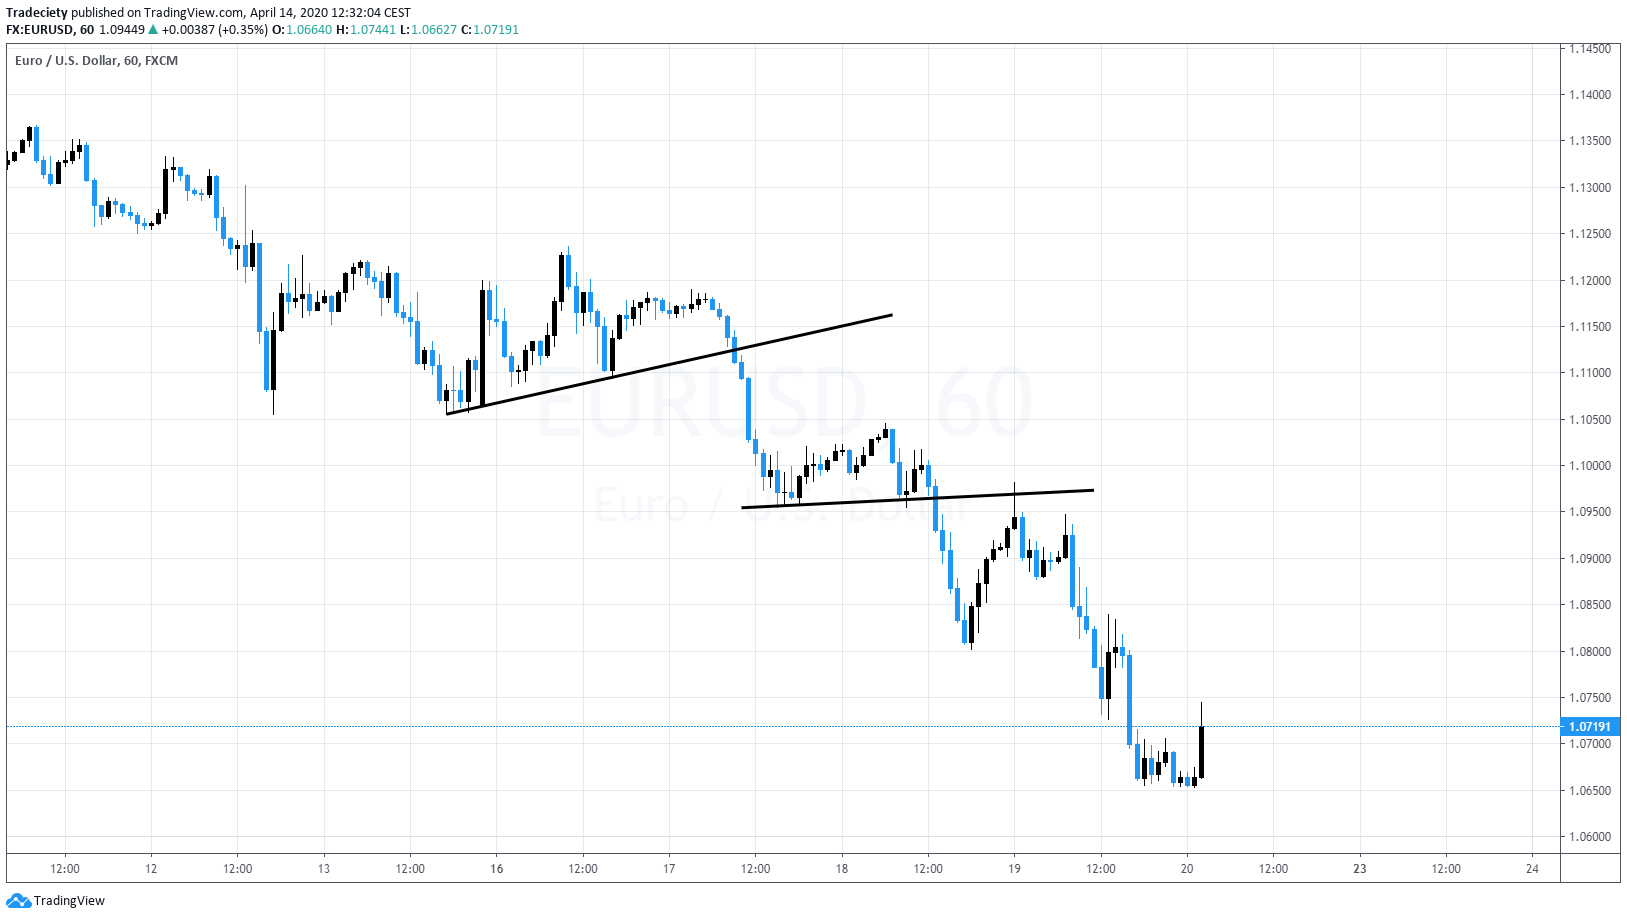
The trend line breakout is again a multi candle pattern. So we look at broader context instead of just one or two single candlesticks. So the trend lines will often tell you a lot about what is happening in the markets. The trend line would tell you a lot about a strength of momentum.
(18:39):
So when we look at the origin of this trend, you can see the trend started very, very strong, very strong, bullish, um, interaction and very, very strong bullish phase. The market here rallied very quickly and then here as the market moved into the top, the trend line became shallower and shallower. When you put a trend line here, it’s a very steep. When you put the trend line here, it’s very shallow. And then here on the breakout, the market then completely sold off. So the trend line breakout, especially when you put it into the contest, when you see that a trend is actually slowing, it can help you to point towards opportunities where the market is going to roll over. So a trend line break out can be used as a reversal pattern.
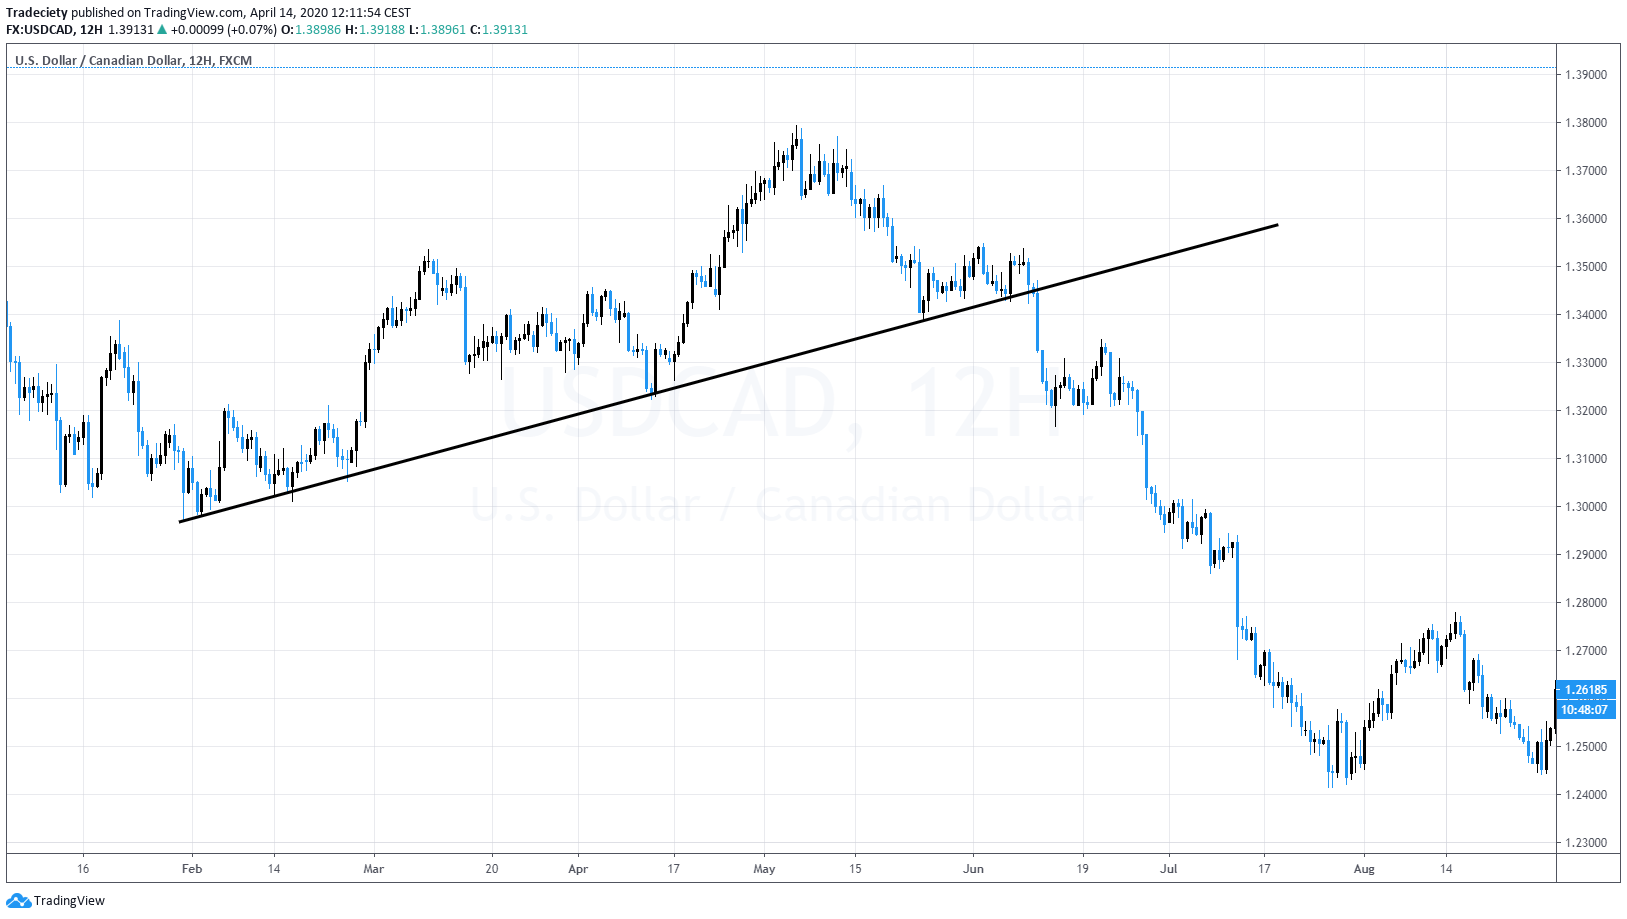
Here another very interesting pattern. The trend line here is very, very obvious. And again, for a pattern or for a trend line to be valid, you need at least three touch points.
(19:34):
The more touch points, the better. So we have one, two, three, four, five, even a six ones. And you can see when we look at highs and lows, what we can see here is that, he has the ultimate high and then after this high the price, never even came close to this high. We made a significantly lower high here. So this tells us already not a lot of bulls, a lot of bears in the market. This even looks like a lower bounce here, a breakout buildup, and then once this trend line was broken, you can see this trend really, really accelerated to the downside. So trend line breakouts, if you can find a valid trend line with multiple touch points, might be a very good option to trade. So those are the eight price, action trading strategies that I included in this video. Let me know which one you like the most. And I will make it more detailed in depth a video on how to trade it. Using entry stops, take profits and other factors as well.
external link:


We have been trading supply and demand strategies for over ten years, and they have stood the test of time remarkably well. Supply and demand is...

3 min read
Choosing the right trading journal is essential for traders wanting to analyze performance, refine strategies, and improve consistency. In this...

3 min read
“95% of all traders fail” is the most commonly used trading related statistic around the internet. But no research paper exists that proves this...