3 min read
Scientist Discovered Why Most Traders Lose Money – 24 Surprising Statistics
“95% of all traders fail” is the most commonly used trading related statistic around the internet. But no research paper exists that proves this...

A main reason why traders fail to find profitable trades is because they don’t fully understand the nature of price movements and price structures. The majority of retail traders usually gets caught up in the day to day price movements, following the same old principles of technical analysis that leads them nowhere.
When we look at natural price movements, there are typically just two broader structures that repeat themselves over and over and over again:
(1) Consolidations
(2) Trends
This means that, at any given time, price is either trending or consolidating. Granted, this is no new insight, but most traders never think further and certainly don’t explore how to use this knowledge to their advantage.
The screenshot below shows a regular price chart and you can see that price is either trending or consolidating. Whereas trends are relatively straight-forward – with a few exceptions – consolidations come in many different forms and shapes.
Most traders look for existing trends and then try to jump on board. Trend-following means that you are entering after price has already trended for a while and it has become obvious that there is a trend. This is retail thinking 101 and can lead to chasing price, entering way too late and missing out on most of the moves.
The real money is made by understanding and reading transitioning periods. However, it has to be clear that this has nothing to do with predicting price movements before they occur. After chasing price, predicting the next price move is the second most commonly made trader’s mistake. Entering a trade into the opposite direction of the ongoing trend or anticipating a breakout before it happens has nothing to do with successfully trading transitions.
We at Tradeciety are pure reversal traders, specializing in trading market transitions, especially transitioning periods from consolidations after a trend into a new trend. We look for over-extended price moves, market top (or bottom) patterns, fading momentum and trend shifts to determine high probability market reversals.
There are 4 consolidation structures that are extremely important for reversal traders because they show transitioning periods nicely.
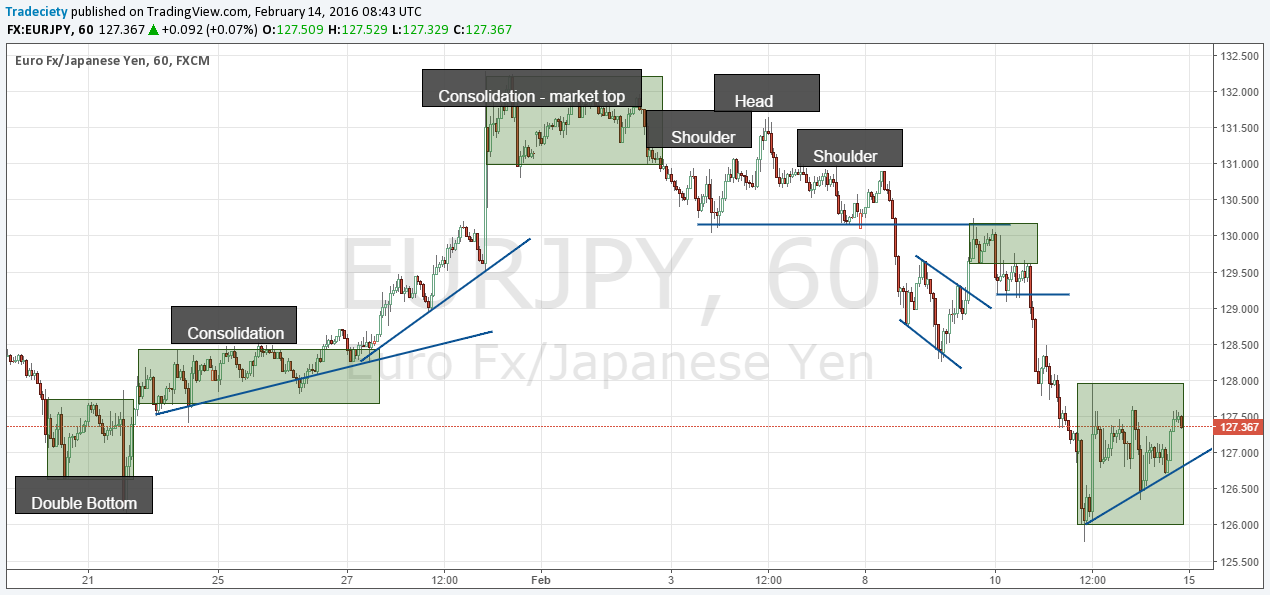
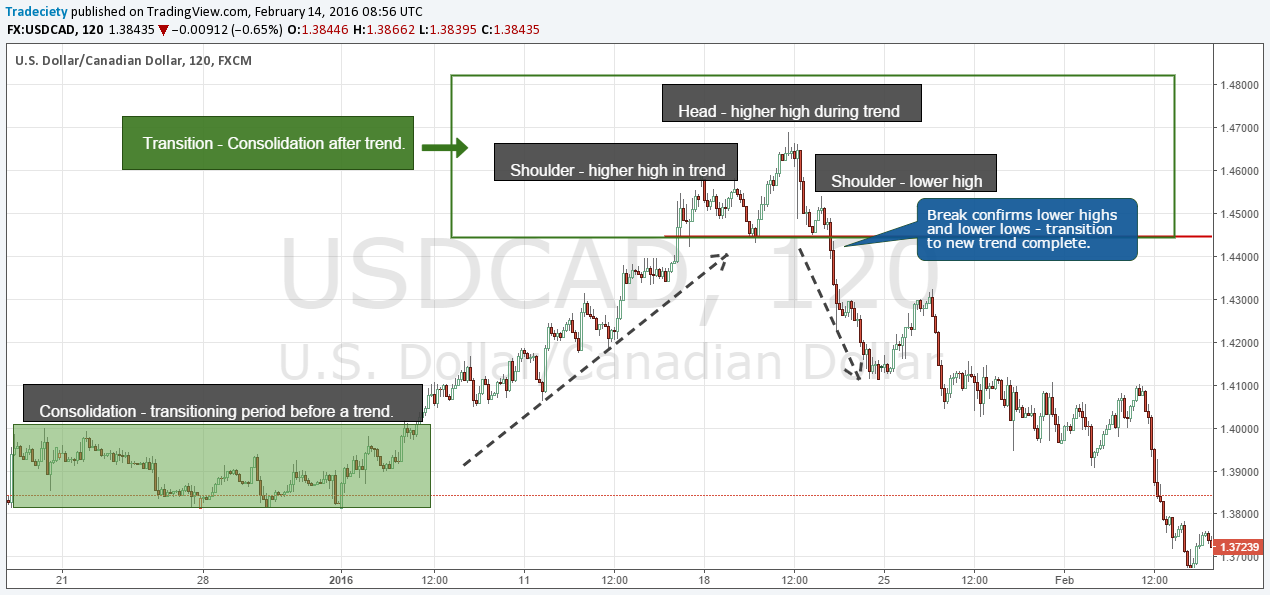
The clearest and most telling transition happens at market tops and bottoms with a Head and Shoulders pattern. Although we are not pattern traders by definition, the Head and Shoulders pattern is by far the best transition pattern because it depicts a natural shift in sentiment.
At a market top, a Head and Shoulders pattern shows how price goes from higher highs (left shoulder to the head) to lower highs (head to the right shoulder) and then finally to lower lows (break of the neckline). The Head and Shoulders pattern is, therefore, much more than just a chart patter, it visualizes the transition and the shifting balance from buyer surplus to seller surplus.
Further reading: Understand any price pattern
A Head and Shoulders pattern is often accompanied by a momentum divergence when the wave from the left shoulder to the “head” lacks momentum compared to previous price. A momentum divergence is usually not a good enough reason to trade a transition by itself, but if it occurs with another structural transitioning pattern, it can increase the odds significantly.

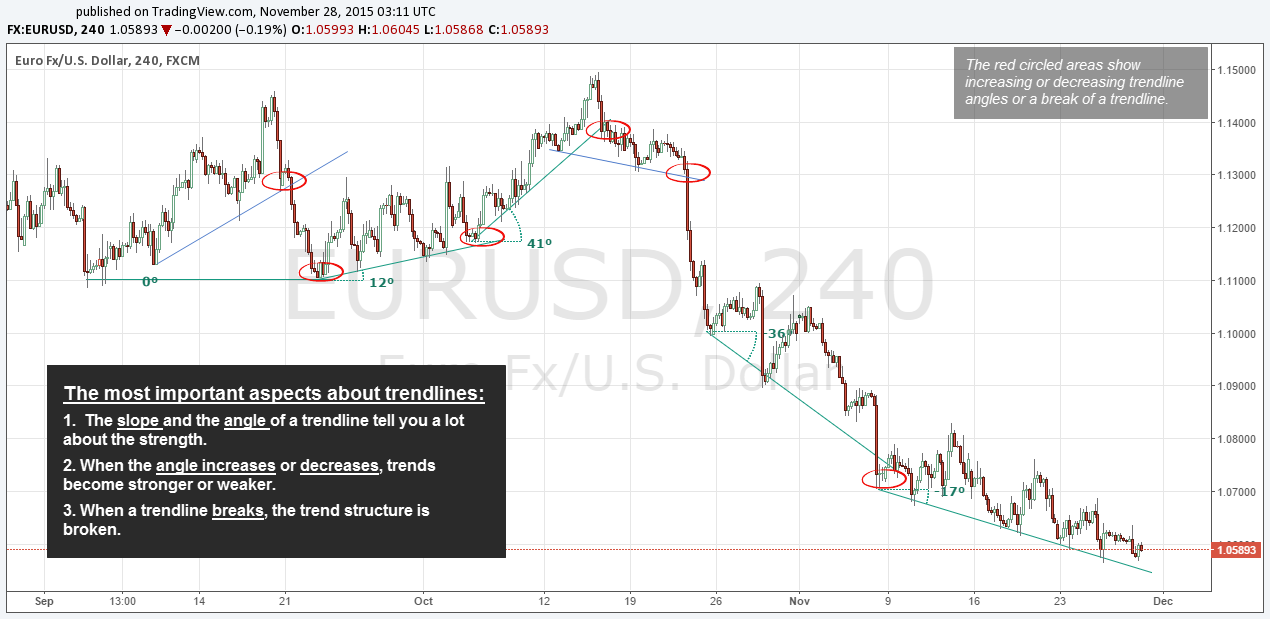
Trendline breaks are a reversal trader’s best friends. Many traders use trendlines to track trends; and once a trendline is broken, a cascade of stop loss orders is triggered which leads to accelerating price movements; finance research confirms the effect of price cascades after stop loss orders.1
Secondly, a trader should monitor the angle of trendlines and the development of trendline angles. A trend in which the angle of the trendlines increases shows momentum acceleration. Unsustainably explosive trends eventually enter a consolidation and then a reversal. Extreme trends typically have shorter consolidations with more volatility compared to the Head and Shoulders transition because the very nature of extreme price behavior.
A double top is another popular consolidation pattern after a trending period. Double tops are a typical transition pattern and although they look straight-forward, they are often misleading and challenging to trade.
To increase a trader’s odds, adding Bollinger Bands can prove helpful. A Bollinger Band spike at a double top is often followed by an immediate reversal into the opposite direction. The double top transition happens frequently but because it is an obvious retail pattern, there are a lot of false signals around double tops. The Bollinger Band spike can act as an additional filter and improve the accuracy of signals.
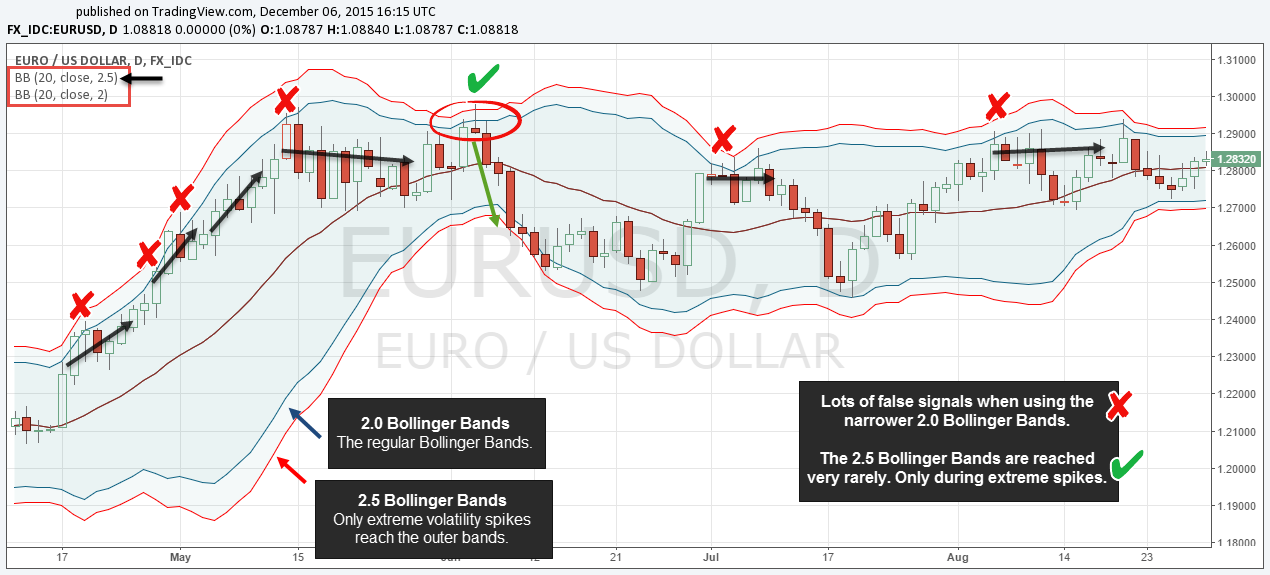
Use 2.5 Bollinger Bands instead of 2.0
The failure rate of retail traders is high and it’s arguably way higher than the 95% most traders keep talking about (click here to read more). I am a strong believer that, besides an insufficient work ethic and a false approach overall, not looking beyond regular chart analysis is an important factor contributing to the failure of traders. Traders typically all read the same trading books, keep talking about the same principles of technical analysis and exchange the same thoughts and ideas about price analysis. But they don’t wonder why they are all seeing the same results.
Critical thinking and scrutinizing common knowledge is an important skill – not only in trading. Instead of following the same old talk of trend-following, I urge you to explore a different approach. We have stressed the importance of “reading” sentiment and understanding the dynamics that drive price many times and it is the corner stone for efficient technical analysis.
Further reading: Reversal trading 2.0 – The 4 components of professional reversal trading
1 Osler (2002): Stop-loss orders and price cascades in currency markets


external link:


3 min read
“95% of all traders fail” is the most commonly used trading related statistic around the internet. But no research paper exists that proves this...

3 min read
Trendlines can be great trading tools if used correctly and in this post, I am going to share three powerful trendline strategies with you.

3 min read
Choosing the right trading journal is essential for traders wanting to analyze performance, refine strategies, and improve consistency. In this...