Supply and Demand Trading in 2026
We have been trading supply and demand strategies for over ten years, and they have stood the test of time remarkably well. Supply and demand is...
When trading single candlestick patterns, no pattern is more powerful than the engulfing candlestick pattern. You can create strategies with only this pattern that may easily outperform the market. I know a trader who has built his whole career on this pattern alone.
An engulfing candlestick pattern is a powerful signal of momentum reversal in technical analysis, and identifying one is quite simple. This pattern occurs when the body of the current candlestick fully engulfs the body of the previous one, signaling a potential shift in market sentiment.
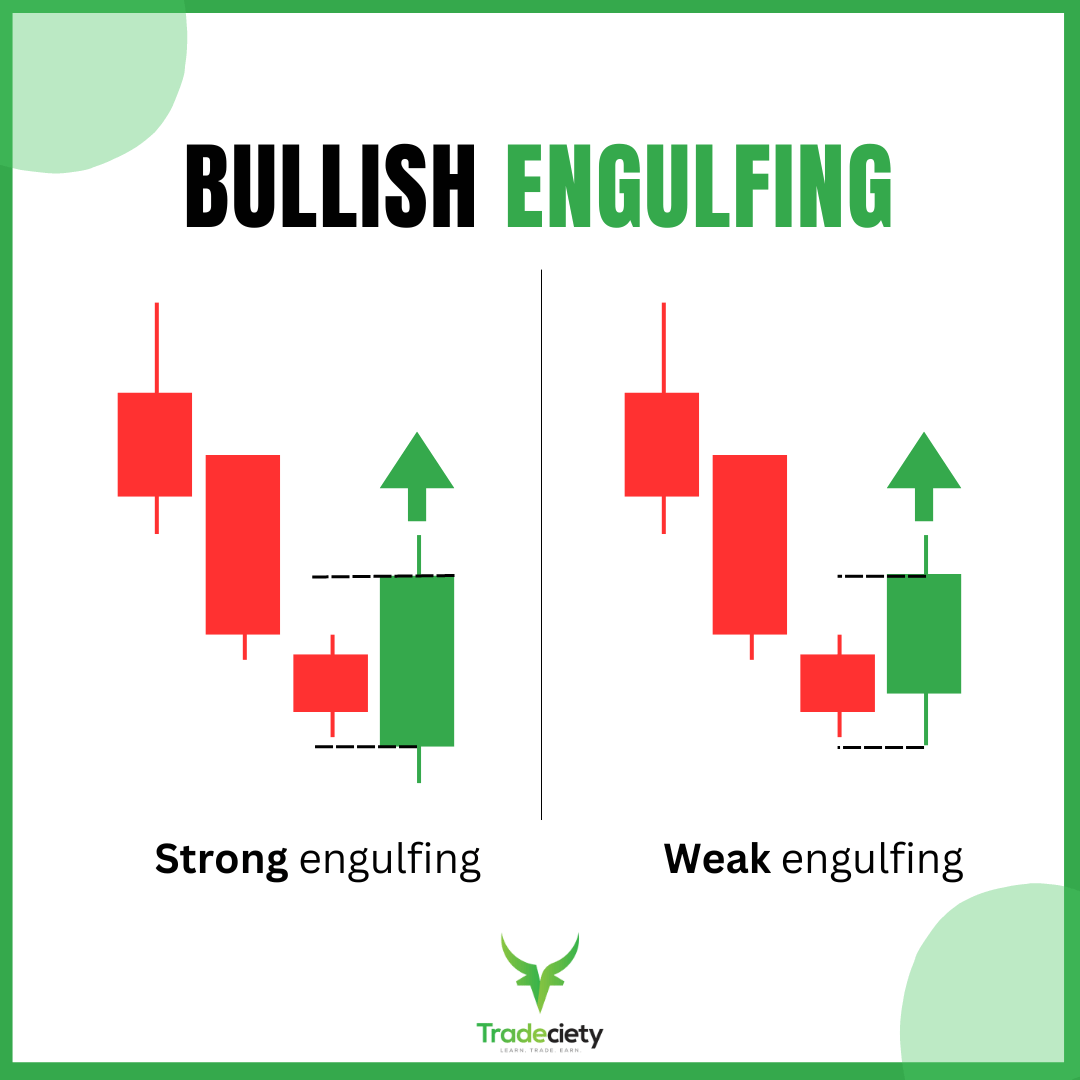
In a bullish engulfing pattern (BE+), the price action forms a large bullish candle where both the high is higher, and the low is lower than the previous candle, indicating strong buying pressure and a potential upward trend reversal.
The most reliable engulfing patterns occur when the entire body of the current candlestick engulfs the previous candle's range. However, weaker versions can also form when only the wick range (the high and low) engulfs the previous candle, without the bodies overlapping fully. These patterns may still indicate potential reversals, but their signals are generally less strong.
A bearish engulfing candle (BE-) forms when a large bearish candle fully engulfs the body of the previous bullish candle, signaling a potential downward reversal. In this pattern, the bearish candle opens higher and closes lower than the previous candle, with both the high and low extending beyond the previous candle's range. This indicates strong selling pressure, often seen at the top of an uptrend, suggesting that sellers are gaining control and a price decline may follow.
The screenshot below shows good examples of both a bullish and bearish engulfing candlestick.
As suggested above, it is not necessary for the engulfing candle to engulf the whole range (wicks) of the previous candle, as the bullish engulfing candlestick shows in the screenshot below – but if it does, the pattern quality is much higher.
.png)
First, let’s think about the quality of the pattern:
These are the 3 main quality criteria of the bar itself which are essential.
But even more important is context. Ask yourself the following questions when assessing the context of your pattern:
Those are important questions to answer before engaging in a trade.
Look at the chart below and you can see two engulfing candles. For additional information, I have also added a Bollinger Band indicator with standard settings (20 SMA, 2 StdDev).
The BE- is at the top of the Bollinger Band (BB) and the BE+ is at the bottom of the BB. Which signal is the better trade? For that, we need context. Let’s zoom out.
.png)
Looking at the bigger picture, you can see that the BE- formed against the long-term bullish trend and not at a key level on our chart, whereas the BE+ was printed at a key flip zone level on our chart, plus it was with the uptrend – during a correction trend wave. The price was also nicely extended (at the bottom of the BB), so taking a long trade here would be considered a bullish trend-following trade.
.png)
Typically, most traders go long at the break of the high of the BE+ or the low of the BE-, with a stop loss order on the other side of the bar.
A typical take profit target for this strategy would be the middle of the BB, the other side of the BB, at 2:1 or 3:1, or a combination of these with partial profits, or even a trailing stop.
It is up to you as trade management is highly personal. Let’s take a look at another example.
You can trade this pattern on all timeframes, but the most reliable signals are found on the higher timeframes such as the Daily and the Weekly timeframe. More experienced trades may also look for engulfing patterns on intraday timeframes, but the signals there are not going to work as often and require more experience.
We are on quite an exotic pair here, the USDSEK but the same principles apply here and you can trade the engulfing candlestick pattern on all markets.
The BE- pattern formed at a key level on the chart, at the extreme of the BB, and as a reversal trade, against the longer-term uptrend.
Trading against the long-term trend can also be a profitable strategy, but you need to make sure that (1) you find enough context (here the key level plus BB), and (2) your targets are not too far away, since reversal price movements typically do not last as long as trend-continuation moves.
The BE+ pattern then occurred at the low of the BB and into the direction of the long-term bullish trend.
.png)
And on this USDCAD daily chart, you can see my favorite variation of the engulfing candle: one with a strong wick to the opposing side of our trade.
This suggests that the price pushed up initially, and then was strongly reversed until the day closed strongly bearish.
Again, this is a reversal trade but look how the price melted from the key levels and the top of the BB. A nice trade with a lot of context supporting the trade idea.
.png)
Finally – some food for thought for your further research with a more aggressive approach to trading engulfing candlestick patterns:
Not all pullbacks will go all the way to the opposite side of the BB. In strongly trending markets, often you can see price only pulling back to the middle BB, which is just the SMA 20, and then reversing into the trend direction from there.
In the screenshot below, the stock was in an overall bullish trending environment and the bearish correction wave pullbacks were shallow and never reached the lower BB. The price formed two BE+ patterns right at the 20 simple moving average (middle BB) during the corrections. Those patterns were ideal trend continuation signals.
Looking for engulfing bars in these areas can yield some nice profits as well, but this only works in strong trending markets. I recommend weekly charts on stocks for this approach, as Forex will not be in a strongly trending condition very often.
.png)
And that is it for this strategy. Can trading be this simple? Yes, of course it can. Simple scales, fancy fails. Have fun testing this approach and pay close attention to the quality criteria: size, close, location, and context!
external link:


We have been trading supply and demand strategies for over ten years, and they have stood the test of time remarkably well. Supply and demand is...

3 min read
Choosing the right trading journal is essential for traders wanting to analyze performance, refine strategies, and improve consistency. In this...

3 min read
“95% of all traders fail” is the most commonly used trading related statistic around the internet. But no research paper exists that proves this...