Supply and Demand Trading in 2026
We have been trading supply and demand strategies for over ten years, and they have stood the test of time remarkably well. Supply and demand is...

Learning how to trade pullbacks can be a great skill as a trader. Pullbacks happen all the time and if you learn how to trade pullbacks, you can enhance your repertoire and find many more high probability trading scenarios. Pullbacks come in many different forms and in this article, I explain the five most common ones. You will also learn different pullback entry techniques.
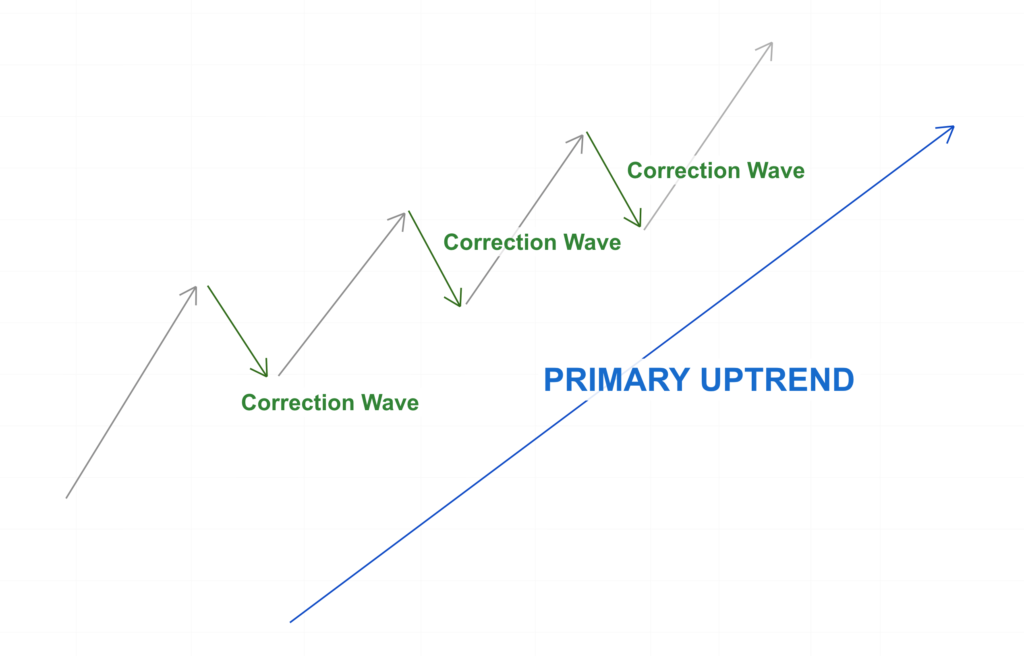
The price never just follows a straight line and the price movements on any financial market can usually be described in so-called price waves. The markets alternate between bullish (rising) and bearish (falling) trend waves.
During an uptrend, as shown in the graphic below, the dominant trend waves moved higher. The correction waves represent moves against the ongoing trend direction. When trading pullbacks, traders look for those correction phases and then time trade entries during such phases.
The idea is that you want to wait for the price to “pull back” during a trend to provide you with a better entry price. When the market is moving higher and you anticipate that the move will continue, you want to enter a trade for the lowest price possible. Pullbacks help you find such opportunities.
Breakout pullbacks are very common and probably the majority of traders have already encountered them. Breakout pullbacks commonly happen at market turning points, when the price breakout of a consolidation pattern. Head and Shoulders, wedges, triangles, or rectangles are the most popular consolidation patterns.
I always caution my students that moving a stop loss to break even is a very dangerous and unprofitable thing to do. And the reason is that breakout pullbacks just happen so often.
In the scenario below, the price entered a triple top after a long uptrend. The triple top had a very well-defined lower support level. Many traders use such levels to time their breakout entries. But where they go wrong is that they move their stop loss to break even too soon. And when the breakout pullback happens, they will get kicked out of their trade. Just to see price return into their anticipated direction – but without them.
This is such a common pullback scenario that you will start noticing it all the time.
So the question that naturally comes up is how do you trade pullbacks? And although there are many ways how you could approach pullback trading, I will introduce the two main concepts of pullback trading. Those principles can then be applied to all other pullback scenarios in this article.
The aggressive trader waits for the price to come back to the pullback area and enters a trade right away here. Point 1 marks this approach in the scenario below. There are a few points you need to consider when choosing such an approach:
The conservative trader waits until the price continues the trend structure and breaks into a new low. The conservative entry happens right when the price makes a new lower low. With this approach, the trader goes with the momentum. The conservative entry happens later and, therefore, the potential reward/risk ratio is also smaller.
There is no right or wrong. It comes down to the personal preferences of the trader.
Notice that in this example, the price would have come back into the pullback area once again. This shows how common pullbacks are because they highlight the natural price wave structure in any financial market.
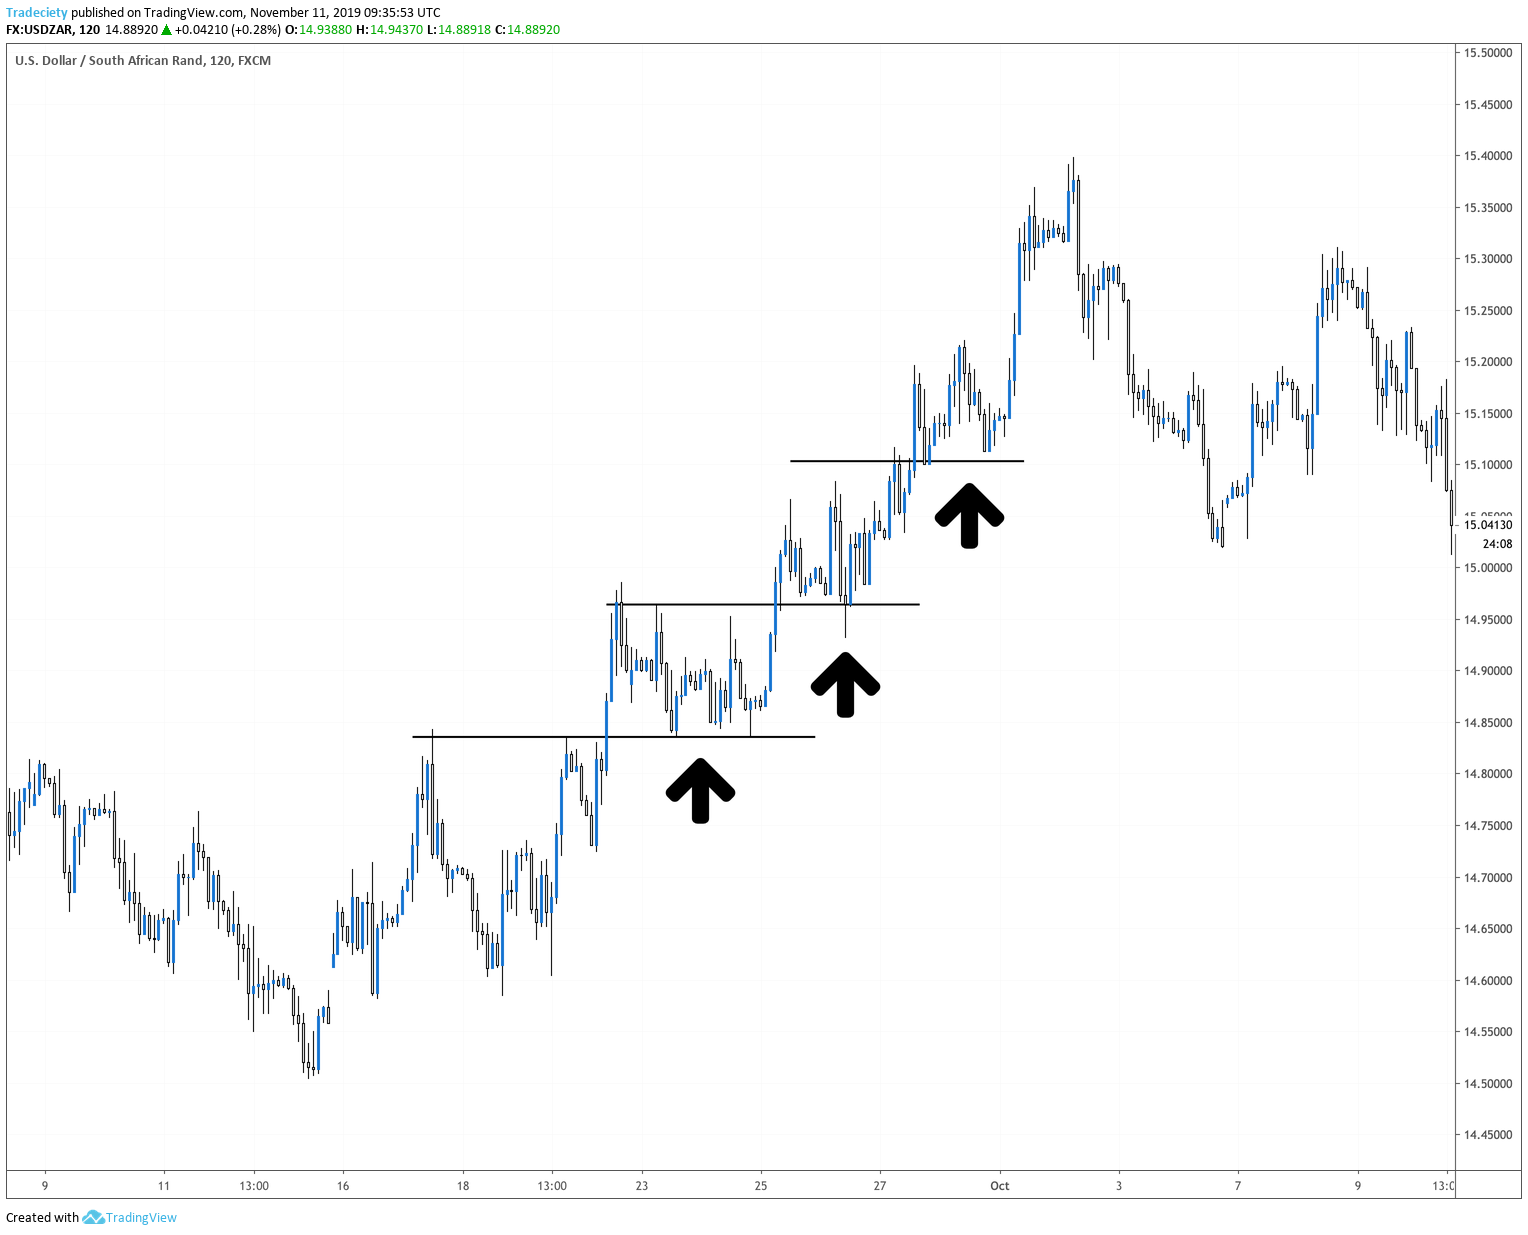
The stepping behavior can be observed during many trending phased across all financial markets. It is the natural rhythm of price and demonstrates the ebb and flow of market behavior.
During ongoing trending phases, the price will often present those stepping patterns. This pullback approach is a great addition to the previously discussed breakout pullback. The breakout pullback happens very close to market turning points. But if a trader misses the initial entry opportunity, the horizontal steps can allow the trader to find alternative entry scenarios as the trade progresses.
Furthermore, a trader could also choose to use the stepping pattern to pull the stop loss behind the trend in a safer way. In this case, the trader waits until the price has completed a step and then pull the stop loss behind the last pullback area. The stop loss is then safely protected and not as vulnerable.
Trendlines are another famous pullback tool. The drawback is that trendlines often take longer to be validated. As we have seen in our trendline guide, a trendline requires 3 contact points to get validated. You can always connect 2 random points, but only when you get the third, you are really looking at a trendline.
Therefore, the trendline pullback can only be traded at the third, fourth or fifth contact point.
Trendlines can work nicely in addition to other pullback methods, but as a standalone method, the trader may miss many opportunities when the trendline validation takes a long time.
Without a doubt, moving averages are among the most popular tools in technical analysis and they are used in many ways. And you can also use them for pullback trading as well.
You could use a 20, 50 or even a 100-period moving average. It doesn’t really matter and it comes down to whether you are a short-term or long-term trader. Shorter-term traders generally use shorter moving averages to get signals quicker. Of course, shorter moving averagers are also more vulnerable to noise and wrong signals. Longer-term moving averages, on the other hand, move slower, are less vulnerable to noise but also may miss trading opportunities in the short-term. You have to weigh the pros and cons for your own trading.
In the screenshot below, I used a 50-period EMA and the price showed 2 pullbacks during the downtrend. It is very common for the price to overshoot the moving average and show very deep pullbacks. That is why you need to give your stop loss more breathing room if you choose such a pullback strategy.
I am fascinated by how well the Fibonacci levels work in financial markets and we can use this phenomenon as pullback traders as well. For that, you wait for a new emerging trend and then draw your A-B Fibonacci tool from the trend origin to the end of the trend wave. The C-point in the Fibonacci retracement can then be used for pullbacks.
In the screenshot below, you can see how the new trend pulled back very precisely to the 50% Fibonacci retracement before resuming the uptrend.
Fibonacci pullbacks can be combined with moving averages very effectively and when a Fibonacci retracement falls into the same place with a moving average, those can be high probability pullback areas.
As you have seen, there are many different ways how to approach pullbacks and you can even combine the various tools to come up with even stronger signals.

We have been trading supply and demand strategies for over ten years, and they have stood the test of time remarkably well. Supply and demand is...

3 min read
Choosing the right trading journal is essential for traders wanting to analyze performance, refine strategies, and improve consistency. In this...

3 min read
“95% of all traders fail” is the most commonly used trading related statistic around the internet. But no research paper exists that proves this...