
Supply and Demand Trading in 2026
We have been trading supply and demand strategies for over ten years, and they have stood the test of time remarkably well. Supply and demand is...
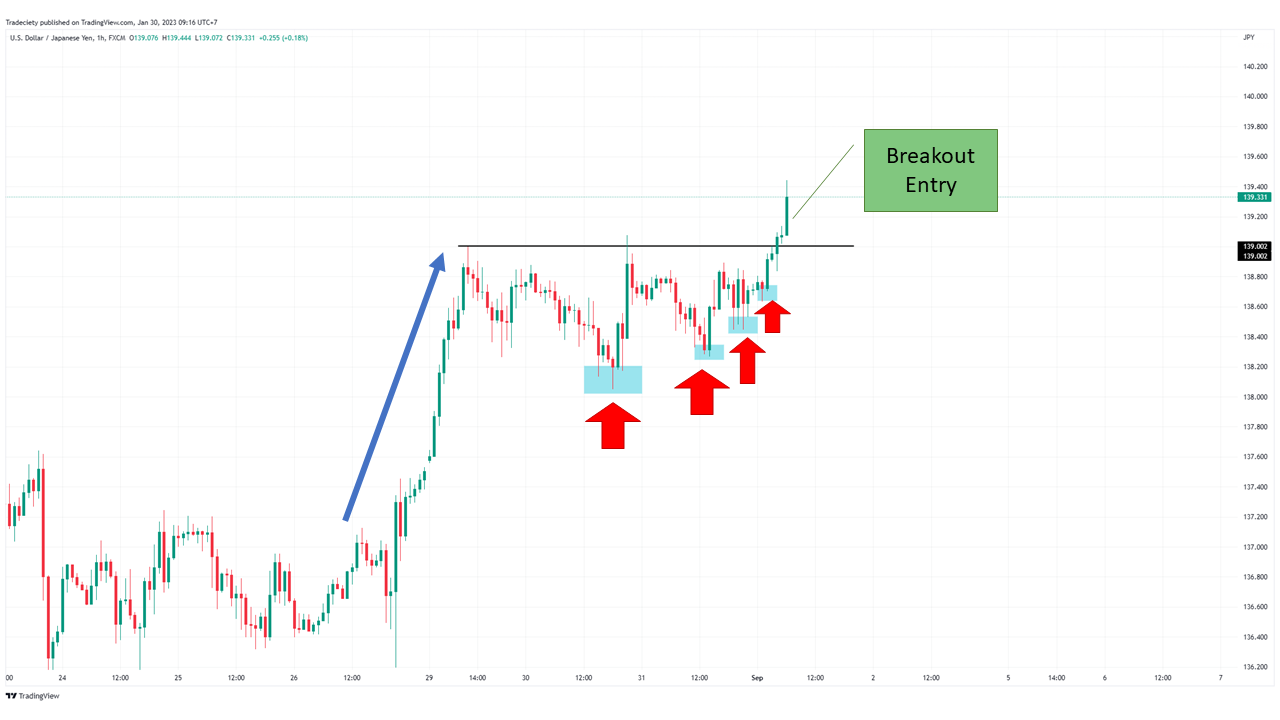
Chart patterns offer great trading opportunities because they provide objective and recurring price events that can be studied in great detail.
The 9 Forex chart patterns discussed in this article are both trend-following and also trend-reversal patterns. Thus, you can apply them across different market conditions. Also, chart patterns can be traded on different timeframes. You can find the same chart patterns on the 1-minute, the 60-minute, the Daily, or even on the Weekly timeframe.
In this article, we will look behind the most commonly traded chart patterns to gain an understanding of what is really going on behind the scenes. A deep understanding of chart patterns allows traders to apply their knowledge to all kinds of chart situations and, therefore, improve their understanding of price action in general.
The Cup and Handle is a great complex breakout pattern that can be traded as a trend-following chart pattern.
The screenshot below shows a classic Cup and Handle Forex chart pattern within an ongoing uptrend. During the uptrend, the market traded below the horizontal resistance level.
The key to understanding the Cup and Handle pattern is the reaction around the resistance level and how the price action behavior is changing with each subsequent touch of the resistance:
Although the price seems to be stuck in a sideways period, the price is still exhibiting strong bullish signals.
After the breakout, the bullish trend resumes. Generally, traders wait for a confirmed breakout where the price is fully closing above the resistance level.
It is important to wait for such a breakout since the price can stay within the Cup and Handle pattern for an extended period of time.
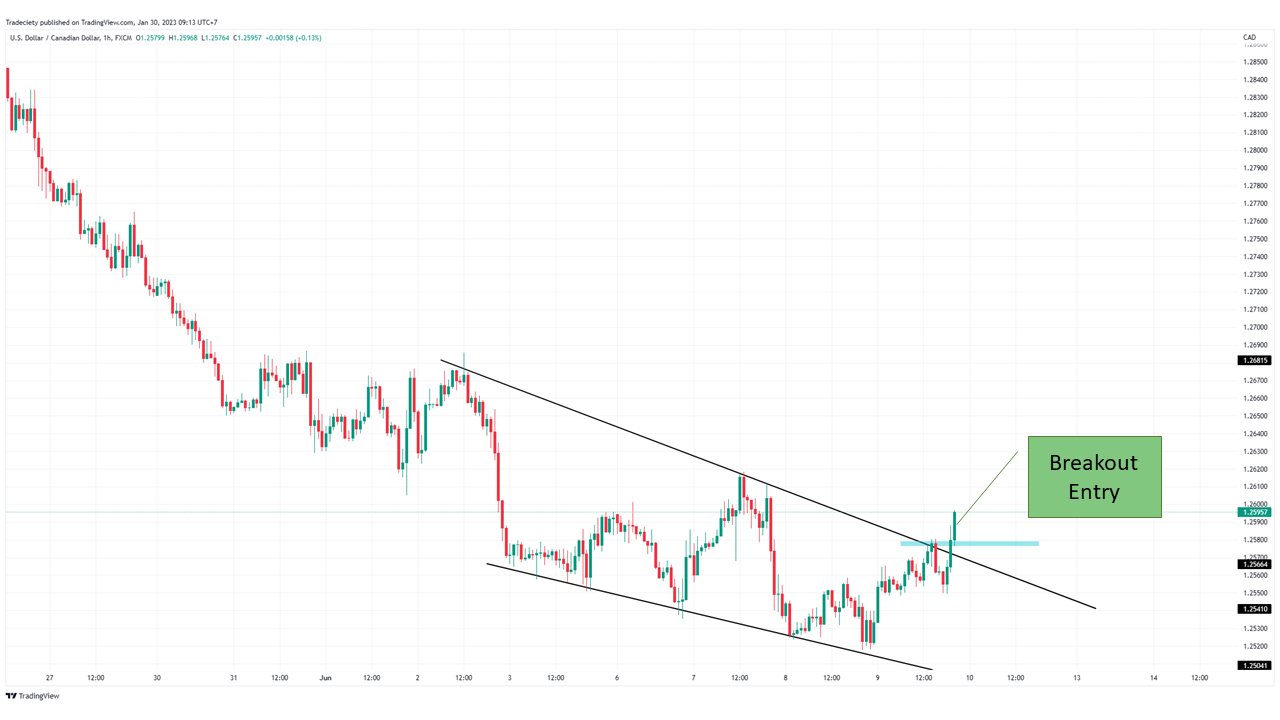
The wedge pattern is considered a trend-ending and reversal Forex chart pattern.
In the screenshot below, the wedge forms during a mature downtrend, after the price has trended lower for a long period. Looking for reversal patterns in mature trends is the recommended approach since mature trends have a higher chance to reverse, compared to new trends that are just getting started.
When connecting the lows of the wedge pattern the fading bearishness is apparent. The lower trendline shows a shallow angle, confirming that the price is not able to push lower as quickly as it used to. This is an important sign of fading bearishness.
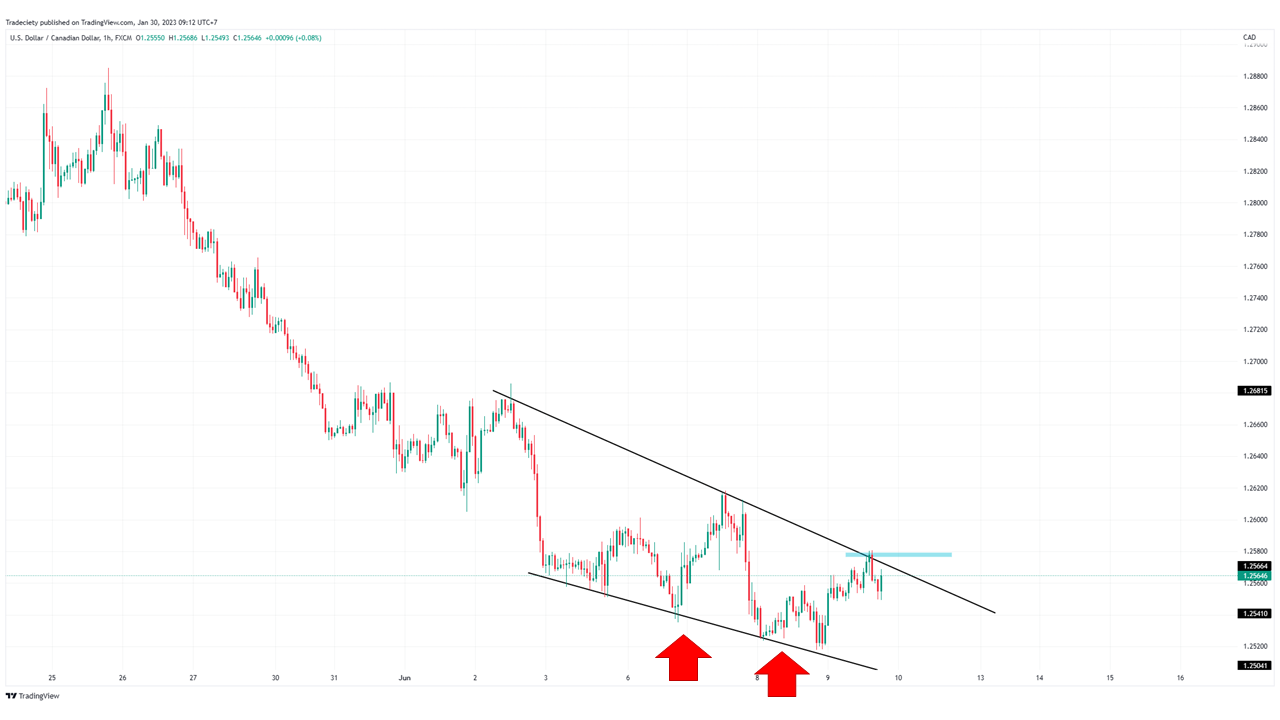
It is important to wait for the price to clear the previous high. Ideally, you want to see a strong momentum breakout that is taking out the last high with ease.
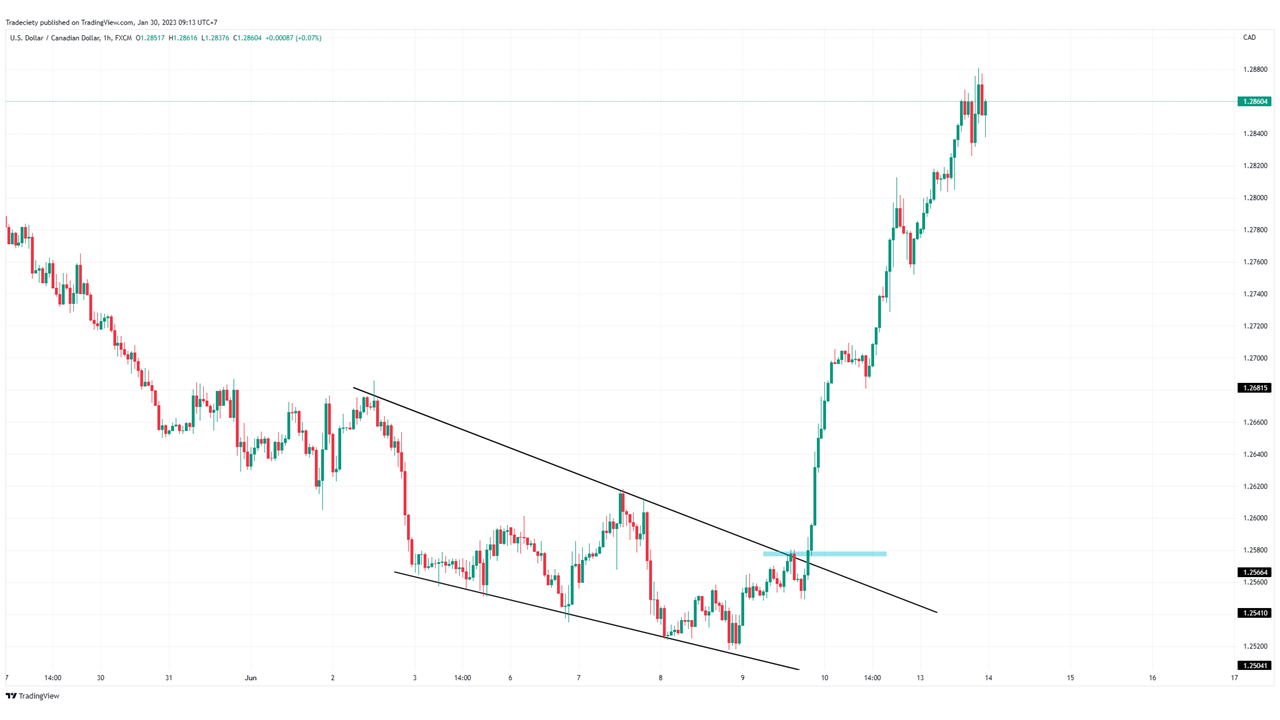
The stronger the breakout and the stronger the pre-breakout bullish sequence, the better the chances of seeing a successful trend reversal to the upside.
The trend reversed strongly into the bullish direction after the breakout. A few price signals foreshadow such a strong release of bullish pressure:
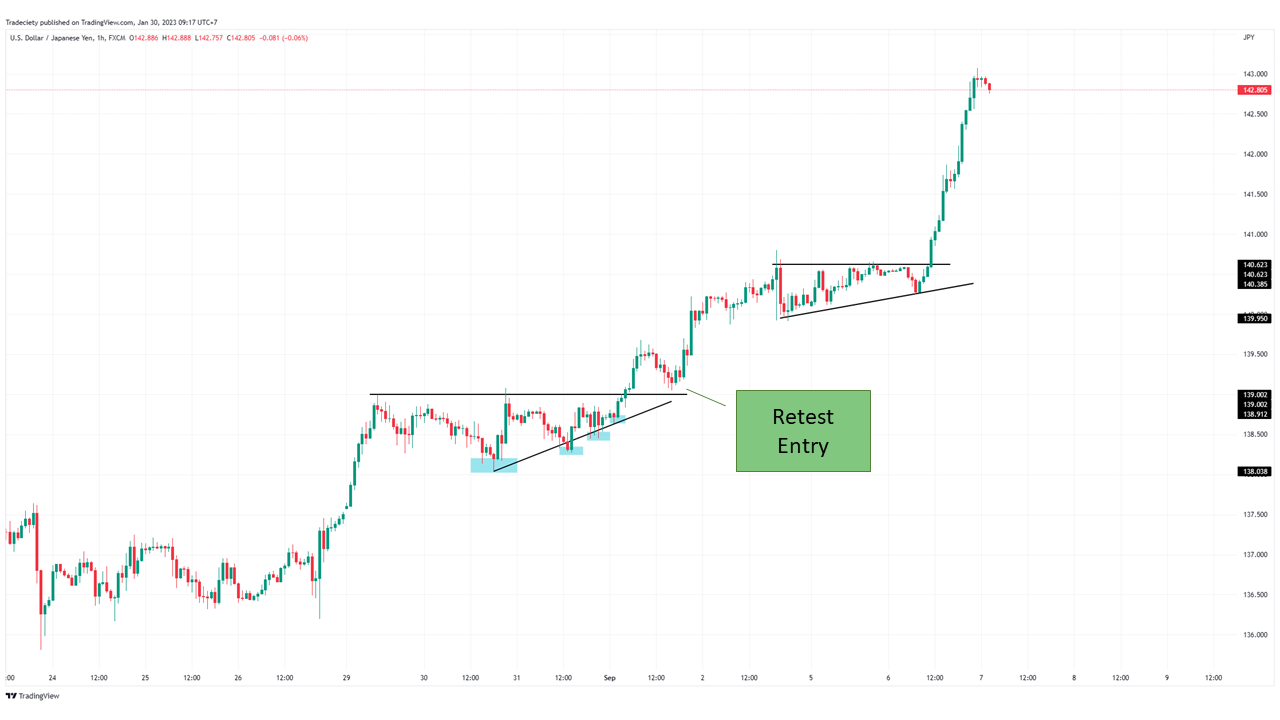
Triangles are multi-purpose Forex chart patterns, but they are best traded as trend-continuation patterns.
In the example below, the market is in an uptrend. The trend is currently pausing and struggling with the horizontal resistance level and the trend was not continued.
The key to a good triangle chart pattern is how the lows are forming. The arrows in the scenario below show that each low is higher than the one before. This confirms that the buyers are buying the dips earlier each time and the sellers are not interested in getting engaged.
This pattern exhibits a lot of pressure building. Although the price is currently not advancing in the trend direction, the buyers seem to be still fully in control.
The final chart situation shows that after the first successful triangle breakout, the market formed a second chart pattern shortly after. The second triangle is much narrower in height which is a strong bullish indicator as well since there seem to be very few sellers and still a lot of buyers, buying the dips.
The following continuation happened with extreme strength which could be the consequence of the narrow triangle range and the strong buyer surplus.
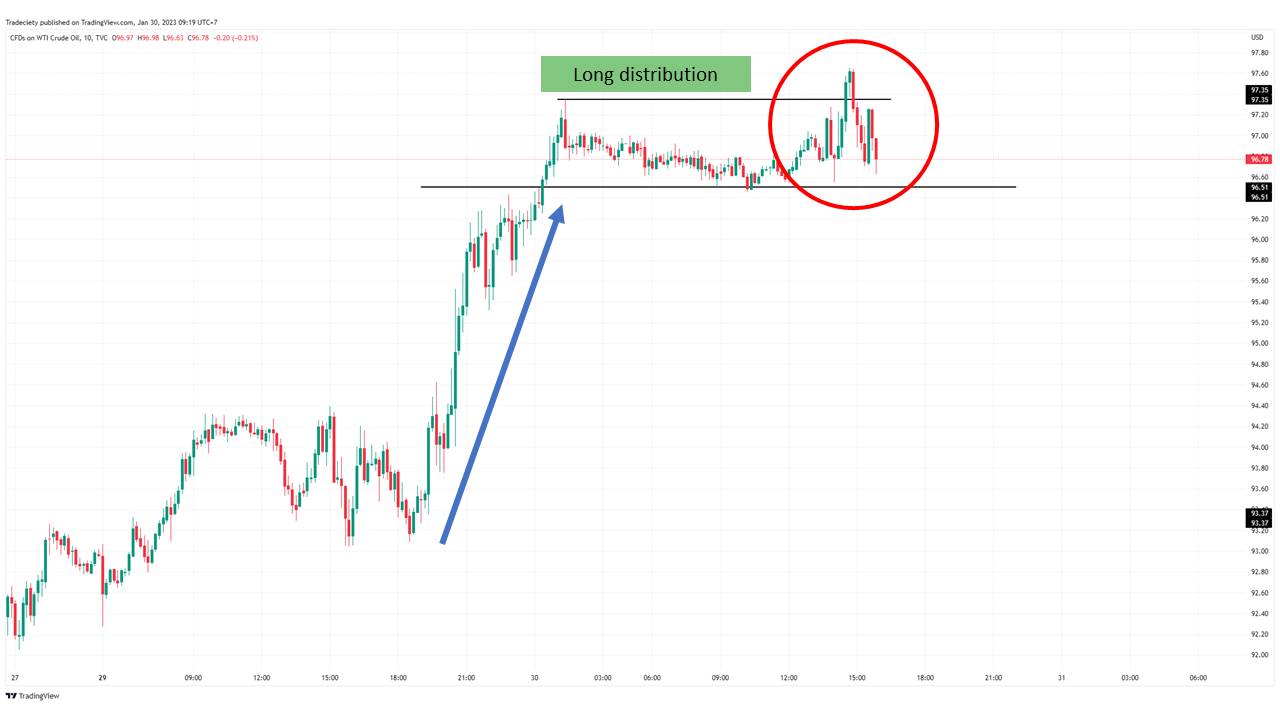
A fakeout is a failed trend continuation pattern that often leads to a complete trend reversal.
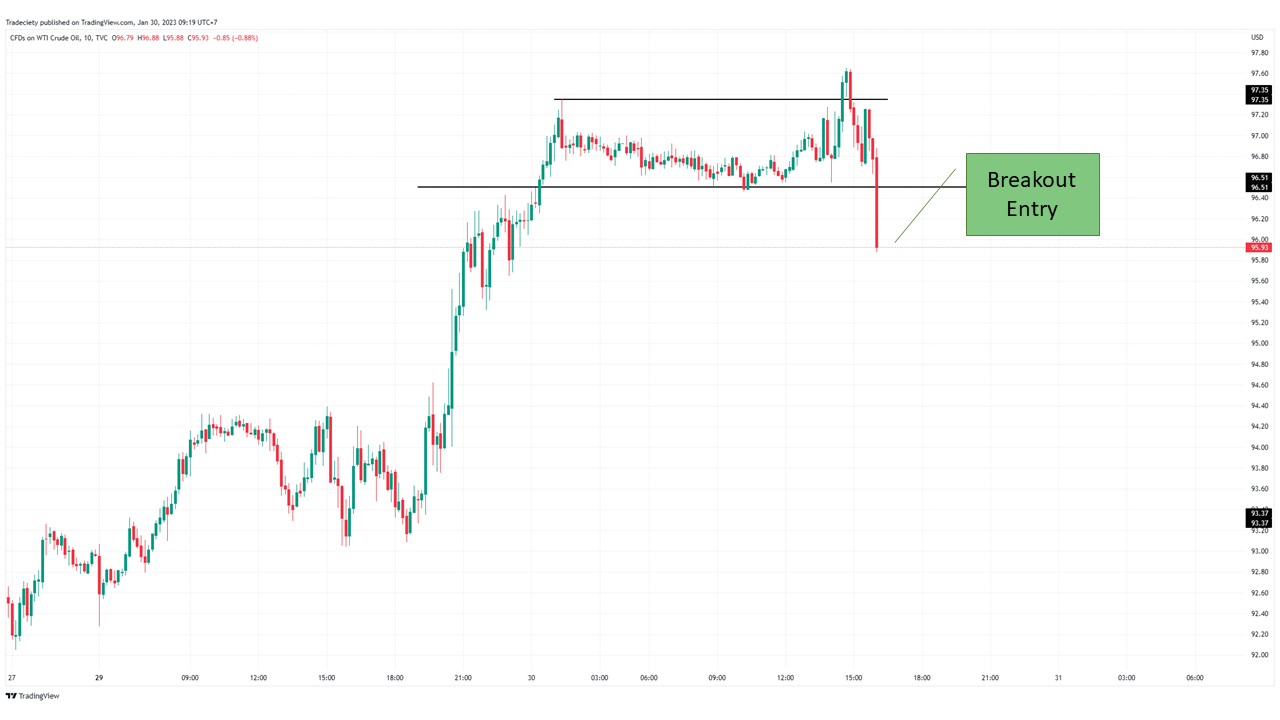
In the screenshot below, the price was initially in an uptrend and then moved into a sideways continuation. The price did break out which could have looked like a trend continuation at the time, but within just two candlesticks, the price traded back inside the pattern and below the resistance.
Also, the volatility development is noteworthy. Around the fakeout, the volatility started increasing and the candles got larger. Whereas it is normal to see an increase in bullish candles during a breakout, larger bearish candles are not something you want to see during a bullish trend continuation breakout.
Some aggressive traders may choose to trade short as soon as the breakout failed. A more conservative entry approach includes waiting for the complete reversal and the breakout into a new low.
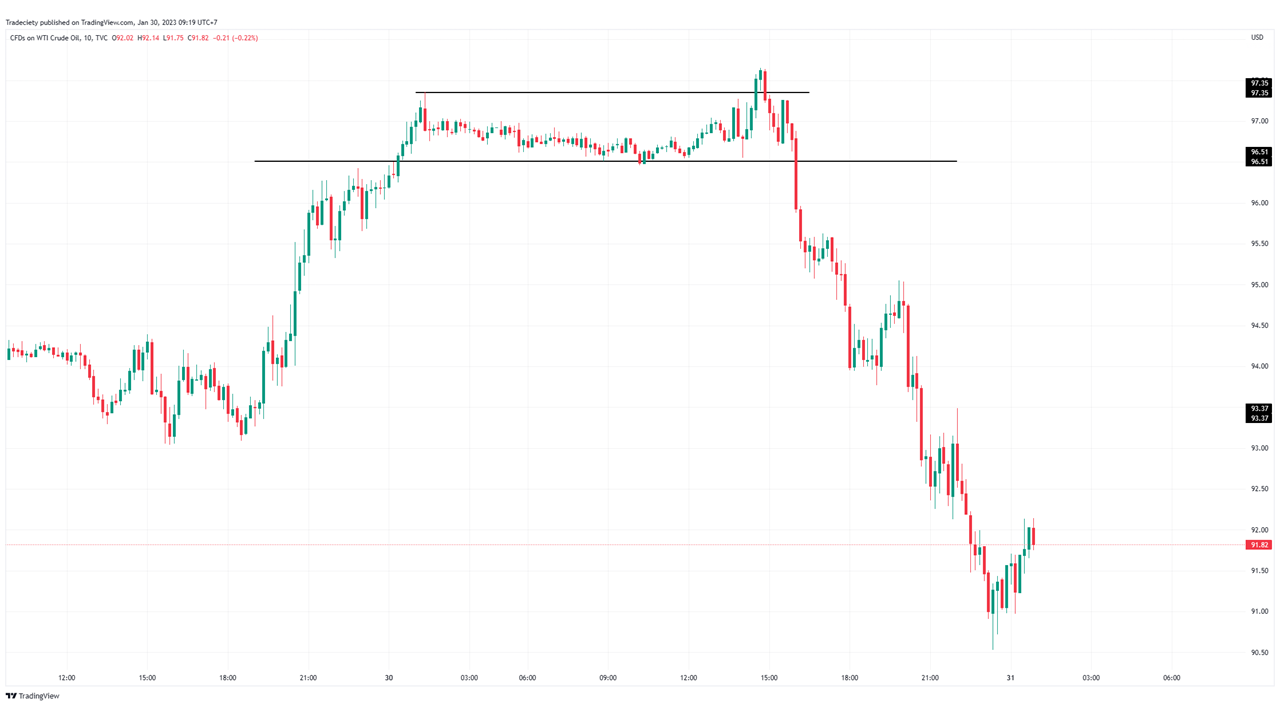
In the screenshot below the price broke out with a high momentum candle. At this point, the situation looks extremely bearish.
Fakeouts are interesting Forex chart patterns and they can often provide trading opportunities with a high reward:risk ratio. However, due to the increase in volatility at the trend peaks, such patterns are often considered advanced trading concepts and may not be as suited for newer traders.
Flags are among the most popular Forex chart patterns and they are exclusively trend-continuation patterns.
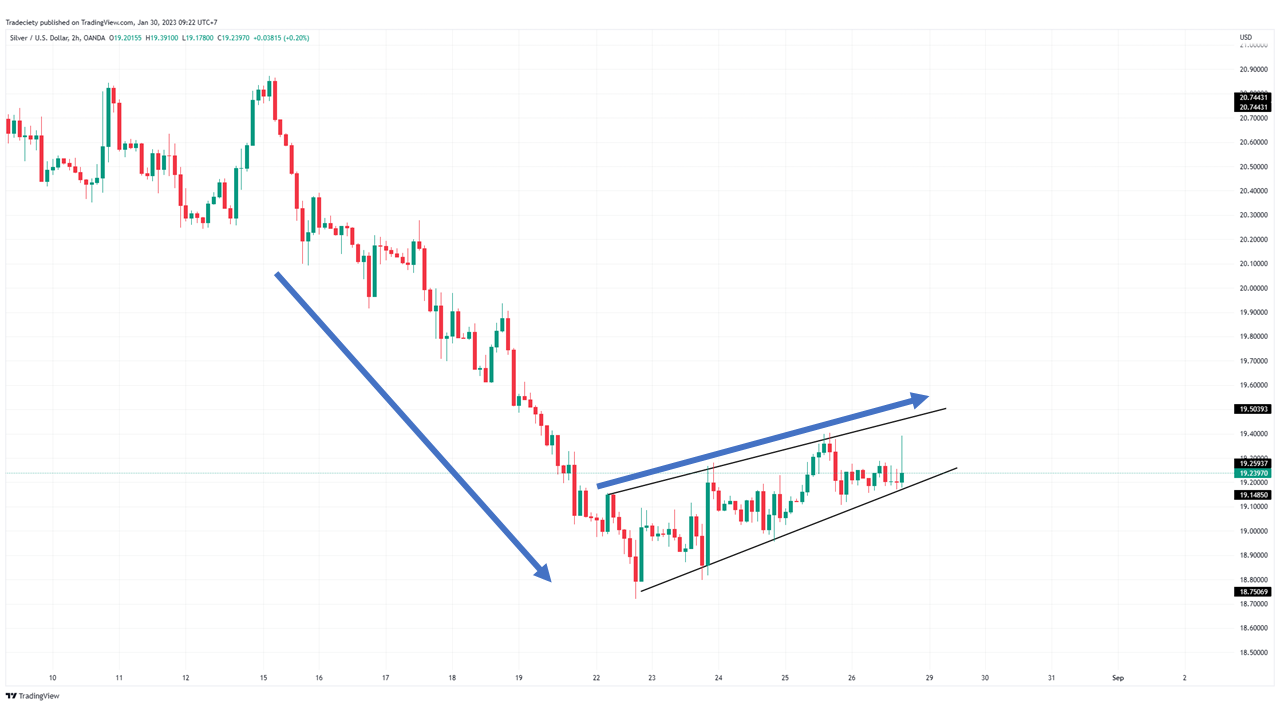
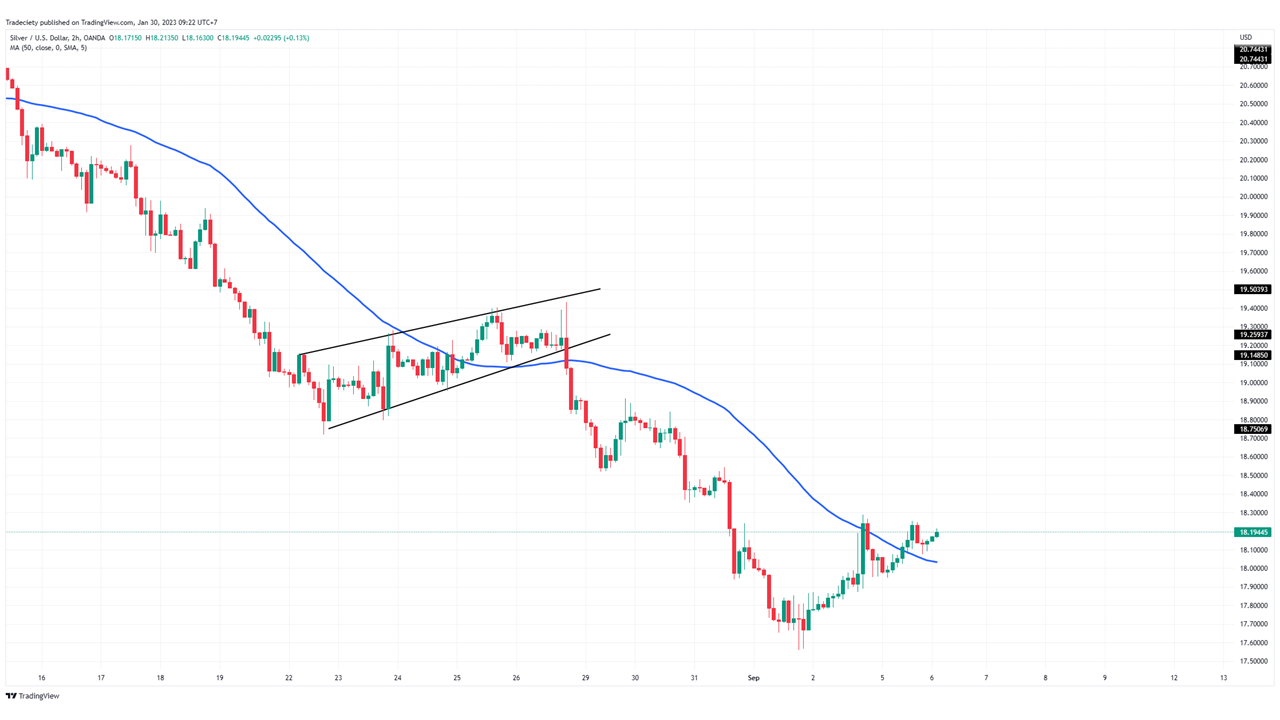
The flag shows a weak corrective phase during an existing trend. In the screenshot below, the trend advanced lower with strong force initially. The bullish corrective phase, however, does not show a lot of strength in the bullish direction. This difference in bearish strength and bullish weakness confirms the overall bearish trend sentiment.
The greater the difference between the two market phases, the higher the likelihood of a successful trend continuation.
For this type of pullback trading, Moving Averages or Pivot Points are an ideal confluence indicator.
During a trending phase, the price will generally stay below the Moving Average without touching it. During a corrective phase, the price will start trading around such a Moving Average or back into a central Pivot.
Thus, we can use these tools for finding corrective phases and for timing trade entries. When the price breakout below the trendline and the Moving Average, the continuation signal is usually given.
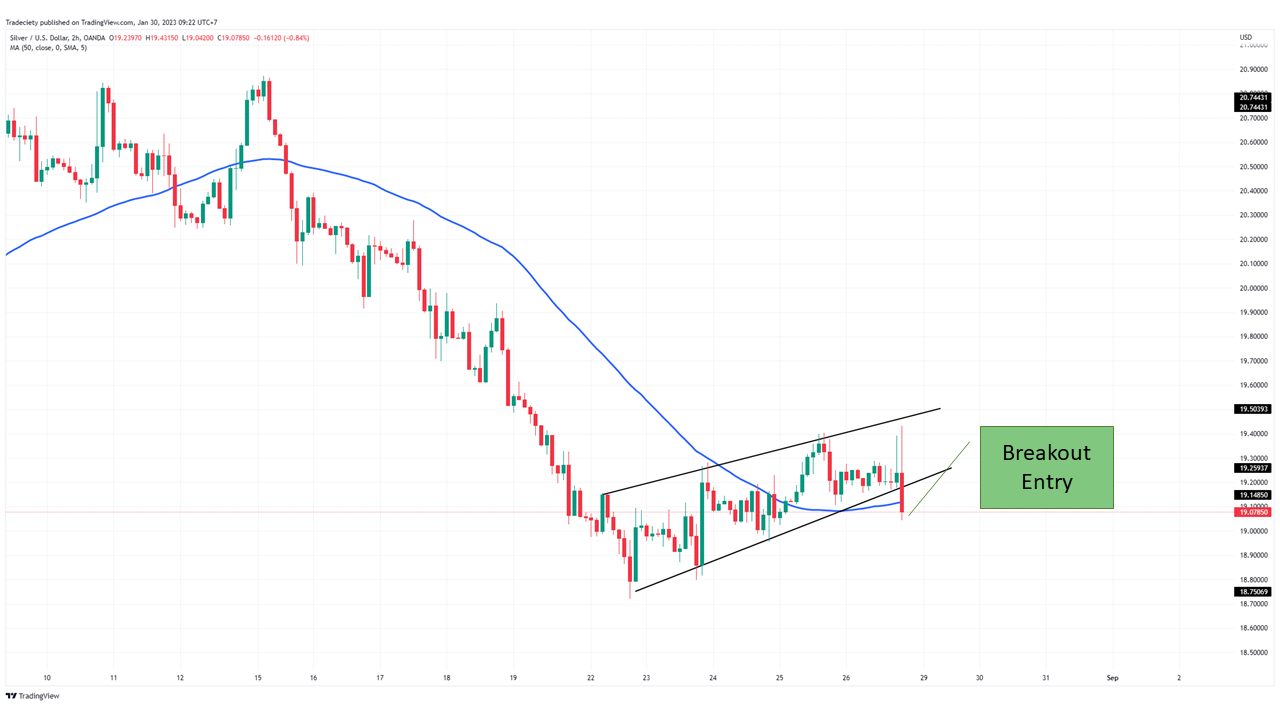
The bearish trend continues after the breakout. The Moving Average helps us to monitor the trend strength. During a healthy and strong downtrend, the price will stay away from the Moving Average. If the price then reaches back to the Moving Average it can signal the next correction or even a reversal, depending on the overall situation and present chart pattern.
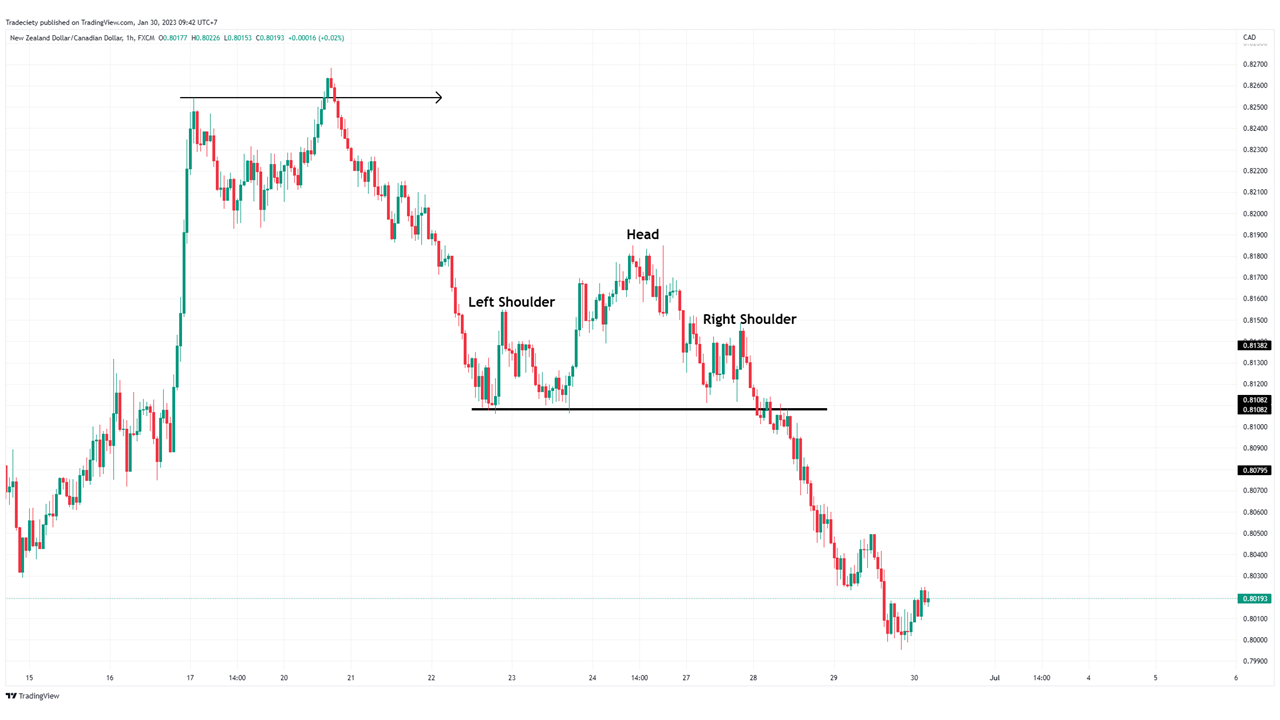
The Head and Shoulders pattern is usually considered a trend exhaustion and trend reversal pattern. However, I also have prepared an example as a trend continuation setup following next.
In the first scenario below, the Head and Shoulders pattern is a trend exhaustion pattern. The market is in a mature uptrend and has been trending higher for an extended period of time.
From the left shoulder to the head, the price made a higher high. However, the distance between the two higher highs is very short and already indicates weakness in the trend.
From the head to the right shoulder, the price is then showing extreme weakness. The price is not able to make a higher high and the price is trading sideways for an extended period of time. Those are not signals that indicate a high likelihood for a bullish trend continuation.
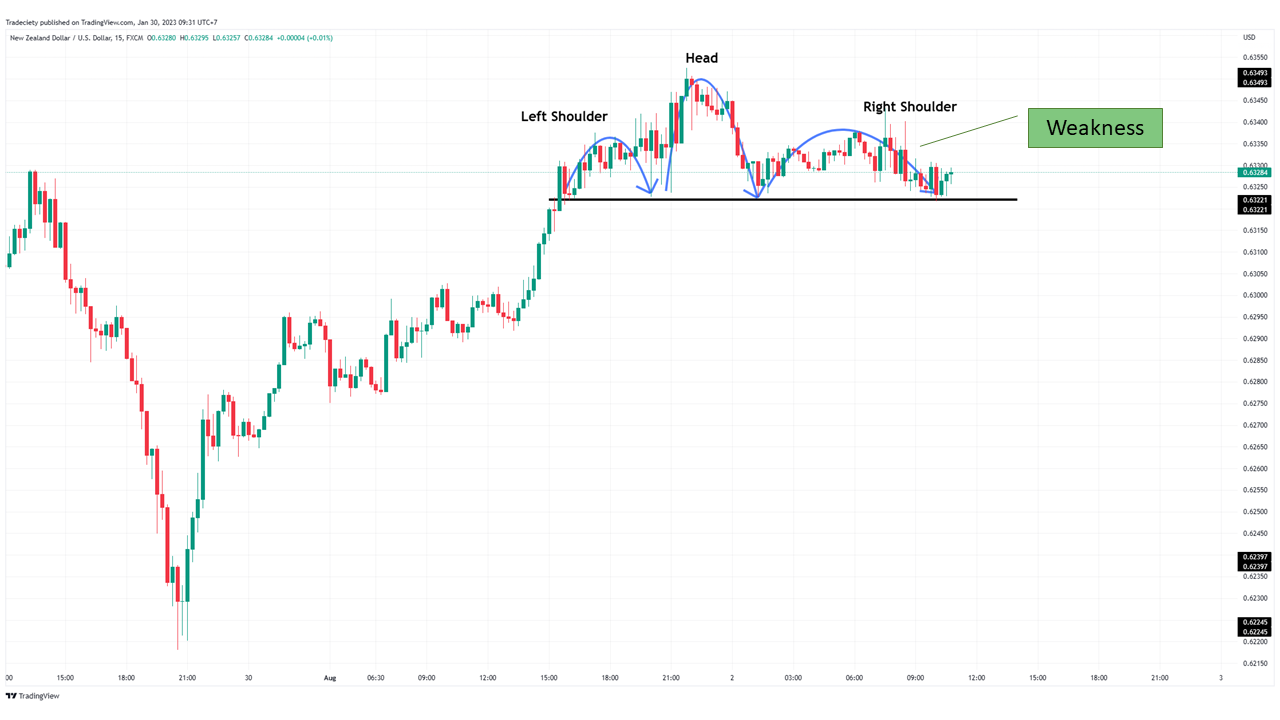
After a long right shoulder and weakness in the head part, the price exploded lower. Long topping periods often lead to strong trend reversals.
The Head and Shoulders pattern in the example below is a trend continuation Forex chart pattern. After the fakeout trend reversal at the top, the price started a new downtrend before pausing in the Head and Shoulders pattern.
It first seemed as if the price was ready to reverse higher when the price made a higher high from the left shoulder to the head. However, the bears took over afterward and all the bullish pressure faded when the right shoulder formed well below the head. The large distance between the head and the right shoulder is a strong bearish signal.
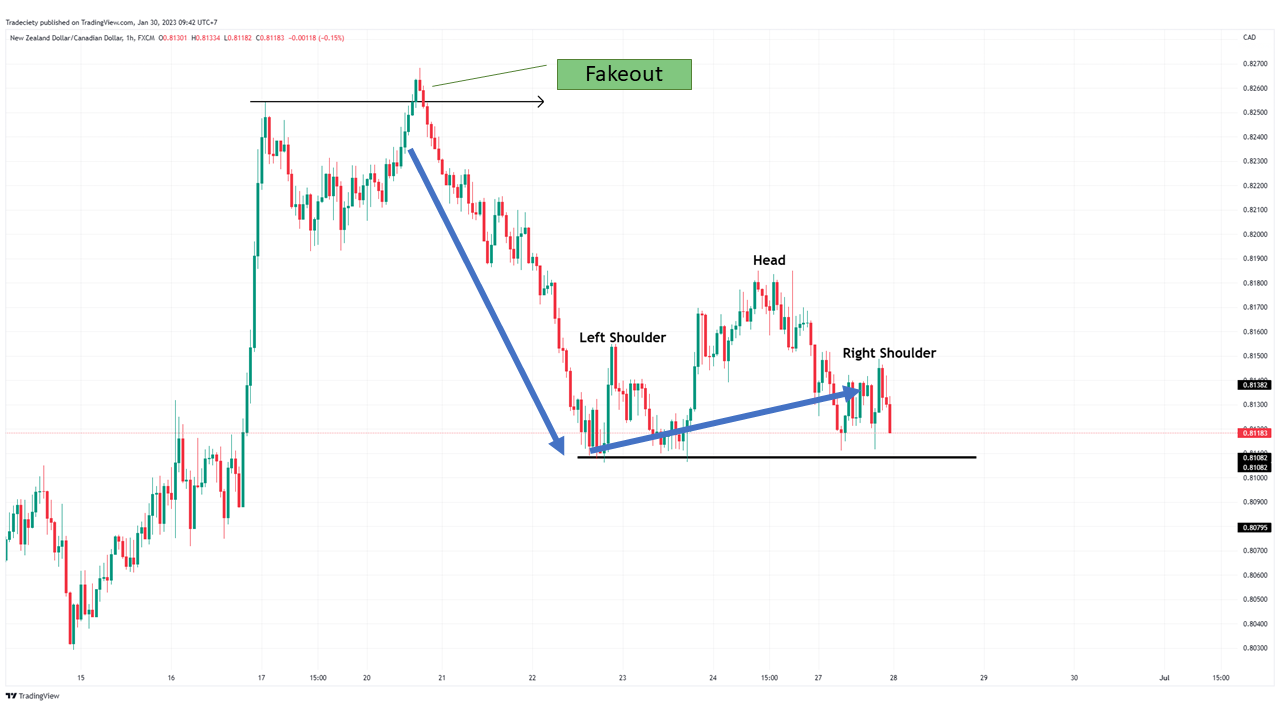
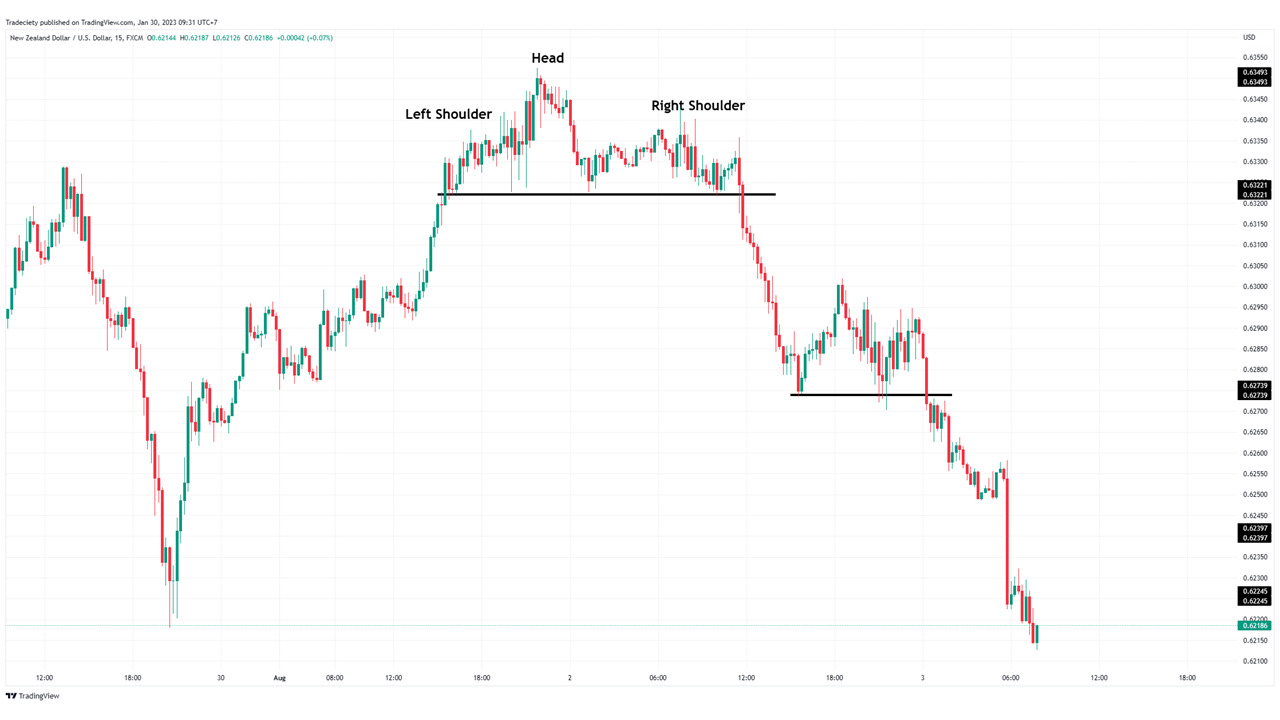
The trend continued lower after the price broke the support neckline.
When you are just getting started with the Head and Shoulders pattern I would recommend focusing on horizontal breakout patterns first. Many traders also trade diagonal neckline patterns. However, trendlines are more subjective and not as easy to trade.
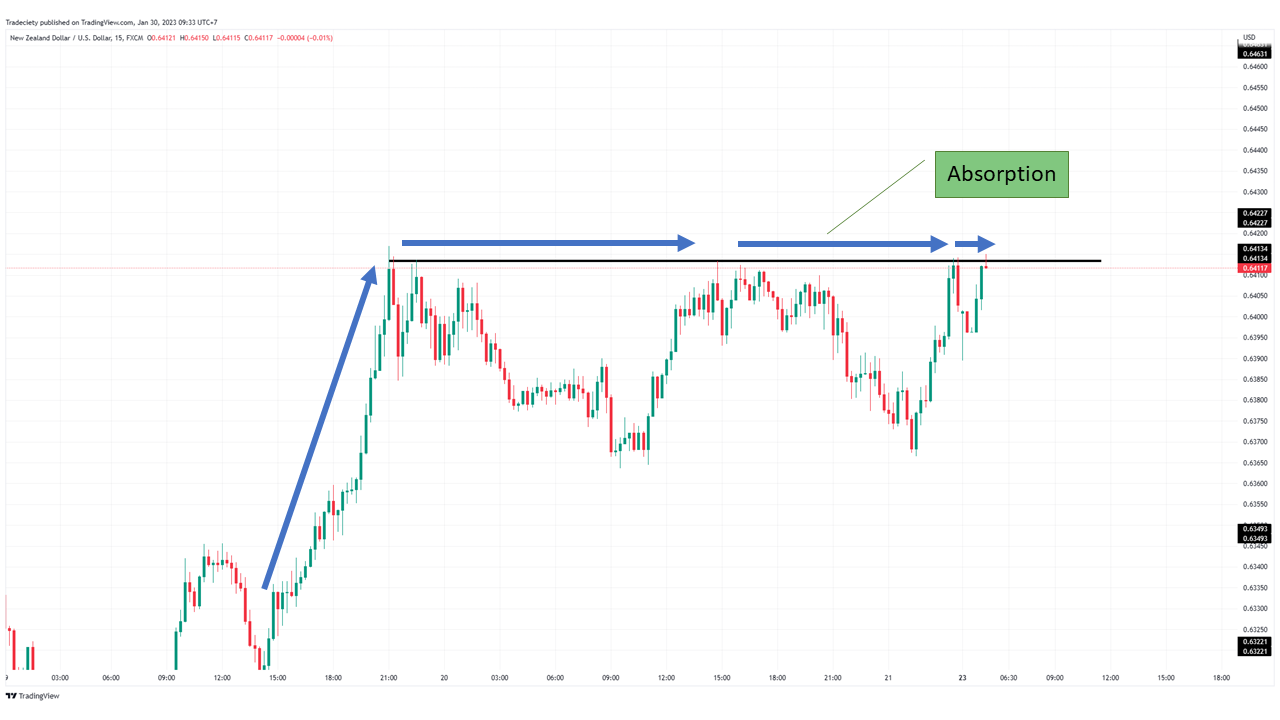
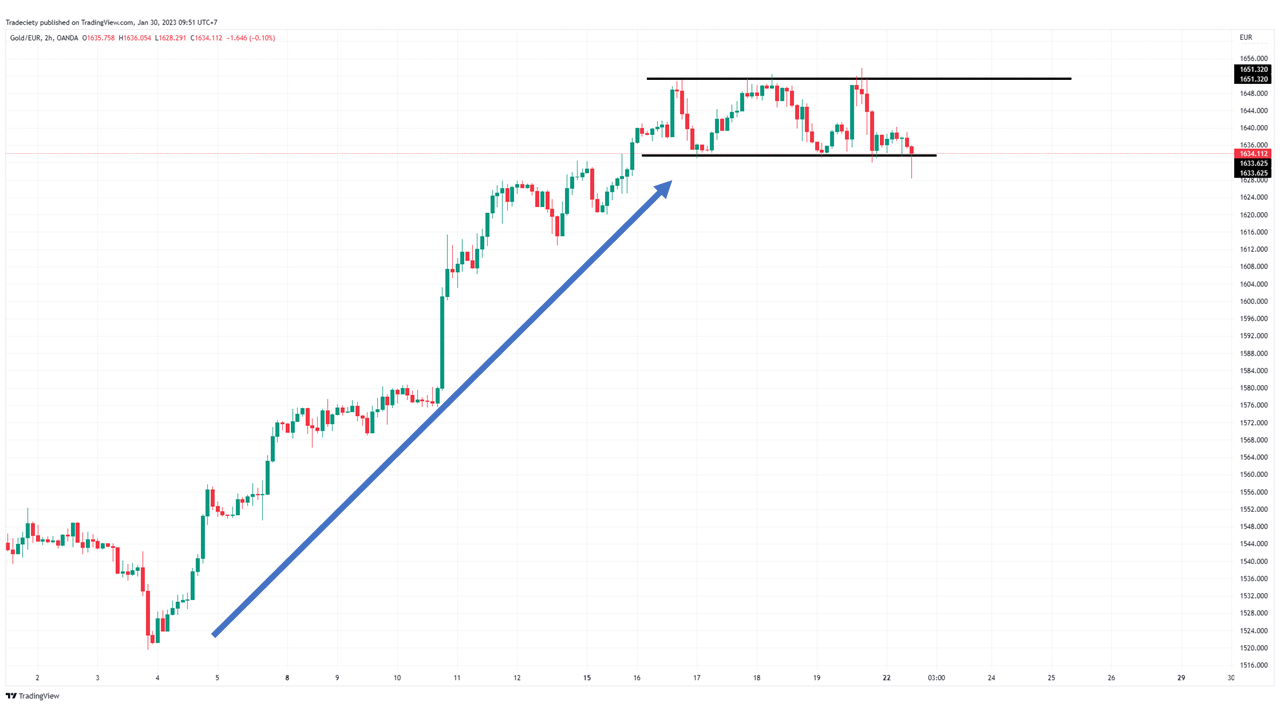
Although the triple top is a straightforward chart pattern, I wanted to include some additional chart pattern trading tips with this example.
As the name suggests, the pattern consists of three peaks that are equally high. The price put in a strong resistance level.
Ideally, you also want to look for a triple top within a strong uptrend only. As mentioned previously, the longer that a trend has been going on, the higher the chances of seeing a successful reversal if all other conditions are met too.
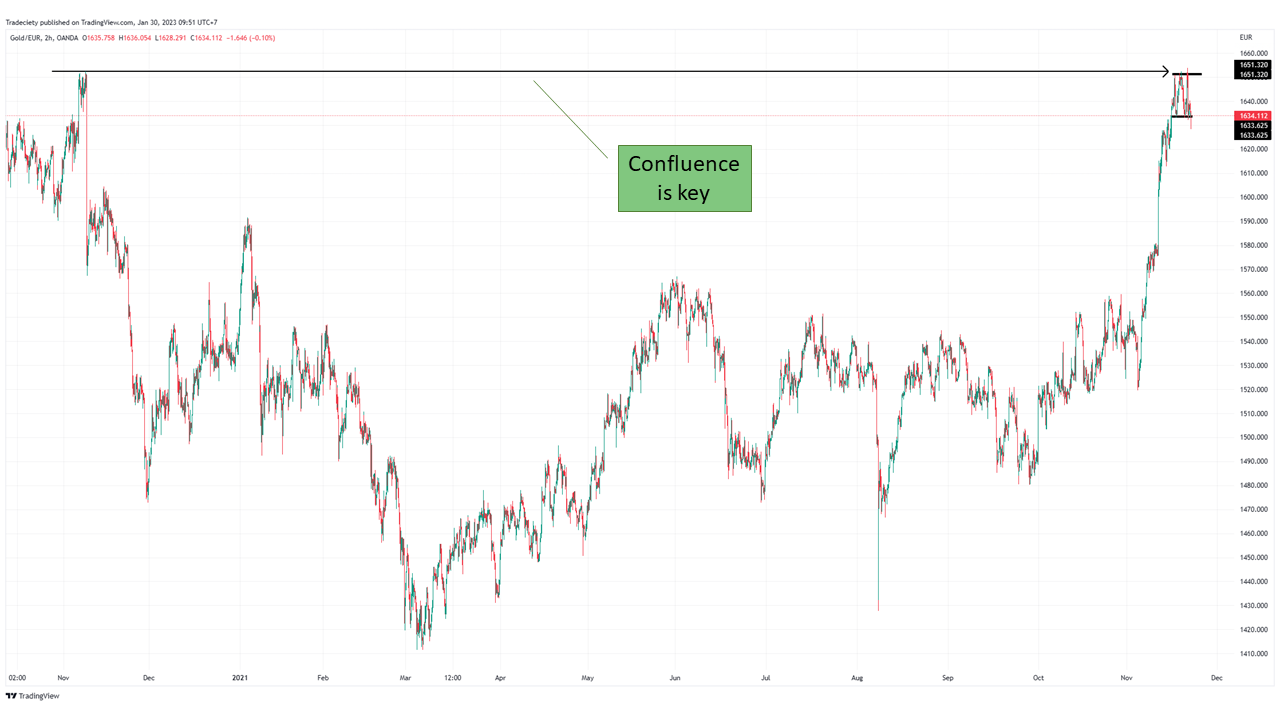
One principle that may improve all of your trades is to filter your potential setups and entry opportunities based on the overall chart location. For such an approach, you start on the higher timeframe and you mark all important support and resistance levels. Then, you wait for the price to get back to such an important level and you look for your general trading signals.
In the screenshot below, the triple top forms right at a previous major resistance area. This level has led to a strong price reaction in the past and, therefore, the likelihood of another reaction may be higher there. Especially if the context is right.
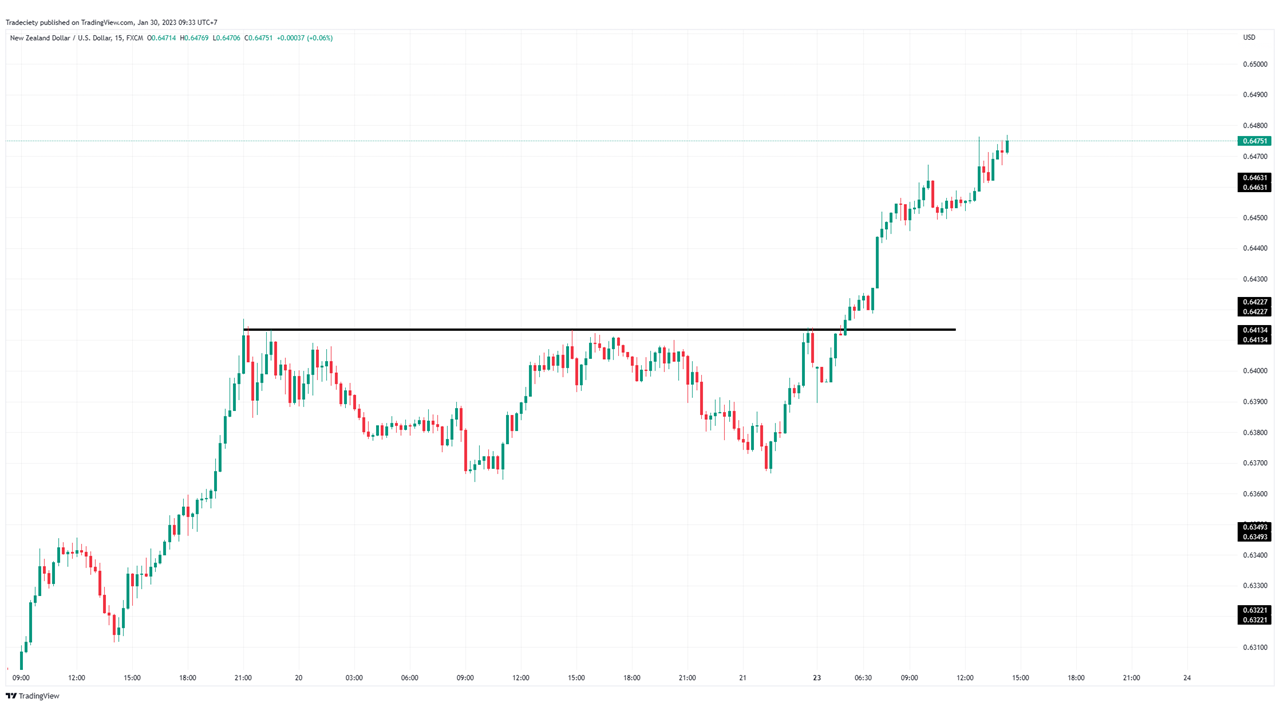
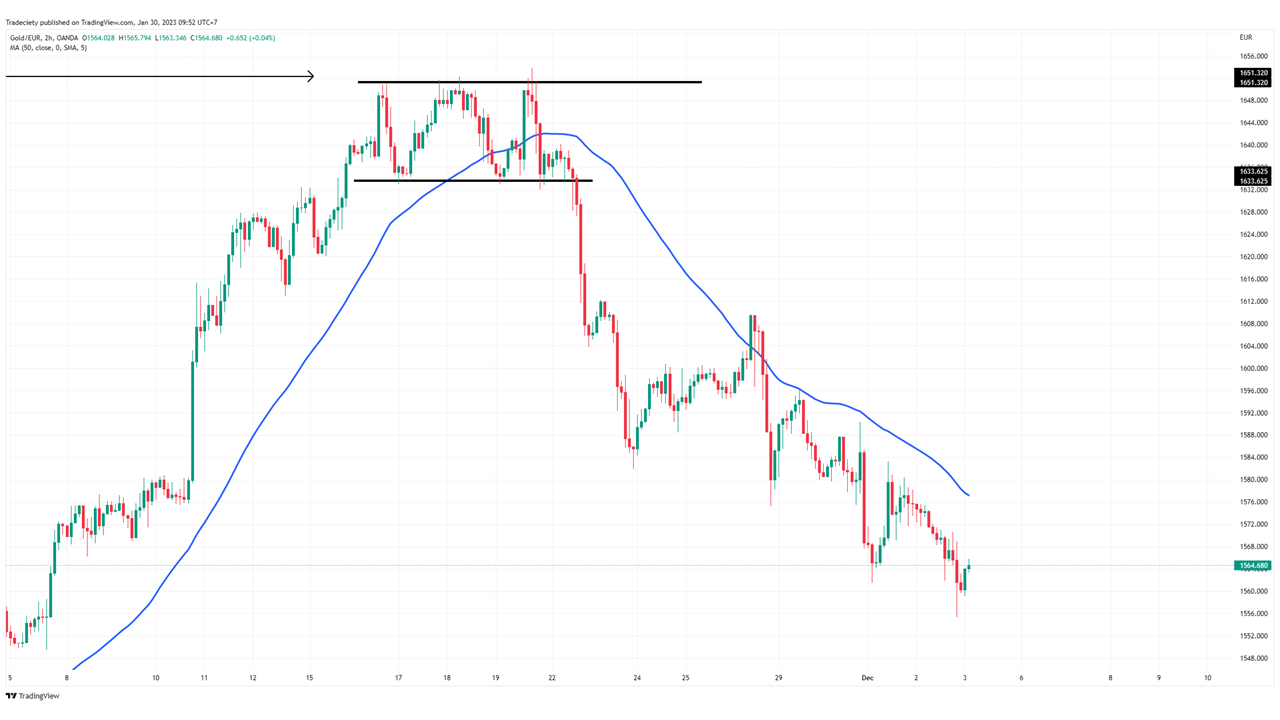
The trend turned after the price broke into a new low. Adding a Moving Average may also help in understanding the trend phase.
The 1-2-3 Forex chart pattern is an advanced trend reversal pattern.
First, you want to identify a mature trending market. In the scenario below, the price is in a strong uptrend.
Then, you suddenly see a strong selling phase. The selling wave from points 1 to 2 is the strongest bearish wave that we have seen during the entire uptrend. The wave also breaks below the last highest low, now forming the first lower low.
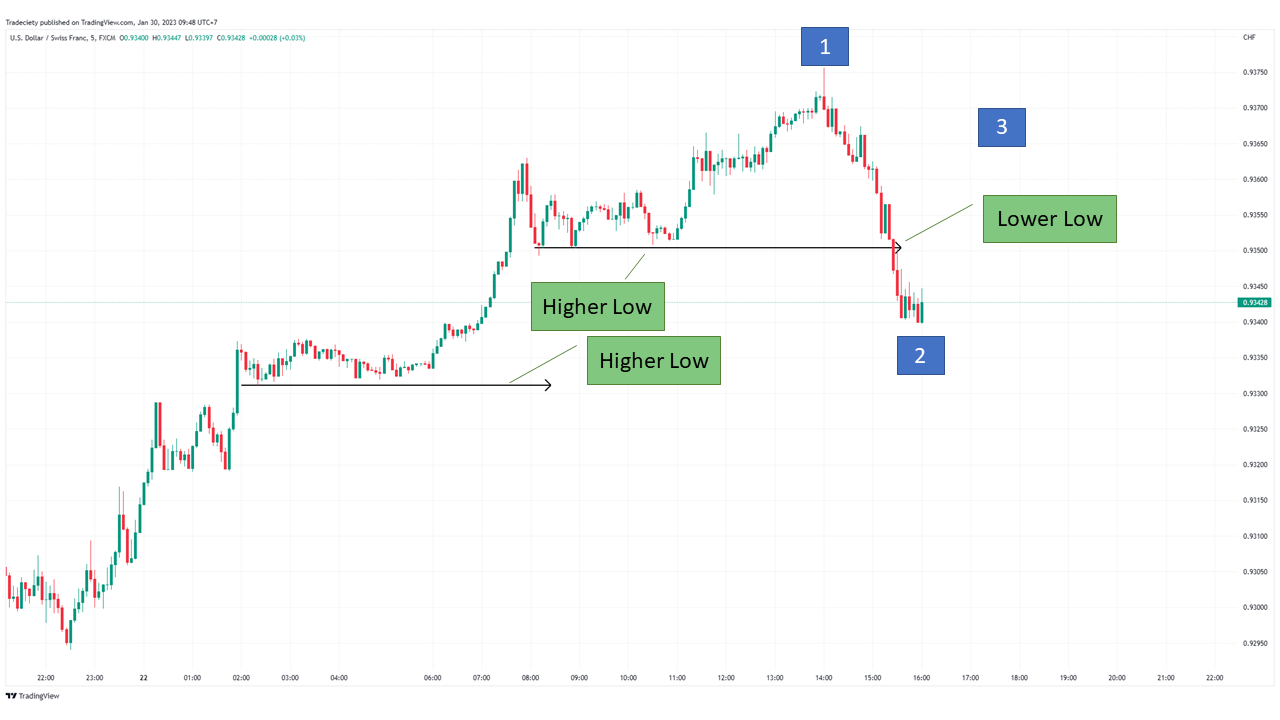
Traders are then waiting for pullbacks to identify entry opportunities. The next trend wave, moving from point 2 to point 3 is forming a lower high and the price is not coming close to the previous highest high at point 1.
The strong bearish wave and the weaker bullish phase build the 1-2-3 pattern and traders often go to a lower timeframe to time entries with more precision as the lower high forms.
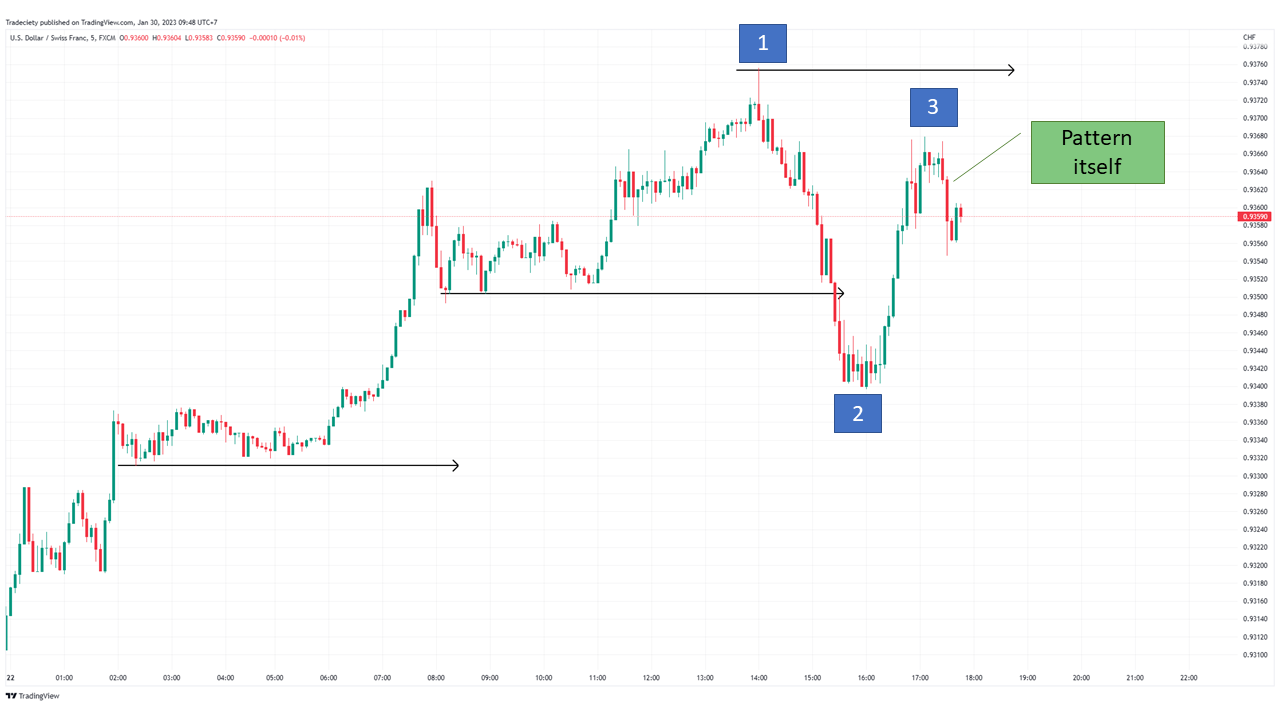
Around point 3, the price will often form chart patterns on the lower timeframes that can be used to time trade entries. Thus, the 1-2-3 pattern is more advanced since timing the pullback at point 3 is not as easy and requires a multi-timeframe approach.
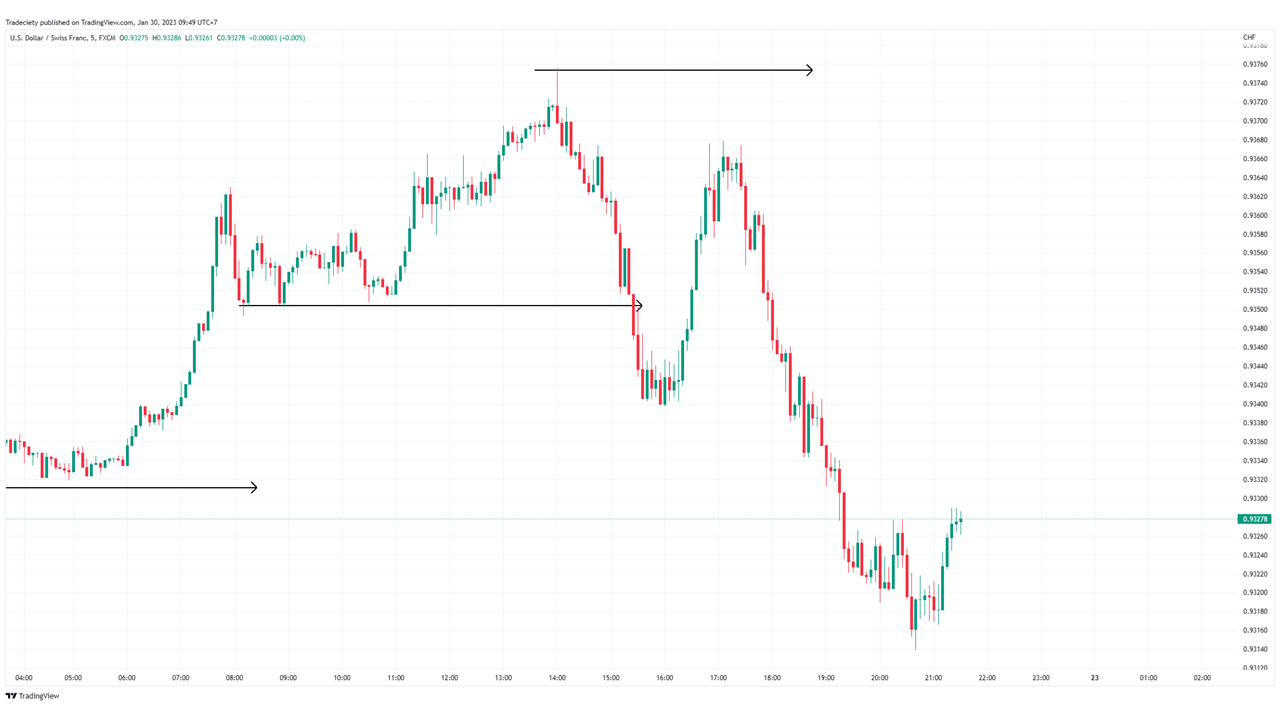
Chart patterns offer unique insights into price development and with the help of chart patterns traders can decode chart situations effectively.
Most traders just have a very basic and surface-level understanding of chart patterns which limits them in their trading. By understanding the principles and the building blocks of chart patterns, as laid out in this article, traders will be able to effectively anticipate different chart situations.
If you want to get started with chart pattern trading, I would recommend focusing on just a handful in the beginning. It is easy to overwhelm yourself by trying to trade all the different chart patterns.
external link:


We have been trading supply and demand strategies for over ten years, and they have stood the test of time remarkably well. Supply and demand is...

3 min read
Choosing the right trading journal is essential for traders wanting to analyze performance, refine strategies, and improve consistency. In this...

3 min read
“95% of all traders fail” is the most commonly used trading related statistic around the internet. But no research paper exists that proves this...