Supply and Demand Trading in 2026
We have been trading supply and demand strategies for over ten years, and they have stood the test of time remarkably well. Supply and demand is...
Momentum is another word for how the price on your charts moves. Momentum analysis, though, is one of the most important skills any trader can learn.
First of all, we need to understand what momentum actually means but this is straightforward.
Momentum = Trend strength
There are two ways of looking at momentum. The first one just looks at the overall trend strength.
When the price is in a strong or healthy trend, traders say that the momentum is bullish or bearish (in a downtrend).
When we come to the micro level later, we will see that momentum also exists when we just look at individual candlesticks. A long candlestick without wicks (shadows) usually is considered a high momentum candlestick.
Below are three examples:
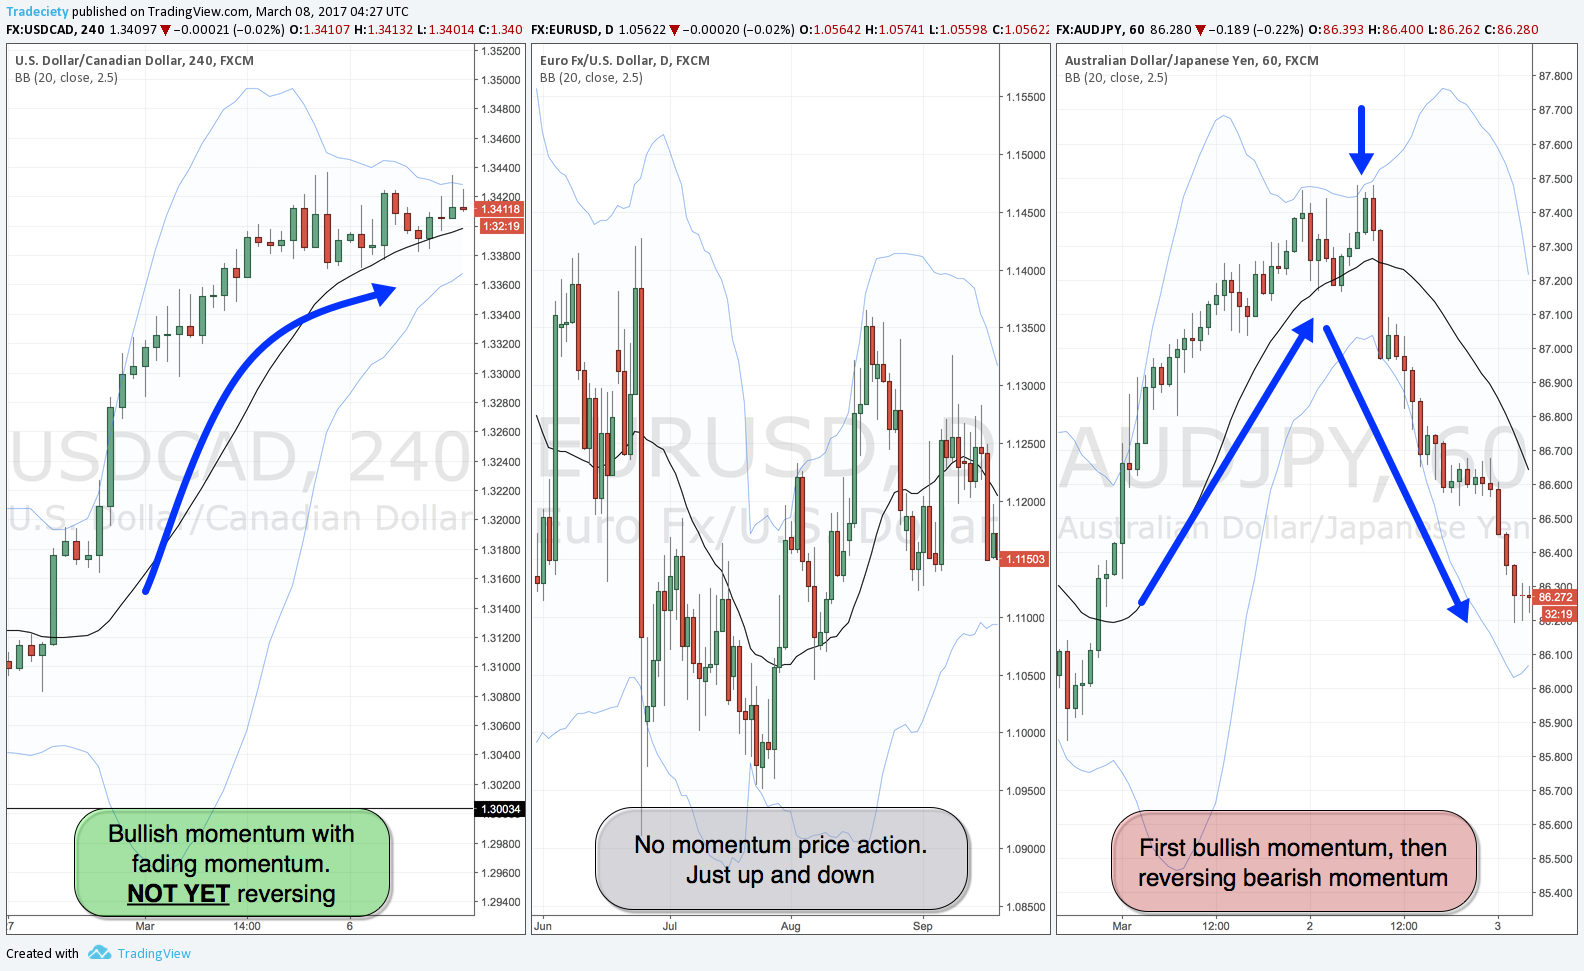
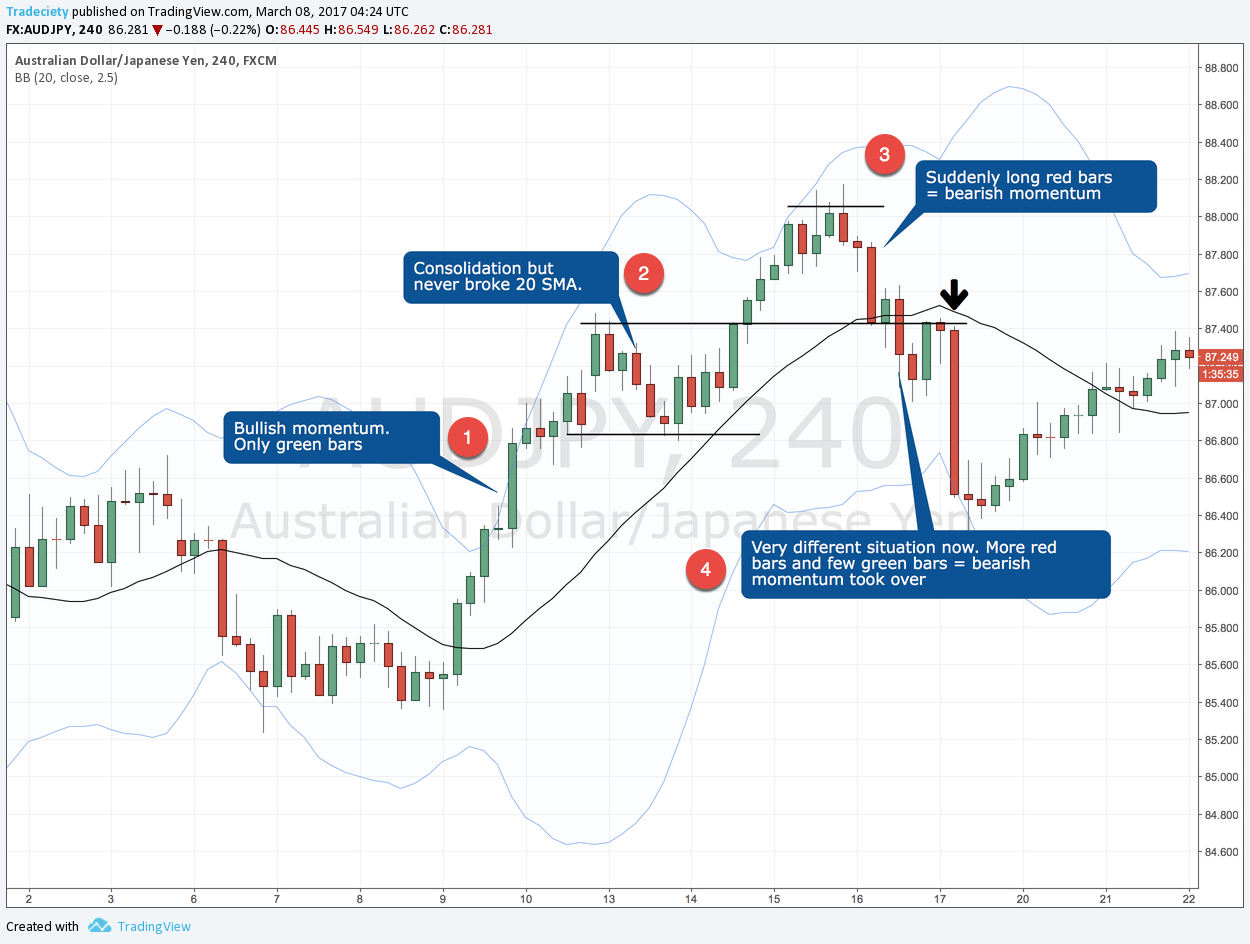
To understand and read charts like a pro, let’s follow momentum here a little bit during the trend and reversal.
1: First, we are in a strong uptrend where price trended close to the outer Bollinger Bands®. This is a high momentum phase.
2: Then price entered a regular consolidation after the first trend wave. This is a normal behavior during trends and the price usually moves in those wave-like phases.
3: At the top price then reversed stronger. Here we then saw a strong sequence of three bearish candlesticks. This was the first time in a long time where price showed such strong bearish momentum. This is a significant signal that something is changing.
4: When price breaks the previous low and makes a lower low, the momentum completely turns.
As I said above, just comparing how many bullish vs. bearish candlesticks you have and how strong they are, you can gain a deep understanding of price charts. By the way, this is also what indicators like the RSI or the Stochastic do.
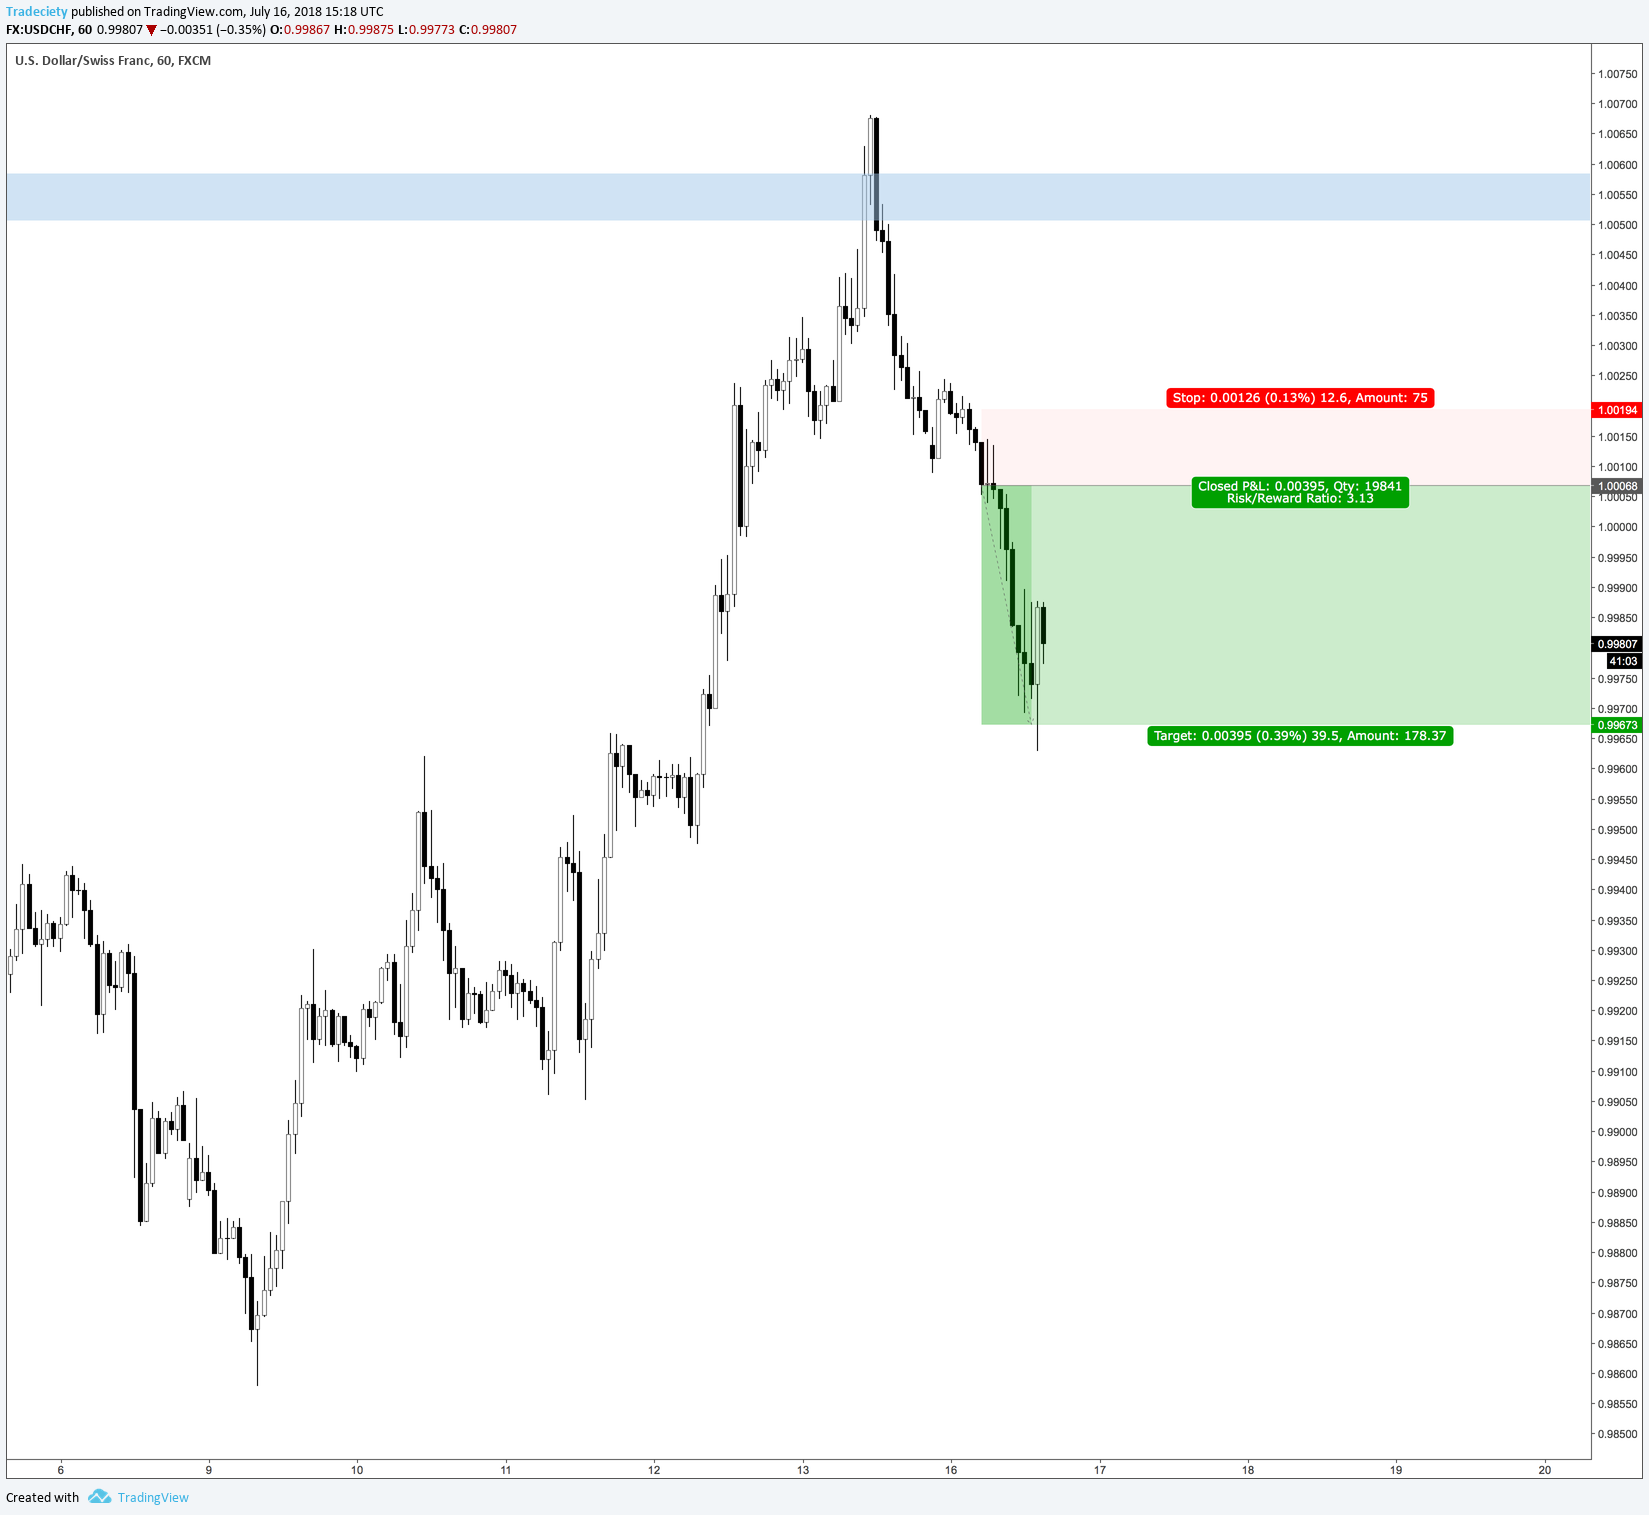
You can see that the downtrend was indicated well in advance. On the left, the price was going up strongly without any bearish interference and the sellers never had any chance to move lower. After the price rose into the blue zone, things changed and now the bearish candles become much stronger and longer.
Then we just wait for all the other signals of my trading strategy and once the trade is ready, the price immediately fell into my take profit target.

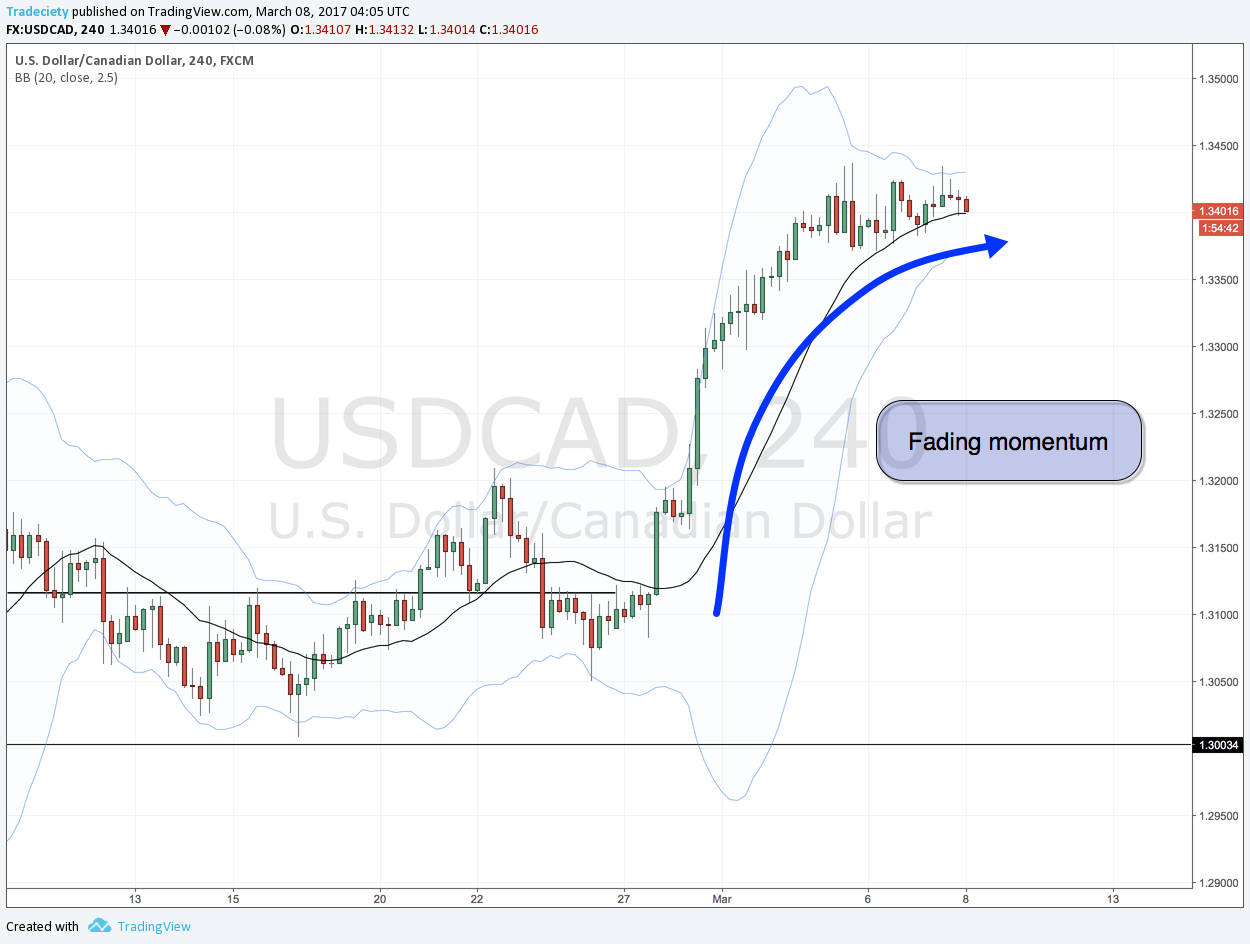
The screenshot shows the USD/CAD 4H chart which many traders are looking at right now. Price trended nicely higher but recently, the momentum got weaker and price ‘rounded off’.
This can mean one of three signs:
Most people make the mistake in their trading that they don’t wait for the final momentum signal. If I am looking to sell the USD/CAD, I will wait until I can see a clear high momentum bearish bar or sequence that confirms price is actually going lower.
Amateurs will try to forecast a move and then either buy or sell as long as price is still in this range; this is a low probability trade and predicting is not going to work.
As you can see, momentum analysis is a great way of looking at charts and it should be used by all traders, regardless of their style.
Questions? Just leave a comment and I’m happy to help you out.
external link:


We have been trading supply and demand strategies for over ten years, and they have stood the test of time remarkably well. Supply and demand is...

3 min read
Choosing the right trading journal is essential for traders wanting to analyze performance, refine strategies, and improve consistency. In this...

3 min read
“95% of all traders fail” is the most commonly used trading related statistic around the internet. But no research paper exists that proves this...