Supply and Demand Trading in 2026
We have been trading supply and demand strategies for over ten years, and they have stood the test of time remarkably well. Supply and demand is...
Reversal trading has a very bad reputation. But are reversal trading strategies really inferior, riskier and should be avoided? Having traded myself for over 15 years, I can tell you that is not the case. It is quite the opposite.
Every new trend starts with a reversal from a previous trend. That is why reversal traders can often anticipate new trends early on and potentially increase their winning size by riding the new trend for longer. It can pay off to study reversals if you want to find the best trends early.
In the following, I have 3 trading strategies you can start using (demo first! always get familiar with demo) on any market. The concepts and strategies in this article are timeless. This means they are going to the underlying core of how the markets and price action work. My goal is to help you understand the true nature of the market by going through those strategies.
Although many traders will have heard about divergence trading, most of them have barely scratched the surface. Let me provide you with a different look at what divergences truly are.
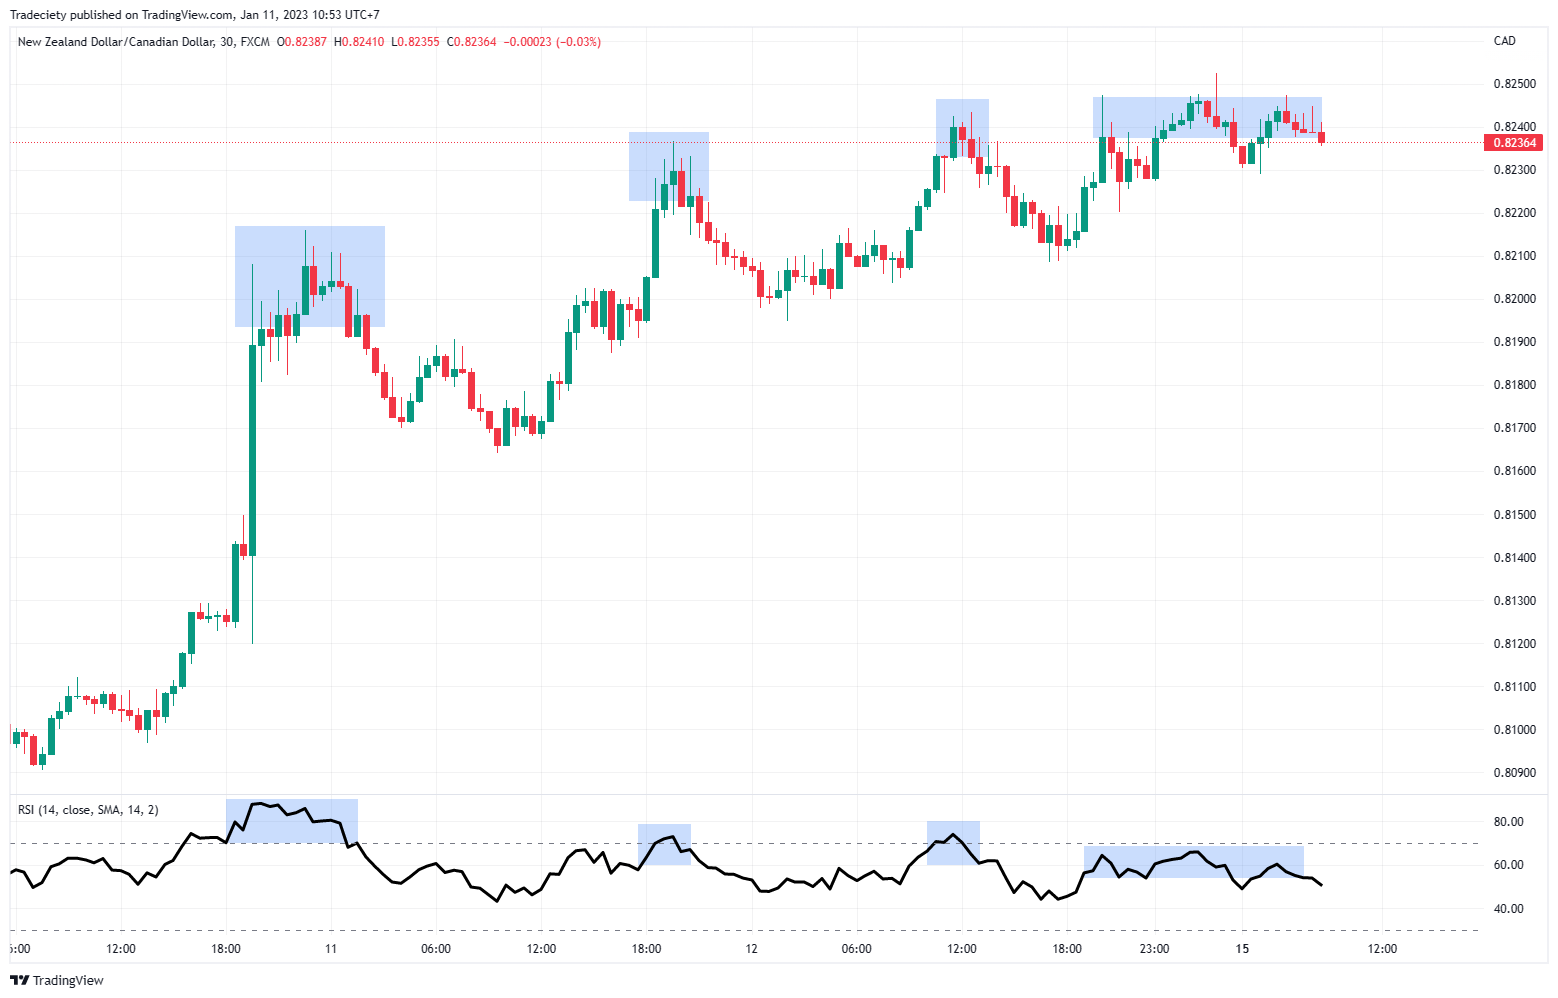
I added a regular 14-period RSI indicator to the price chart below. The RSI is a momentum indicator which means that the indicator measures the speed of price and how strongly a market is moving.
Whenever the price action made a new high, I marked it with a blue box. I also marked that same period on the RSI indicator.
Something is interesting going on. Do you see it?
The RSI shows us a lower high each time the price action makes a new high. This is what we would call a divergence because the price action and the indicator are diverging.
But why is this interesting?
Since the RSI measures trend strength, the lower highs indicate that the market is losing momentum and is slowing down. This is an important insight if we are in a long trade in this market since it could mean lower chances of a trend continuation.
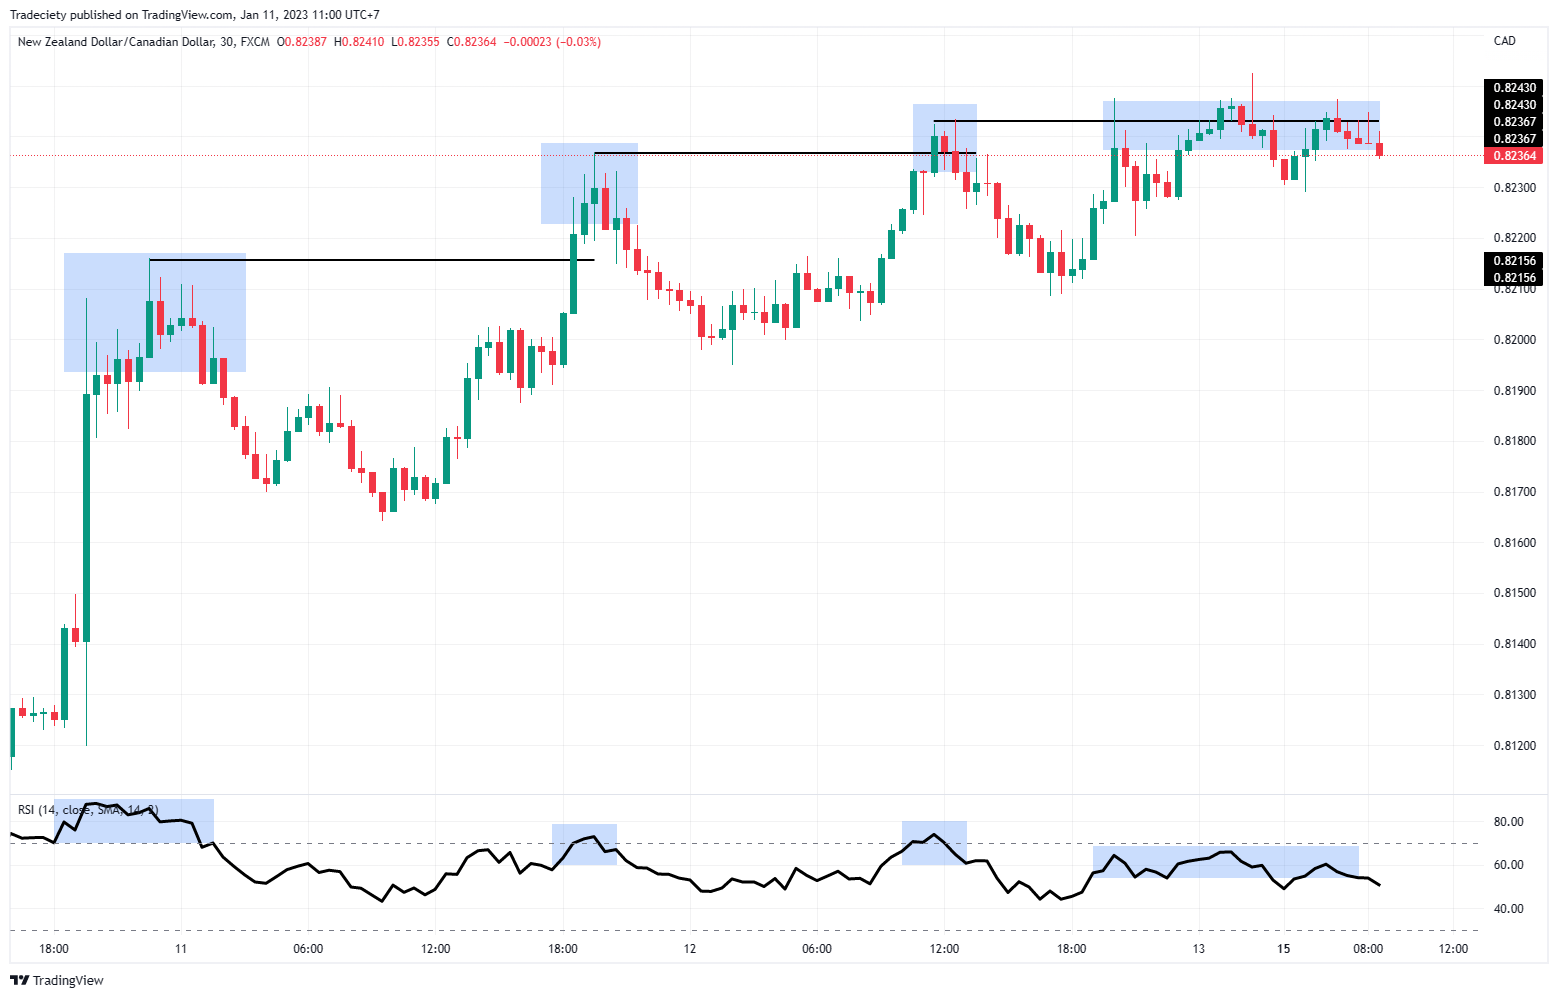
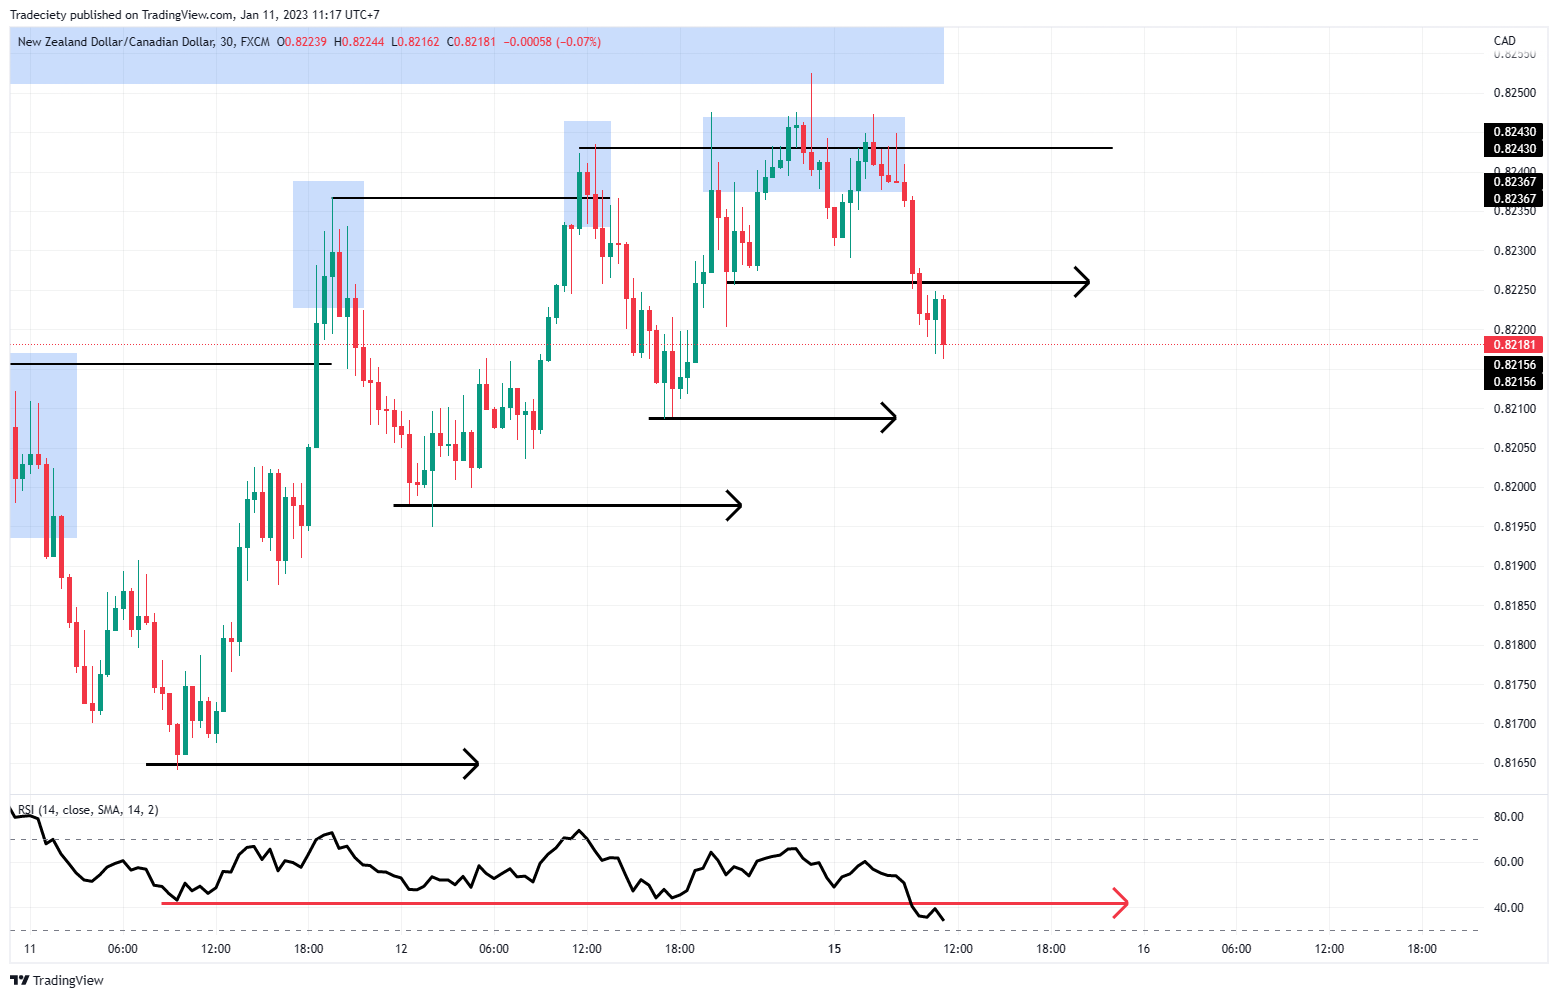
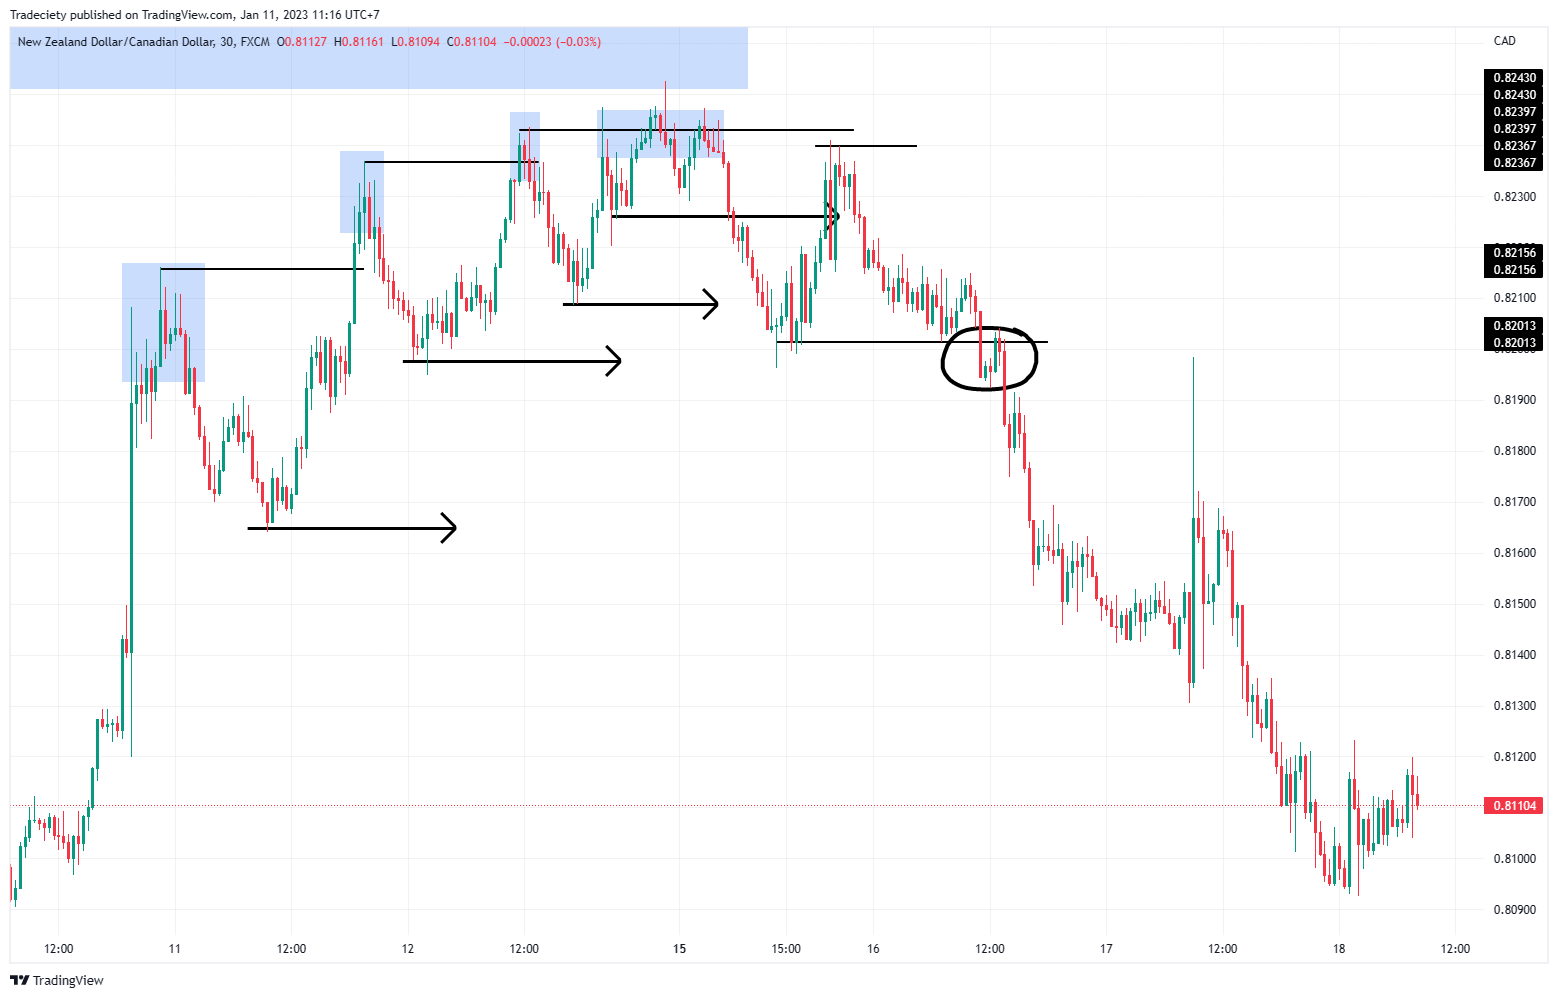
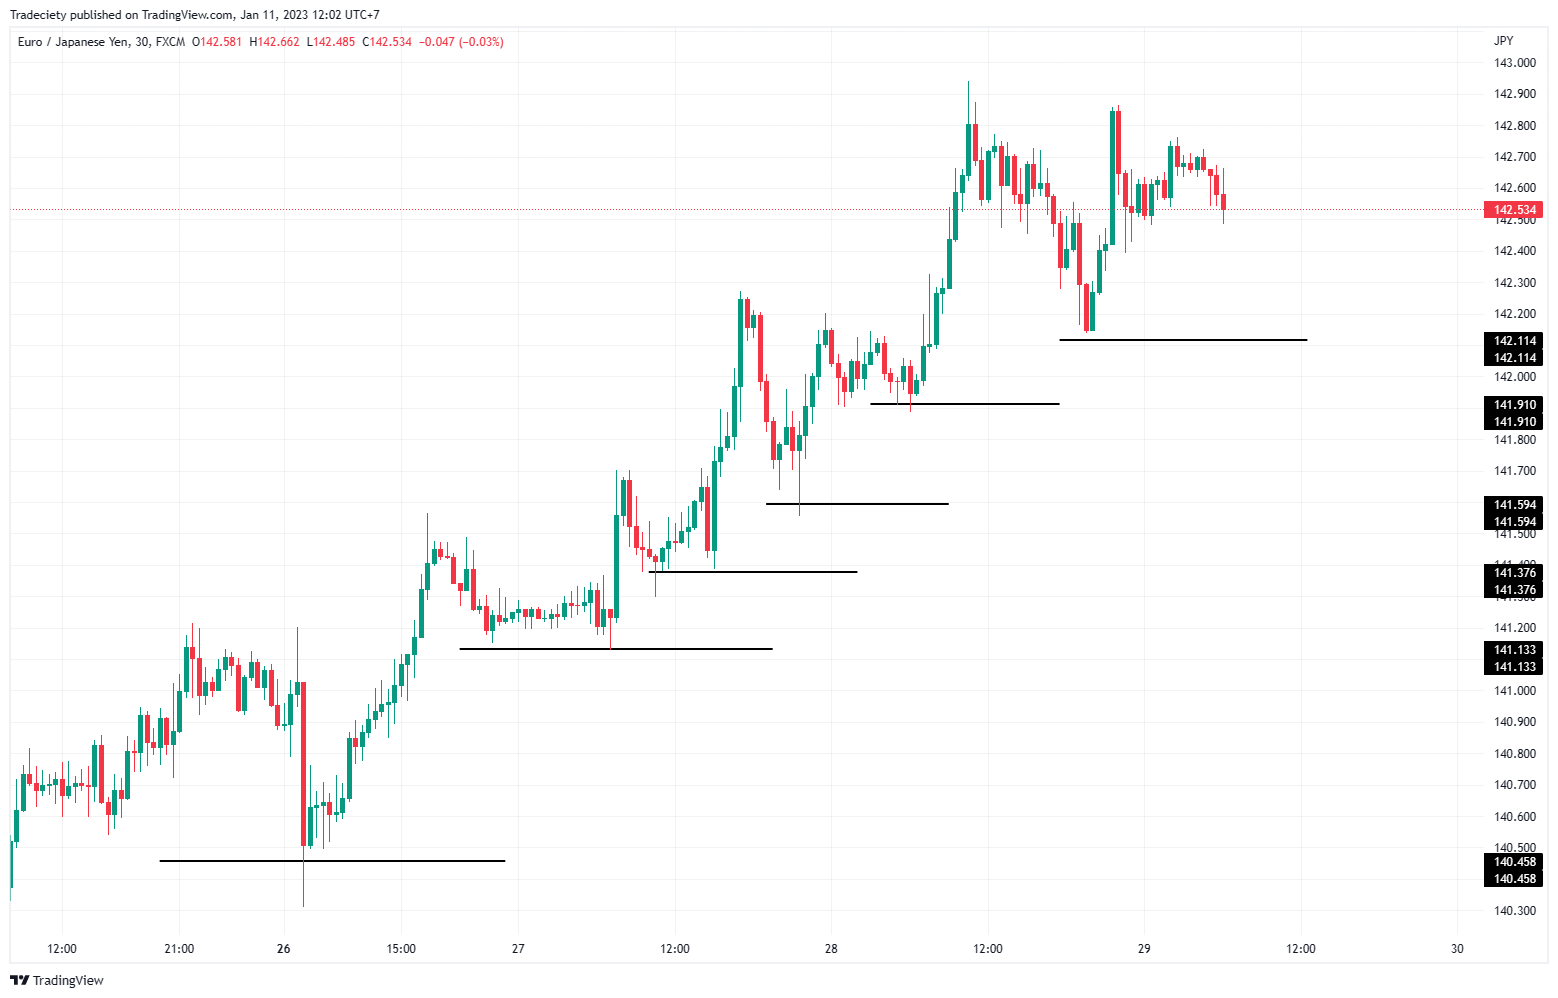
The RSI indicator measures the length and strength of trending waves. In the screenshot below I marked each high on the price action with a horizontal line.
What stands out is that the distances between the price high are getting smaller with each subsequent high. This means that the bullish trend waves are getting shorter, which the RSI picks up and highlights as a divergence.
Particularly interesting is also the last high sequence. We have a triple-top where the price was pushed into the same price level three times but could not move beyond. This is a bearish chart pattern.
The shrinking distance between previous price highs and the final failure to make a new high altogether are bearish signals.
However, one common problem many inexperienced traders have is that they usually are too impatient and often jump the gun on their trades. Just because we see a divergence, it does not mean that the price will move lower.
When a trend ends, the price will either go into a sideways range or reverse into the opposite trend.
We could keep going and further analyze the price action to check if a market reversal may be ahead. When long-positioned traders exit their trades, this adds to the bearish pressure since they are selling. A trend reversal may occur if enough buyers exit their trades and new sellers enter the market.
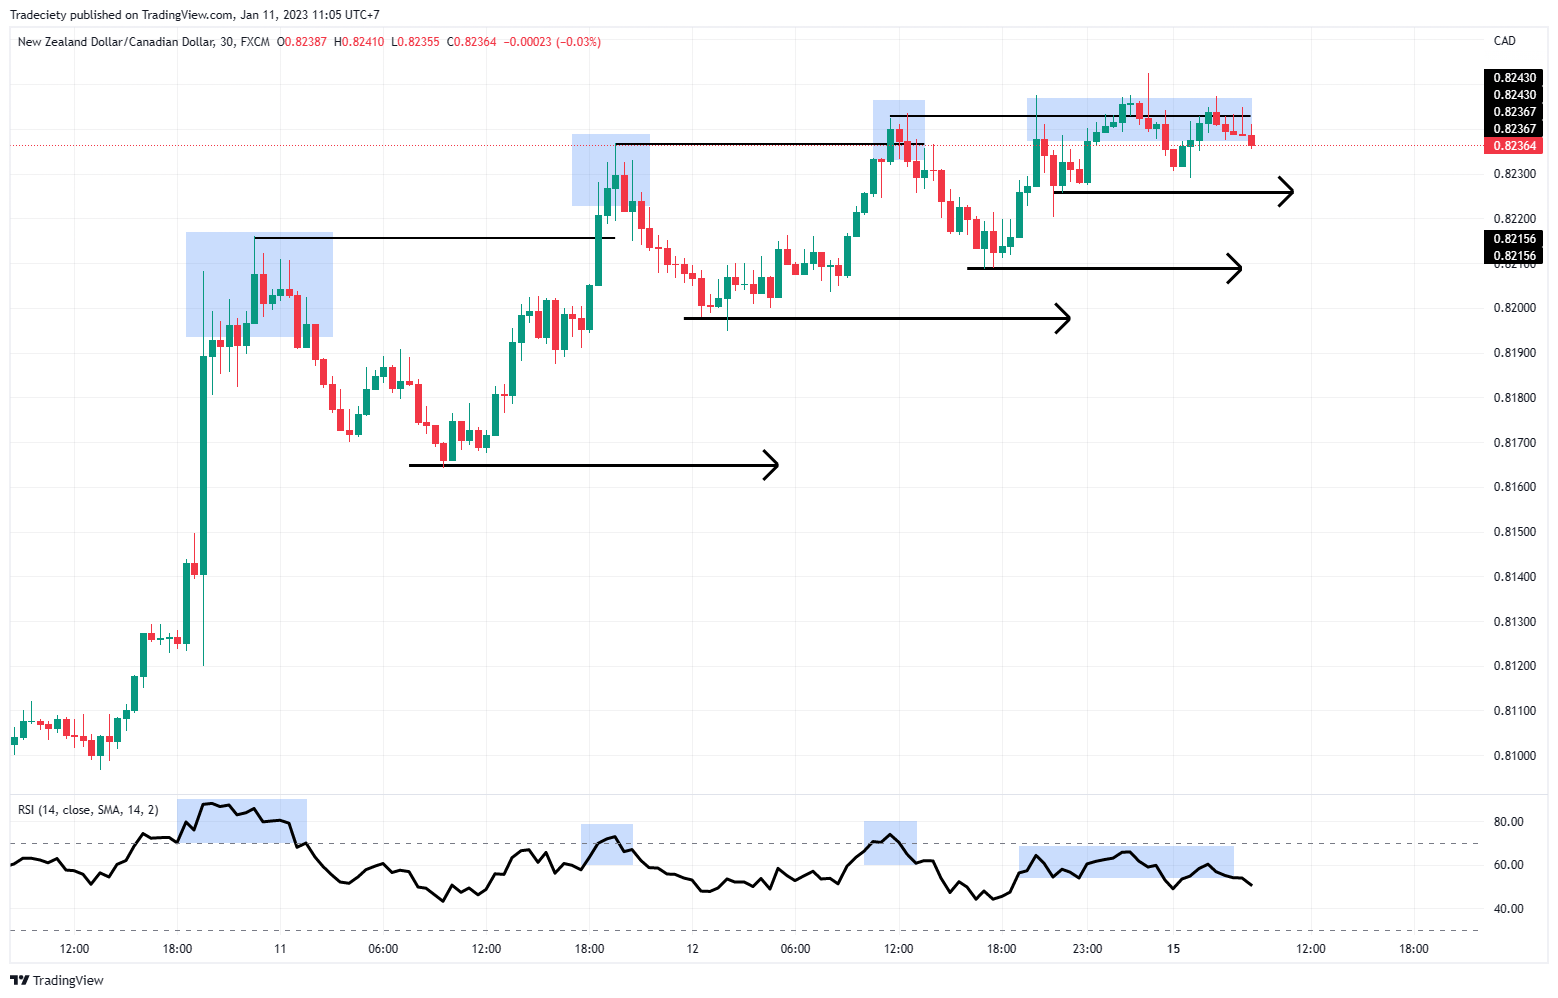
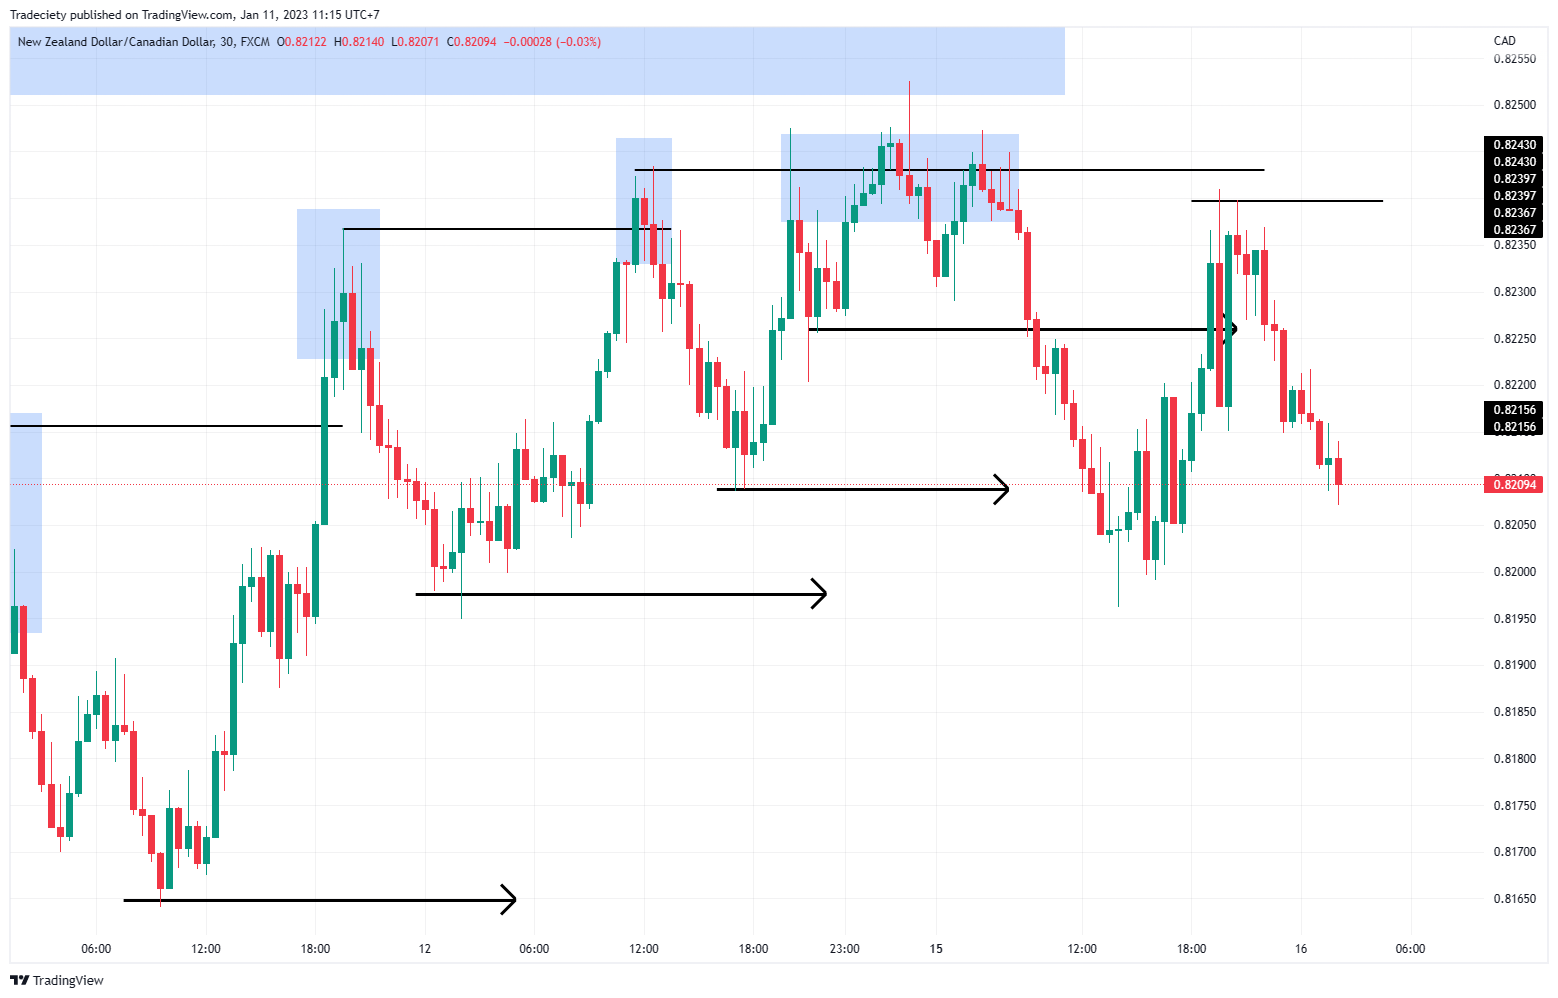
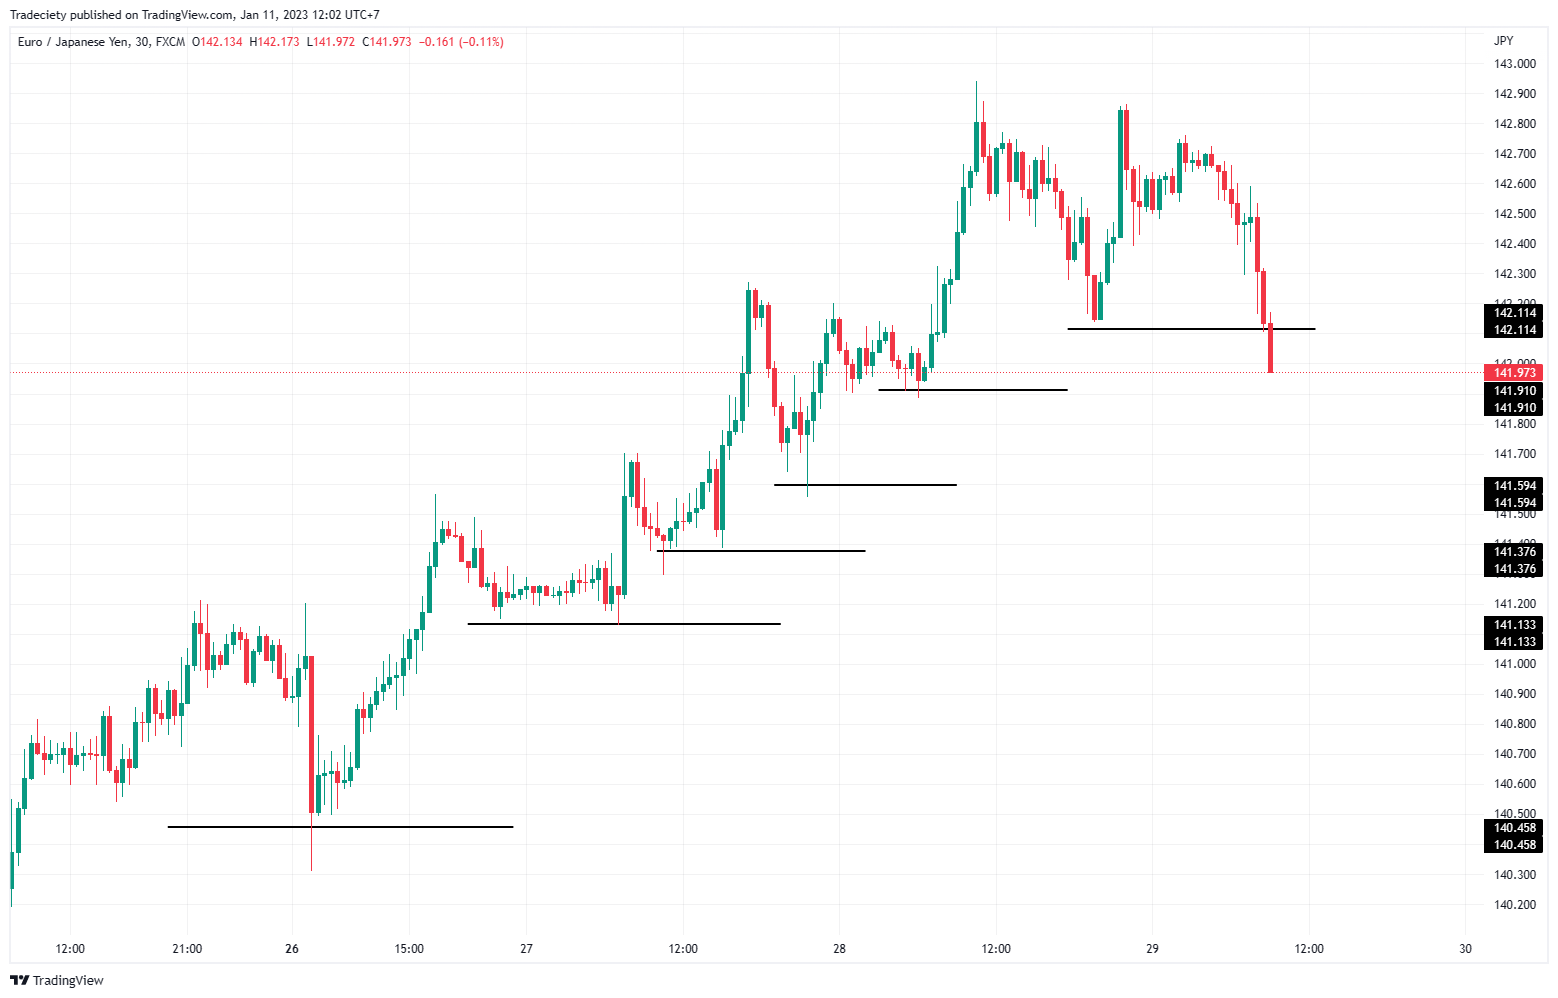
In the screenshot below, I marked the price lows using arrows. In a bull market, you will generally see that a market is making higher highs AND higher lows. As long as this pattern is present, there is no reason to go short.
Higher lows mean there are still bulls who buy up the price every time the market dips. If you want to find a higher probability short scenario, you ideally wait for the market to make a lower low. A lower low indicates that the buyers did not buy up the price as fast as they used to: an additional bearish criterion.
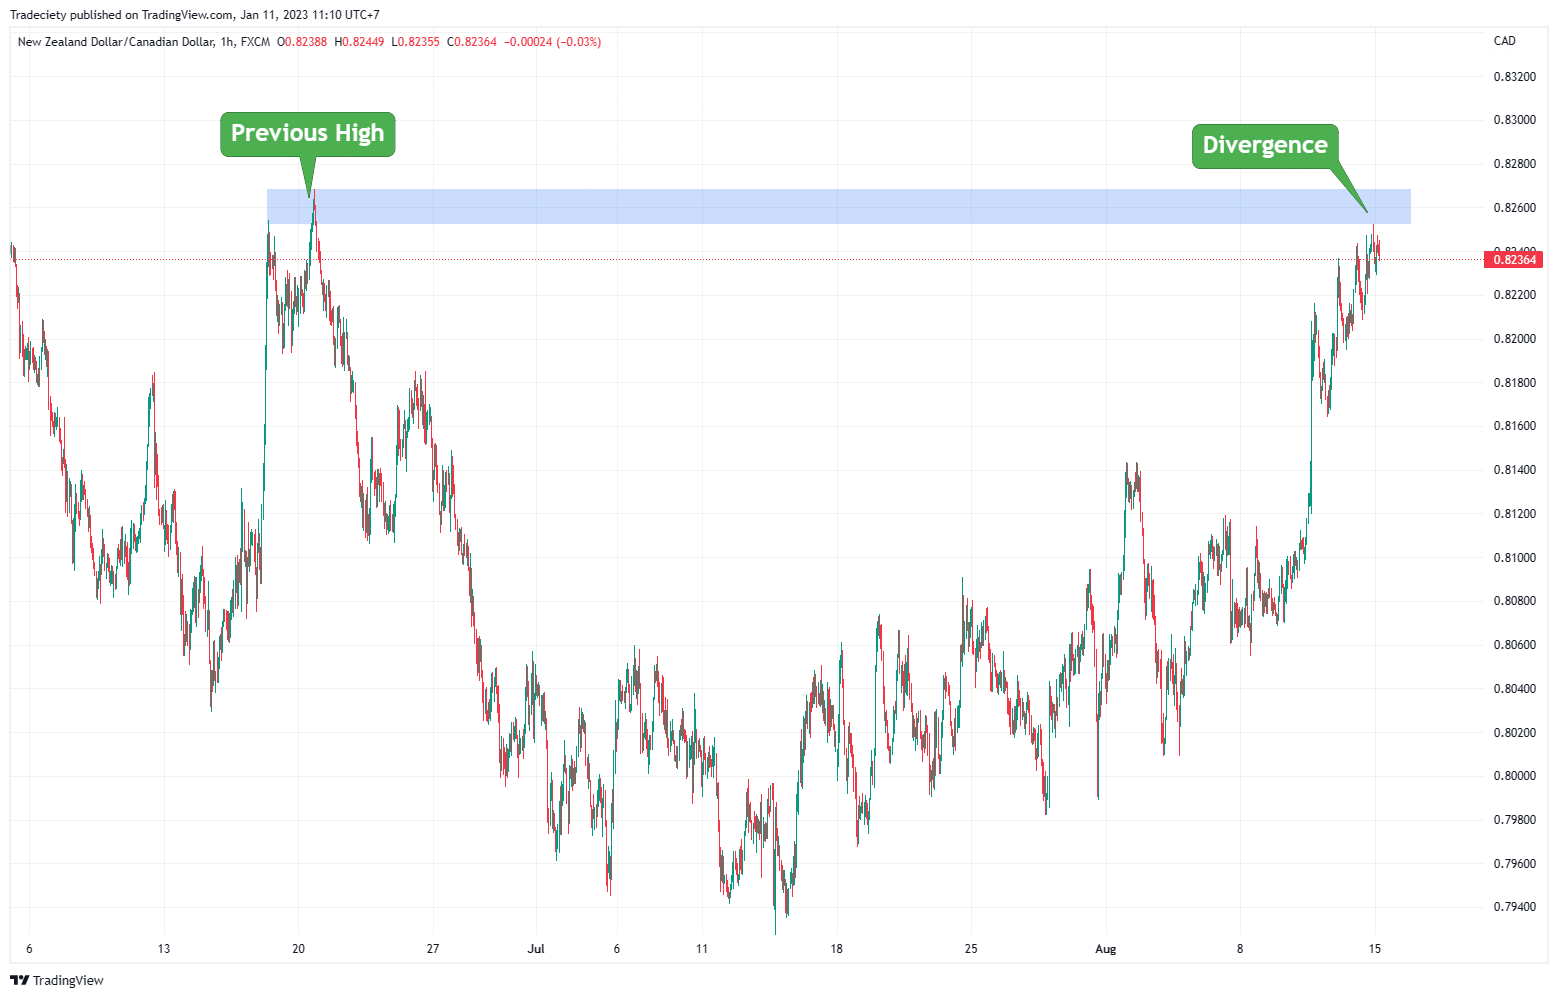
Another critical tip: zoom out and see where the pattern occurs in the big picture.
The screenshot below shows that the divergence we have been looking at (right) is happening just underneath a previous high. The previous high was the origin of a major trend reversal already. You can be sure that many traders are again looking at the same price level now.
Furthermore, the current divergence occurs in a mature trending market. The current market has been rallying for many weeks, and the price has traveled substantially higher.
Why is this good?
The longer a trend has been going on, the more people have bought this market up. Fewer potential buyers who are not long yet are left - who else is left to push the price higher?
Second, those buyers are sitting on a large number of unrealized profits. Such traders are more likely to close their trades at the first sign of weakness to avoid giving back profits. This also adds to an increase in selling pressure.
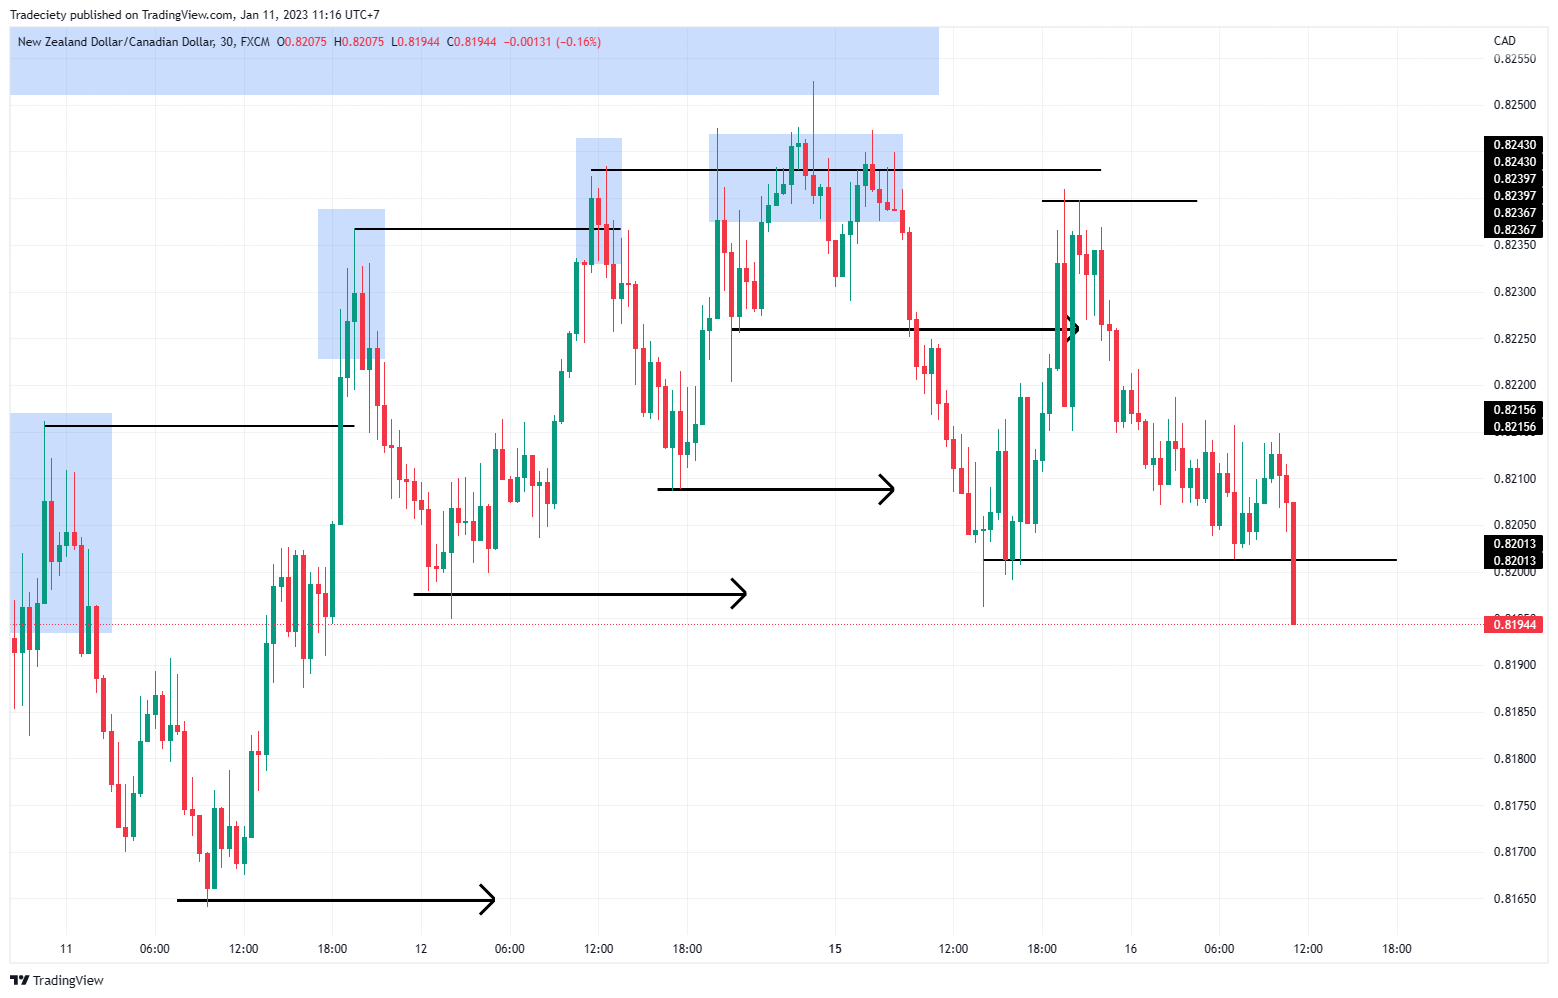
A few candles later, the price provided the first real bearish signal.
The price, for the first time, made a lower low. Looking at the RSI now shows that the RSI is also at its lowest level.
Yes, drawing support/resistance levels also works on your indicators!
Now, the price action is starting to look quite bearish. But there is one thing missing: a lower high.
In a bear market, the price action should show lower highs AND lower lows.
Aggressive traders may already jump into trades now, but note that your winrate will probably suffer because you are missing a significant piece of information.
A few candles later, the lower high is in! The price rallied aggressively after making the lower low. This is not uncommon, and a famous trader once said:
Volatility is greatest at market turning points.
This makes sense since many buyers will exit after a long bullish trend and new sellers enter the market. Such a power shift is often leading to an increase in volatility.
One piece was missing to signal the optimal short: the break into a new low.
Why can this be important? Because only then can we say with absolute certainty that the previous high is actually a lower high.
Having said that, you can also make a case for trading those first lower highs more aggressively. In fact, strategy 3 in this article tries to do exactly that. So keep reading if you are interested in a more aggressive entry approach.
After the low broke (marked with a circle below), the real trend started. The volatility peaked at the market top, and the trend unfolded once the dust settled after the first lower high.
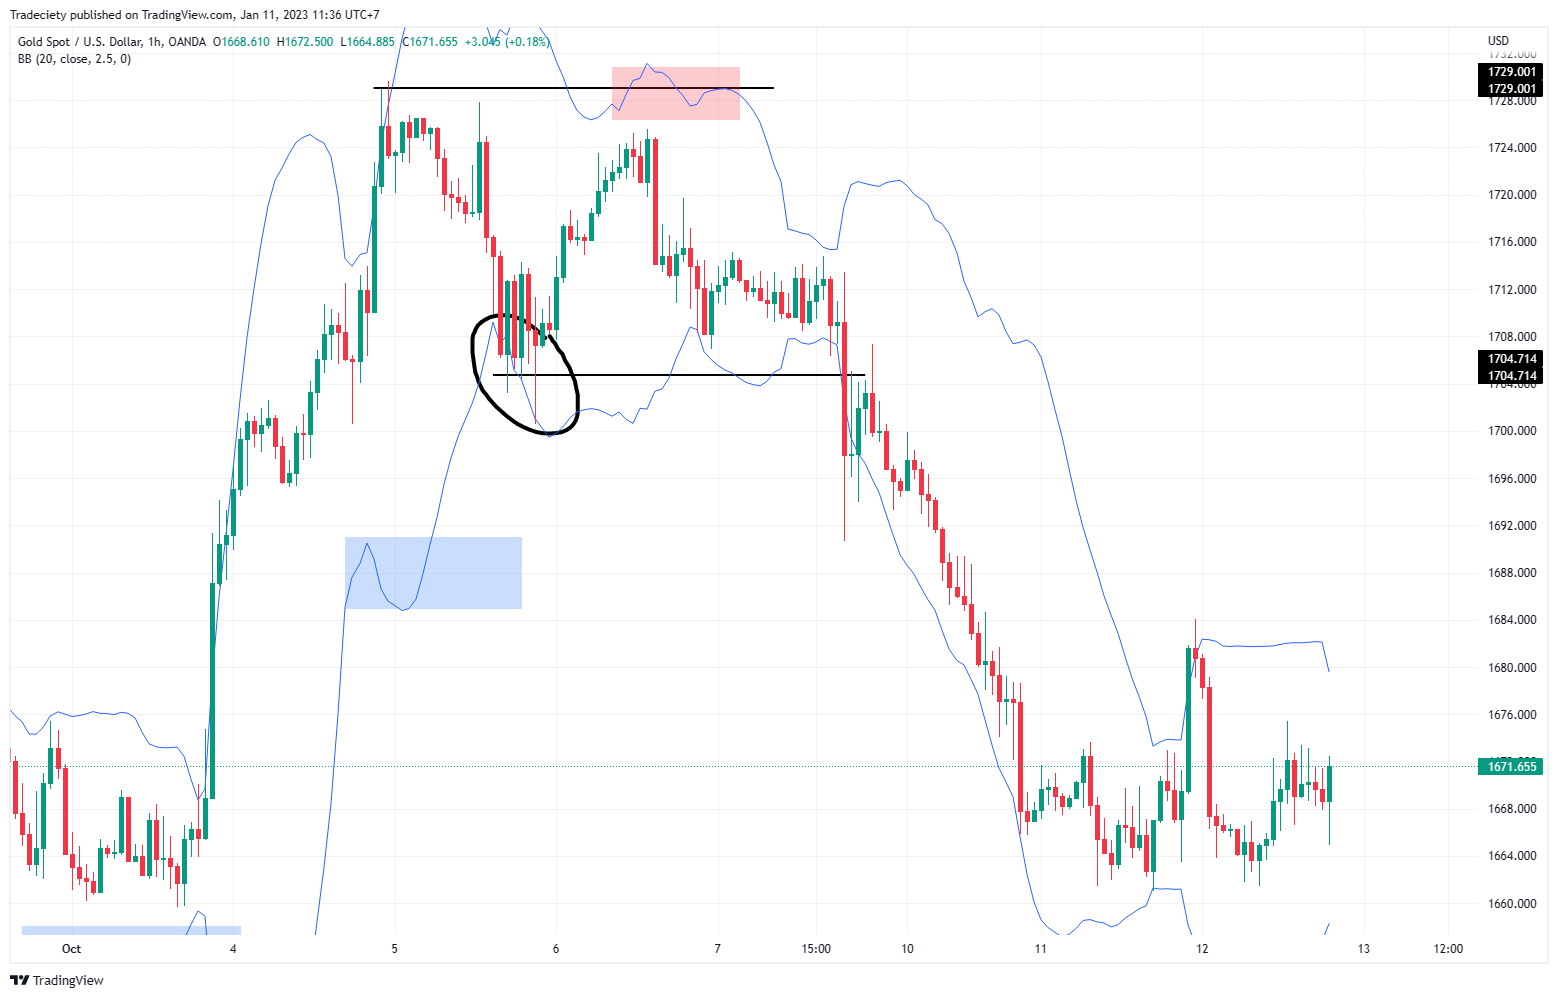
Bollinger Bands (R) are among my favorite trading tools and are ideal for trend-following trading.
However, I would recommend changing their default setting first. I use the 2.5 value for the standard deviation instead of the default 2.0. This makes the bands wider and the signals more meaningful. Basically, we can filter out more noise.
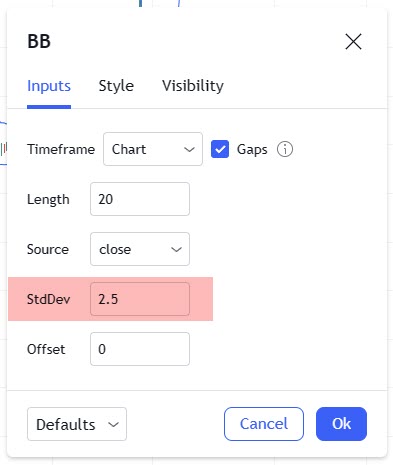
Then, your charts will look like the screenshot below; I turned off the middle line.
Mostly, the BB should be used for trend trading. You can make a case for using them in a range markets, but in my experience, they work best for trending markets.
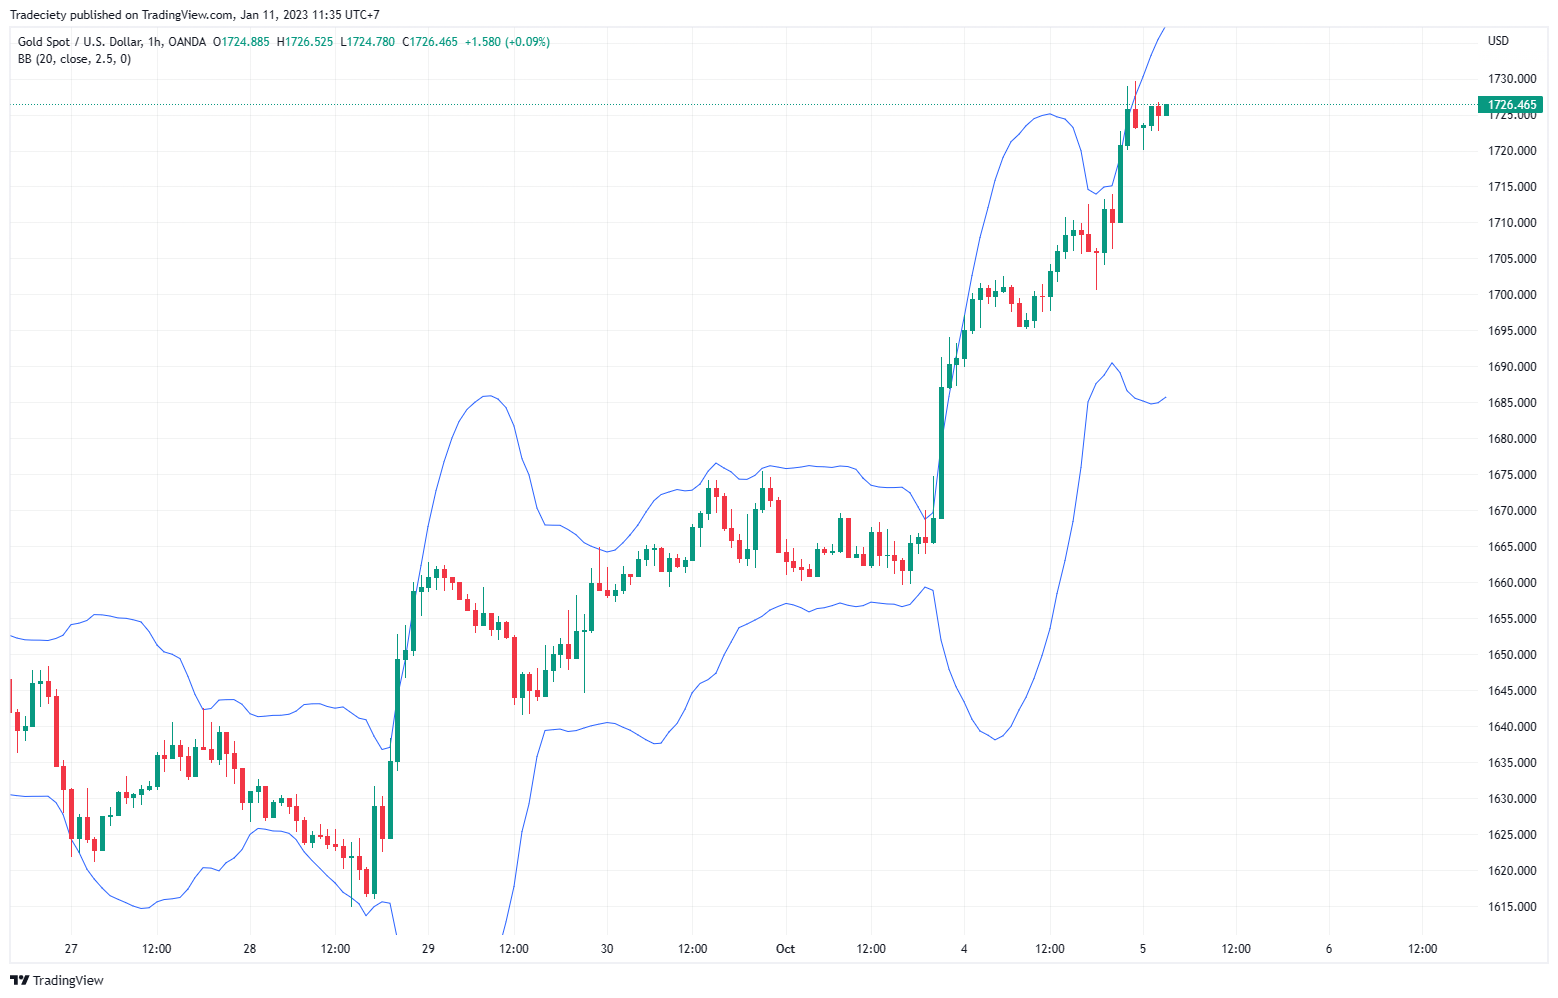
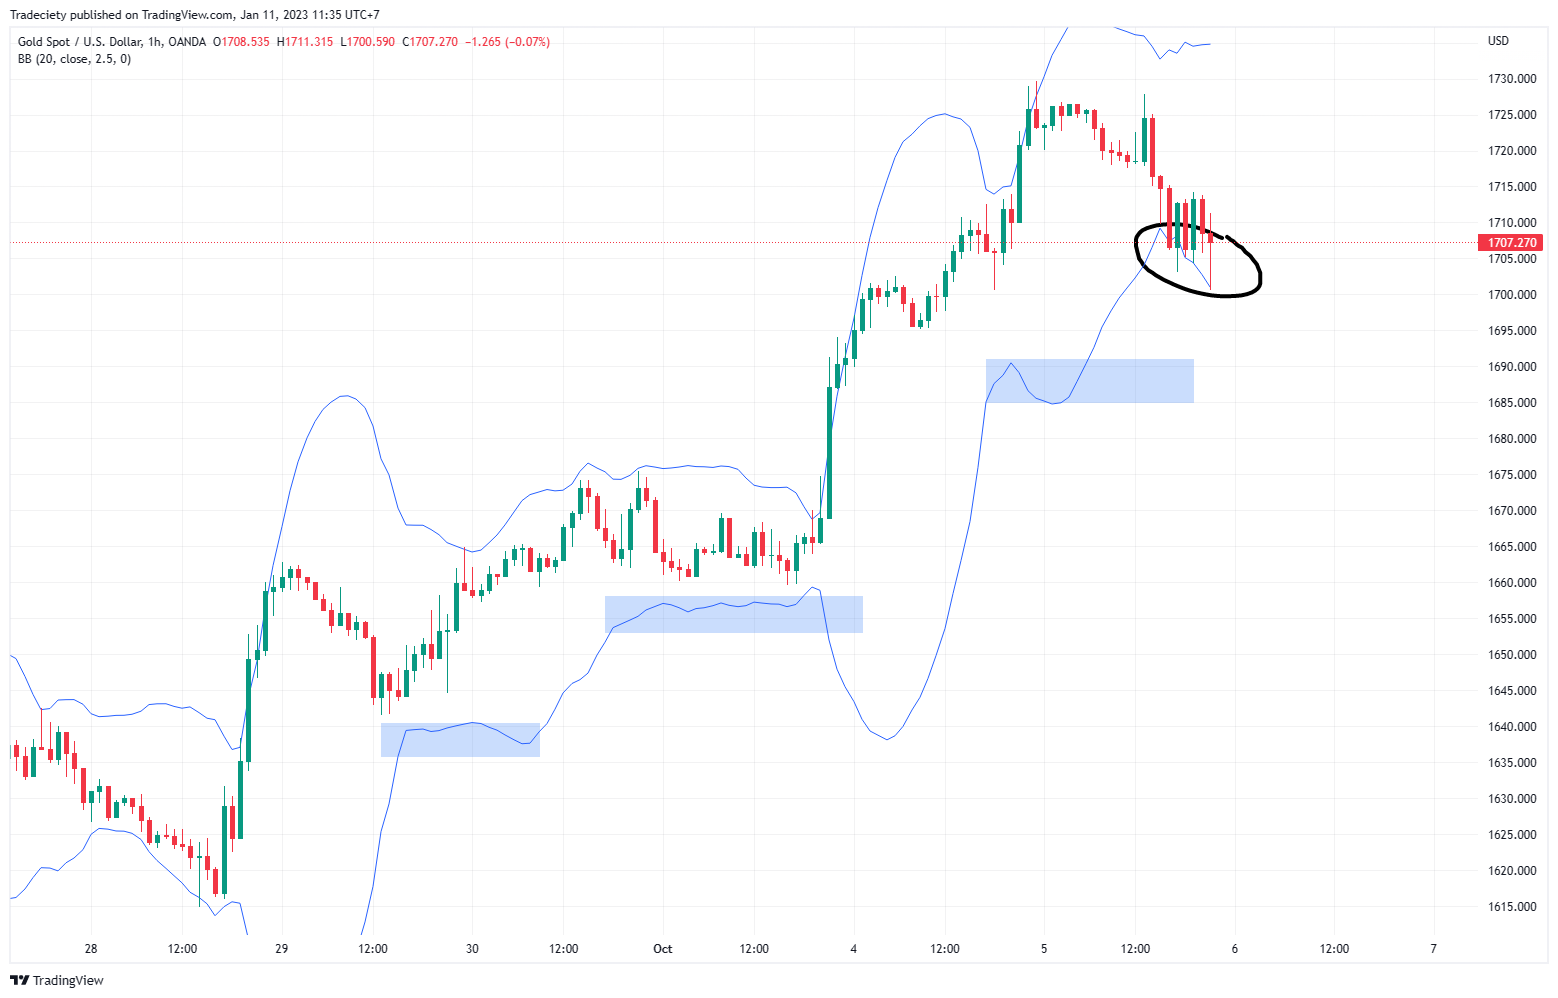
In a strongly trending bullish market, you will generally see that the price action keeps pushing into the upper band while failing to reach the lower band. In the screenshot below, Gold was in a particularly strong trend and did not reach the lower band once.
Sometimes, deeper pullbacks can also reach the opposite band, though. However, as long as the price action cannot stay at the opposite band for an extended period of time or even push the opposite band down, it is not a particularly strong signal.
In the case of Gold, the bullish trend unfolded while the price was pushing into the higher band, ignoring the lower band. This is typical for a healthy bullish trend.
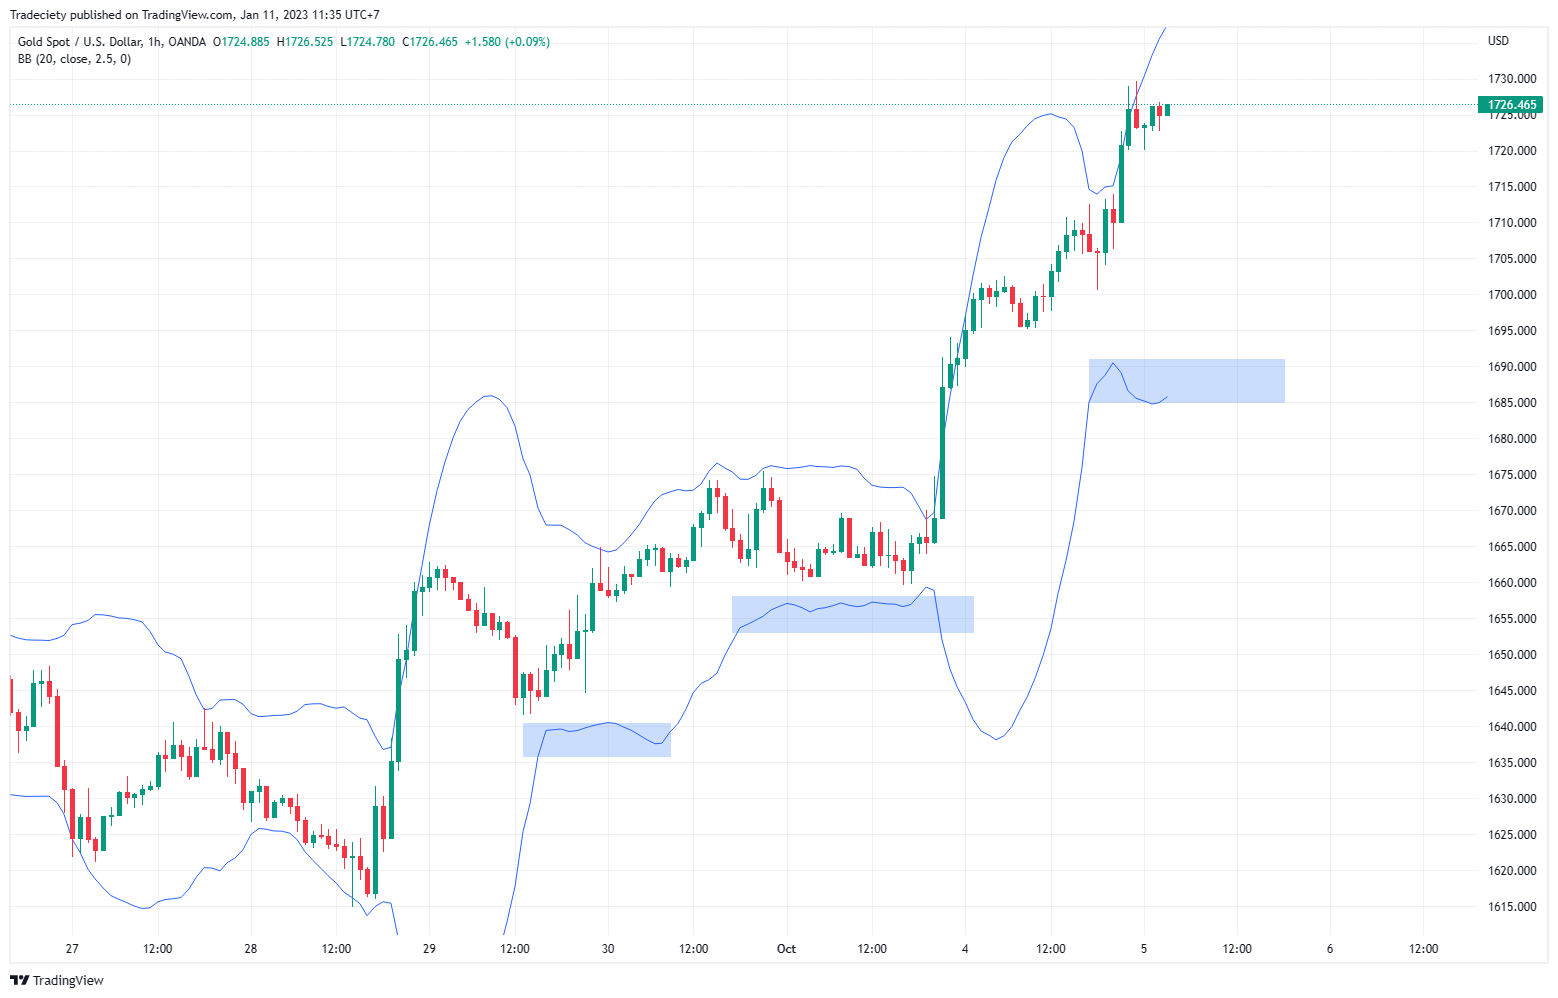
Now, the situation has changed slightly. The price has, for the first time, moved into the lower band. This could as well be just a deeper-than-usual pullback. But from here on forward it is important to monitor the price action more closely.
If you have been riding the bullish trend, you may want to consider moving your stop loss closer and/or closing parts of your position to realize some profits.
Shortly after, the situation turned completely.
After the first push into the lower band (circled area), the price rallied higher BUT failed to make a new higher high. The price even failed to reach the upper band. This is a significant change from previous trending actions.
And then, finally, the price pushed into the lower band once again. This time, the price also broke the last low. As we have learned in the divergence example, breaking lows after mature trending markets is an important sign that the power balance between the buyers and the sellers is shifting.
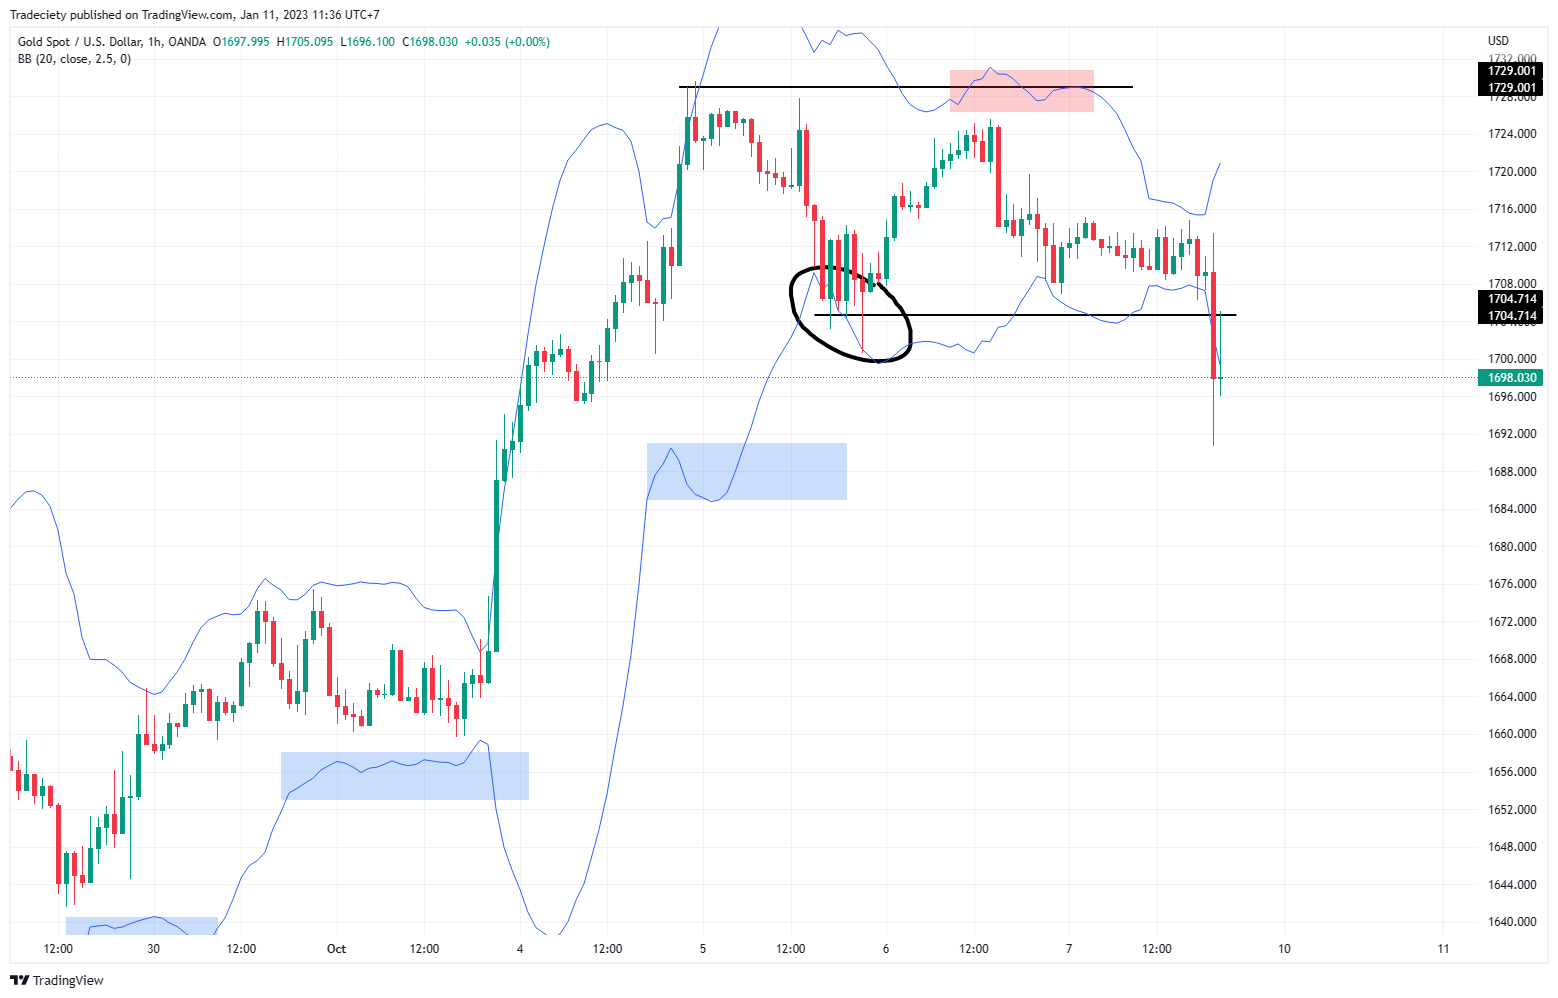
After the break, the market retested the horizontal line: support became resistance.
The new downtrend unfolded in an orderly manner.
Looking at the top, we can see a similar situation to the previous divergence example: the volatility increased as the market topped out. This is also one of the main dangers of being a reversal trader. Getting into new trends too early can expose you to significant price volatility. Such periods are extremely hard to trade because the price swings a lot.
It is, therefore, best to wait until the top has formed and you can see more signs that the new trend is underway. Don´t worry about missing the trend. It is much "safer" to wait for the low volatility trending action rather than trying to trade the chaotic market tops.
We can now use what we have learned in the previous two strategies and apply it to a different approach to trading market reversals.
Remember when I said that in an uptrend you typically see that the market is making higher highs and higher lows? This is important always to remember because as long as this pattern is in place, you should never go against the ongoing trend.
The screenshot below shows such a market in a strong bullish trend. We have no business going short here!
The first sign that a market changes its structure is when the price action makes its first lower low. In the screenshot below, the trend first made a double top; afterward, the price sold off strongly.
The size of trend waves can also tell you a lot. When you look left, the current trend wave is the strongest selling period we have seen in all the previous uptrend.
Changes in market and trend behavior are always worth noting!
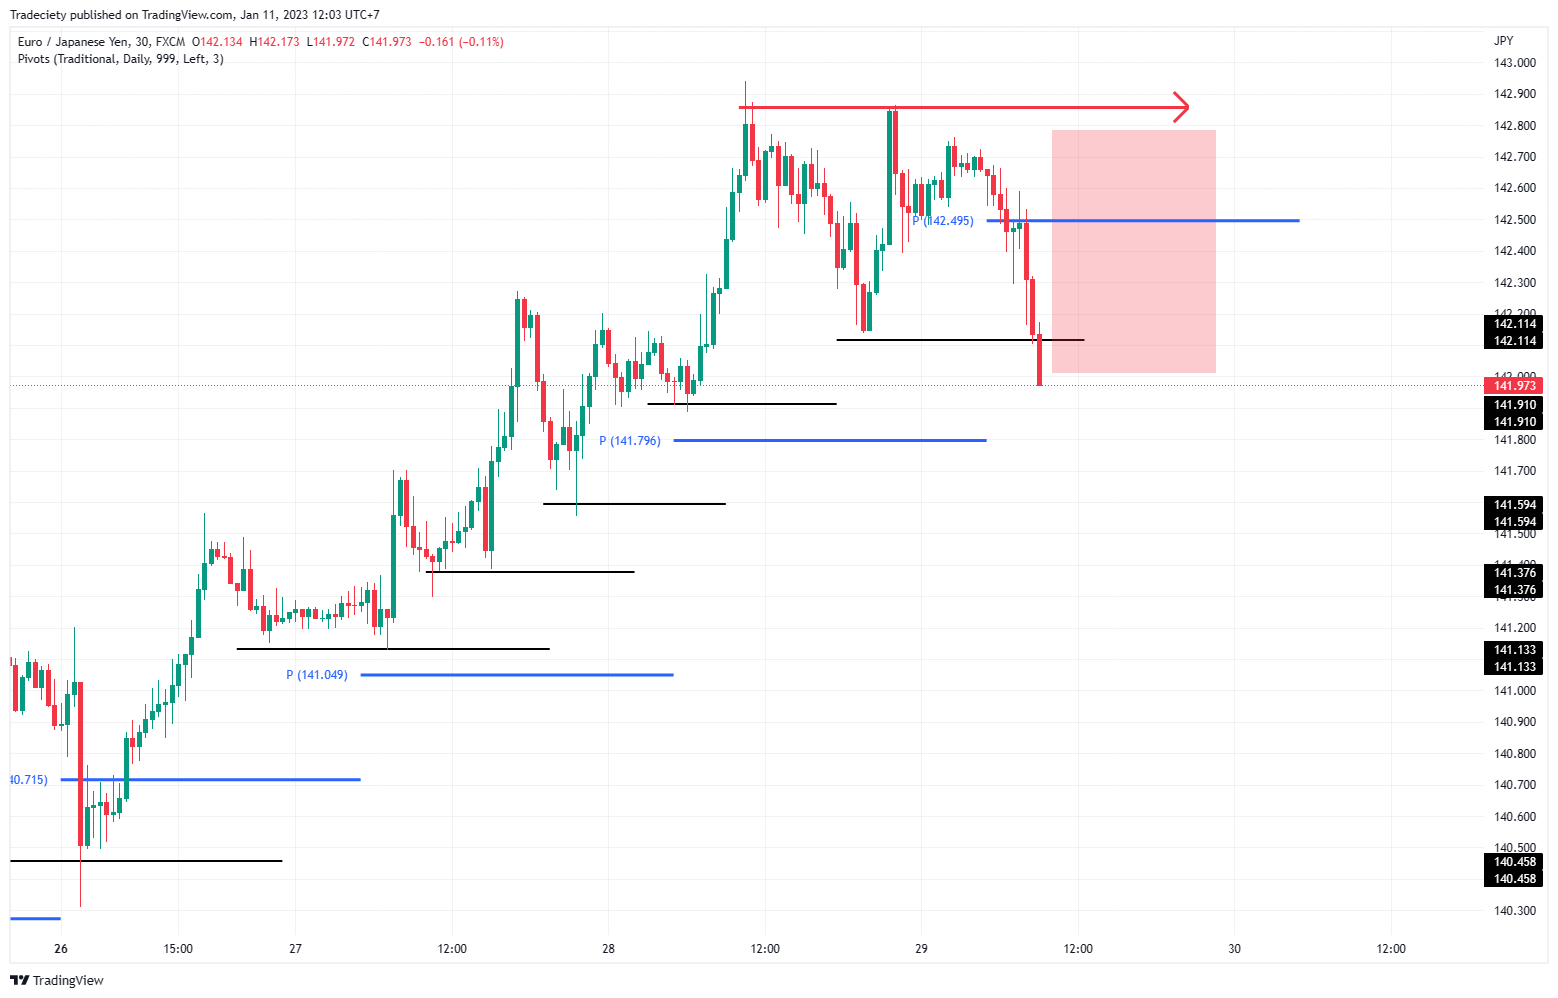
Once you start paying attention to market tops, you will notice that they have a tendency to pull back into the market top. I marked the potential pullback area with the red box below. The market sentiment remains mostly bearish as long as the pullback stays below the highest high (red arrow).
How deep the pullback is going to be we cannot know in advance.
I also activated the Daily central pivot point, a great support and resistance tool. You will often see that the price uses the pivot line during pullbacks as resistance.
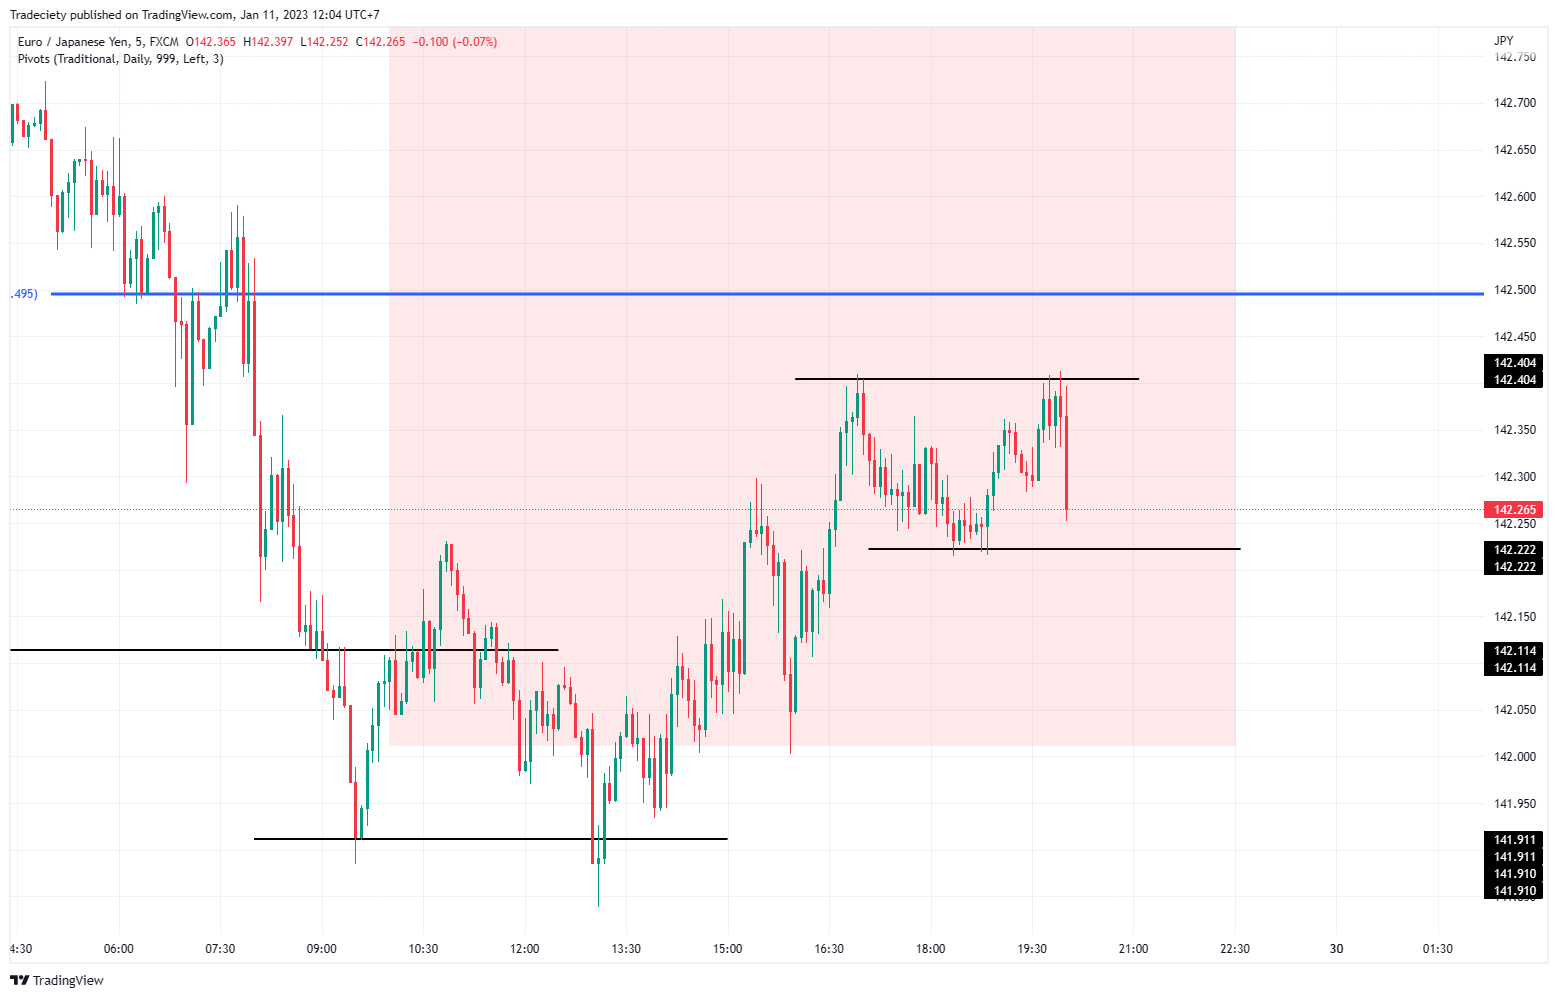
From here on, we can drop to a lower timeframe to time our entry. We go from the 30-minute timeframe to the 5-minute timeframe.
The 5-minute timeframe below shows the same trend pattern on a smaller scale. In trading we say that price is fractal; it does not matter which timeframe you are on because you will find the exact same patterns just on a different time scale.
In the 5-minute timeframe, the price is pulling back into the red zone. The trend pattern we have here now is also a double top. The price is still making higher lows though.
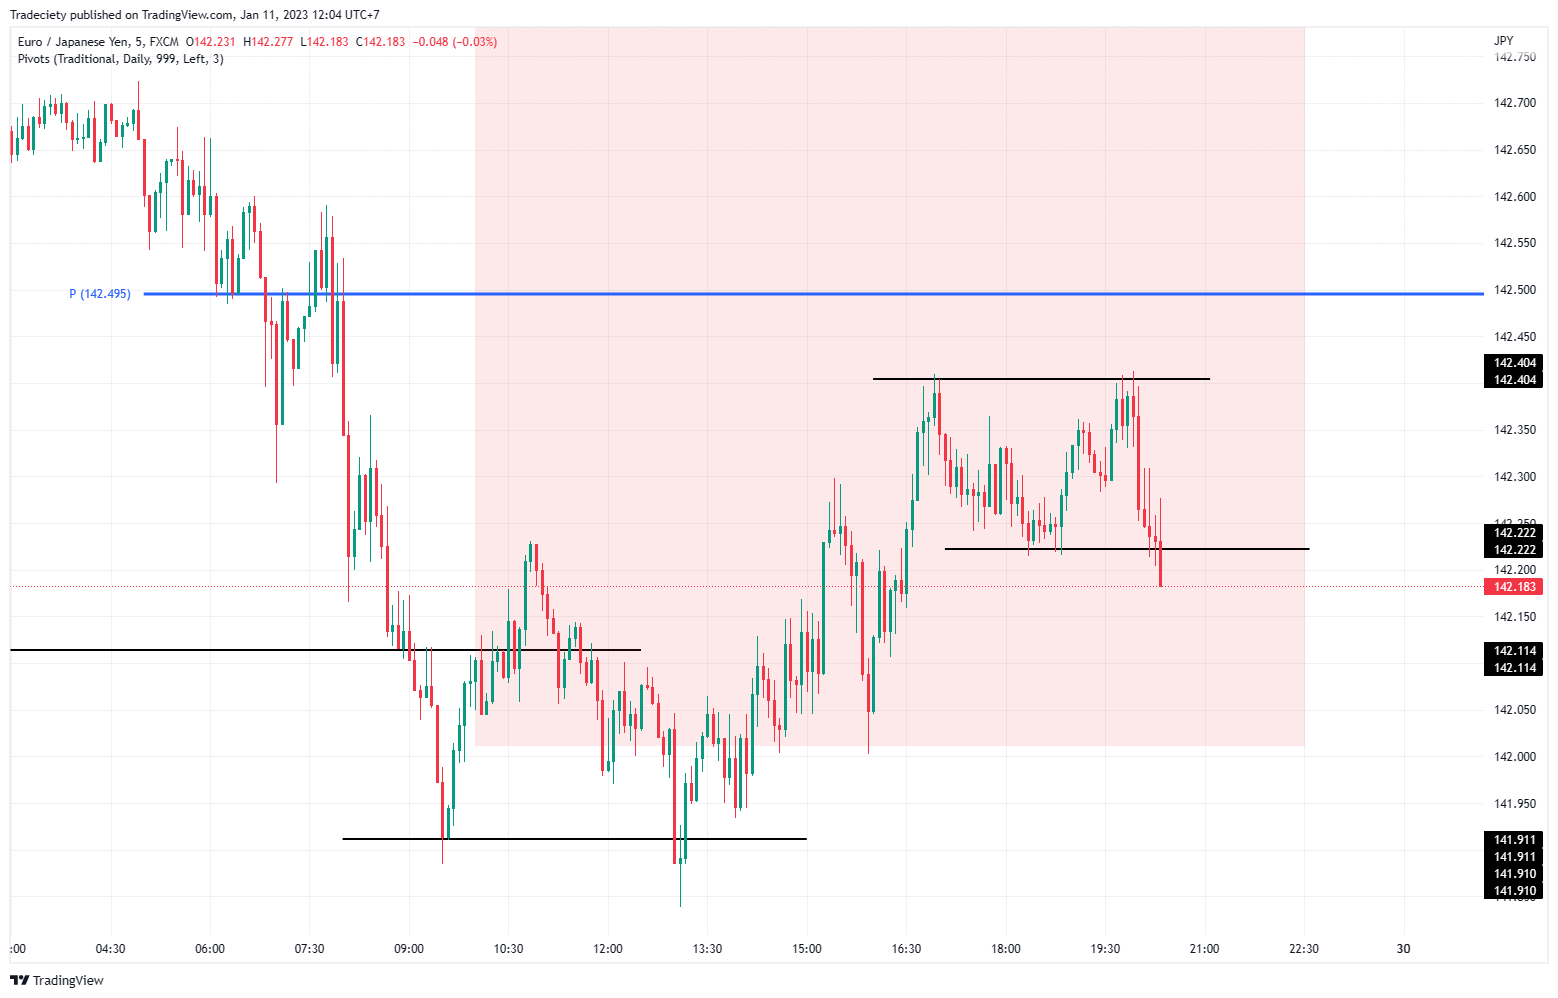
We apply the same approach on the 5 minutes and wait until the price makes a new lower low. This signals a momentum shift on the micro level. We can use such micro clues to time our entries. The benefit is that we can react much quicker to sudden market changes.
Being early in a trend allows us to get often a much higher reward:risk ratio by applying closer stops and capturing larger profits.
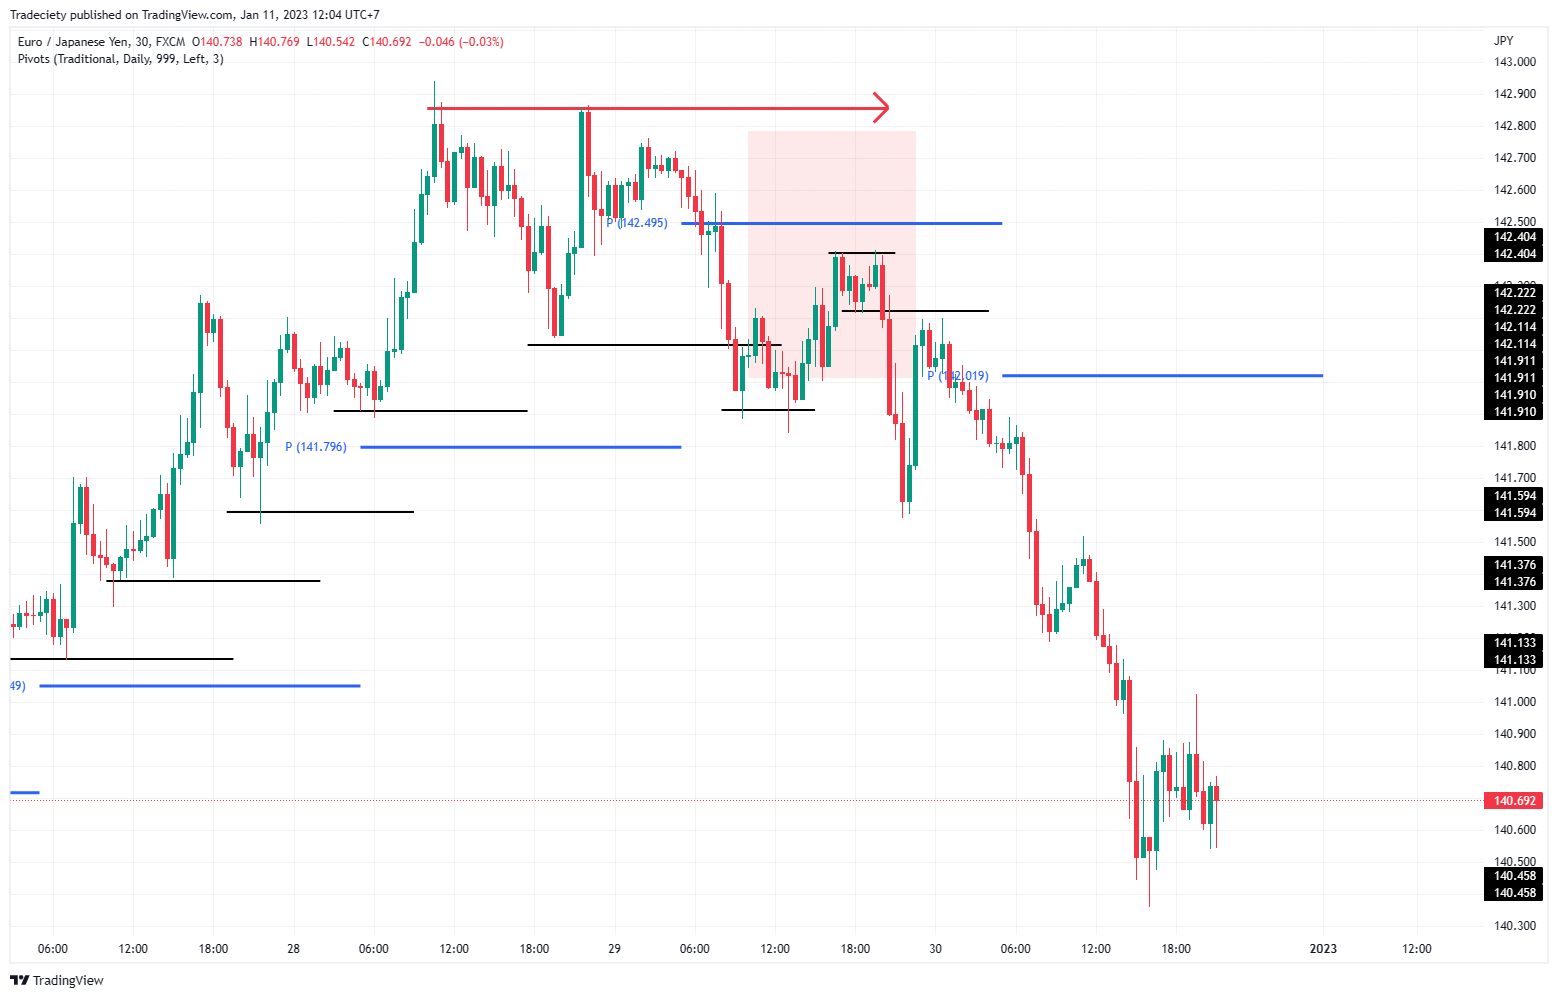
Zooming back to the higher timeframe, we can see where the price pulled back into the red zone and formed the double top. The bearish trend unfolded nicely afterward.
This approach may be slightly more aggressive since your entry is significantly earlier than the divergence and the Bollinger Band examples. The trade-off is, though, a potentially higher reward:risk ratio.
In trading, nothing is absolutely safe, and there is always a risk involved - no matter the trading strategy you choose.
However, the term reversal trading has a particularly bad reputation. The negative view on reversal trading is not justified.
The way reversal trading is presented here does not suggest that you short a market while the price is still going higher. This would, indeed, be reckless and very risky.
However, all three strategies have in common that we are waiting for strong signs that the ongoing trend is losing its power and that the price is moving in a new direction.
I don´t see those trading strategies as classic reversal strategies but as an approach to early new trend-following. Essentially, we are not trying to predict a market turn, but we wait for early signs that a previous trend is rolling in the opposite direction.
Is this trading strategy for you? I cannot guarantee that it is a perfect fit. But maybe you give it a try.
The discussed trading strategies will certainly help you look at reversals in a different light.

external link:


We have been trading supply and demand strategies for over ten years, and they have stood the test of time remarkably well. Supply and demand is...

3 min read
Choosing the right trading journal is essential for traders wanting to analyze performance, refine strategies, and improve consistency. In this...

3 min read
“95% of all traders fail” is the most commonly used trading related statistic around the internet. But no research paper exists that proves this...