Chart Patterns
 Learn the most important chart patterns with clear rules, real examples, and a simple framework you can repeat.
Explore continuation and reversal patterns and learn how to spot breakouts that fail before they cost you.
On this page:
![]() What are chart patterns?
What are chart patterns?
![]() Chart pattern mini course
Chart pattern mini course
![]() Trend continuation patterns
Trend continuation patterns
![]() Trend reversal patterns
Trend reversal patterns
![]() More chart pattern resources
More chart pattern resources
![]() Chart pattern FAQ
Chart pattern FAQ
 Chart patterns are recurring price structures that form when markets alternate between impulse (trend) moves and consolidation (range). Traders use these patterns to anticipate the next likely move which is either a trend continuation, a trend reversal, or a breakout attempt that fails.
Most chart patterns reflect simple market behavior: a pause after a strong move, a battle between buyers and sellers near a key area, and then a decision as price breaks out or breaks down. The highest-quality setups combine context (trend or range), a clear trigger, and a defined invalidation level for risk control. Chart patterns can be traded across markets and timeframes but they work best when they’re not treated as “shapes” alone.
Cup and Handle pattern
 The Cup and Handle pattern is a bullish trend continuation pattern that typically signals a strong upward movement. It was popularized by William J. O'Neil in his book "How to Make Money in Stocks" who allegedly realized a return of 5000% over 25 years.
This trend continuation pattern is primarily used in combination with volume analysis and forms after a significant price rally...
Triangle continuation
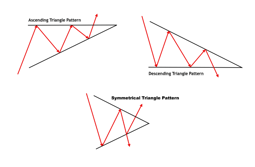 A triangle pattern is formed when a price range contracts over time, creating a triangular shape on the chart. This occurs as buying and selling pressures gradually converge. There are three primary types of triangles: symmetrical, ascending, and descending...
Bear and Bull flag
 Bull flags indicate a potential trend continuation of an uptrend, providing an entry point for long trades, while bear flags may foreshadow a downward trend continuation, signaling a selling opportunity. This article delves into the details of these patterns, explores their formation, and provides practical trading strategies...
5 continuation patterns
 Trend continuation patterns are chart formations that signal a temporary pause in a prevailing trend, suggesting that the trend will likely resume after the pattern completes. These patterns matter because they help traders spot opportunities to join a trend after a brief consolidation phase, improving entry timing and minimizing the risk of buying or selling at the wrong time...
How to trade breakouts
 Everyone can catch great trades when the market is trending nicely and just shoot in one direction. But markets spend a lot of time ranging and many traders often lose all their money during choppy range markets when they don’t know how to approach and trade them. In this article, I want to share principles and tips on dealing with and trading consolidations the right way...
Head and Shoulders pattern
 The head and shoulders pattern consists of three peaks: the left shoulder, the head, and the right shoulder. The left shoulder forms after a significant uptrend, followed by a price decline. The head is created when the price rises again to a higher peak, and then drops once more. Finally, the right shoulder forms when the price rises but fails to reach the height of the head, then declines again...
The bull trap
 How often did you experience a situation where a trade looked so obvious but then immediately reversed on you and you had to realize that you were, once again, entering at a very wrrong spot? A bull trap occurs when traders take a long position and then have price reverse and move lower very sharply. A bull trap occurs when traders take a long position and then have price reverse and move lower very sharply...
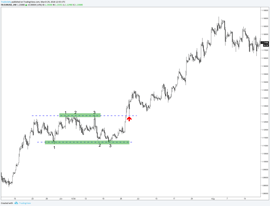
Liquidity grab pattern
 The chart below shows the EUR/GBP on the daily timeframe at the beginning of the week. The double-wick pattern above the green resistance area is a great signal on the higher timeframe. The two long wicks shooting through the resistance show a large interest in the currency pair and a temporary failure to continue the bullish move. The wicks are not enough to just jump into a trade right away but they are a good enough signal to start your trade planning on the lower timeframe...
Master any chart pattern
 A trader who knows how to find, understand and trade chart patterns will be able to navigate the financial markets effectively. Chart patterns are at the origin of all major price moves, they are the connection between trends and they are one of the most important market phenomena. In this article, you will learn everything there is about chart patterns and how to master them in your trading.
How to trade patterns
 Learning about pattern trading is a very important skill when it comes to technical analysis. The market spends the majority of its time going sideways and within those sideways phases, you’ll often be able to detect patterns...
Harmonic patterns
 Harmonic patterns form the basis of a method of analysis and trading. The foundation for harmonic chart patterns was laid down by H.M. Gartley, a financial analyst and author who published the first developments of this unique approach in his 1932 book, Profits in the Stock Market...
The Wolfe wave
 Wolfe waves are made out of a number of subsequent chart waves that form a very distinct pattern. The Wolfe wave pattern is named after a trading guru called Bill Wolfe. He identified that when price action remains within a price channel and makes a false breakout on the fifth wave, it usually starts a reversal of the prevailing trend in the opposite direction...
If you want a structured introduction to chart patterns, start here. This free 1-hour course covers pattern recognition, continuation vs reversal logic, and the context rules that separate high-quality setups from random “shapes.”
In this course you’ll learn:
![]() How to classify patterns: continuation, reversal, and breakout structures.
How to classify patterns: continuation, reversal, and breakout structures.
![]() What makes a pattern valid (context, levels, and compression).
What makes a pattern valid (context, levels, and compression).
![]() Simple breakout and retest rules.
Simple breakout and retest rules.
![]() How to spot common pattern failures and fakeouts.
How to spot common pattern failures and fakeouts.
How to use it: Watch it once for the full framework, then explore the guides below by pattern type.
.png?width=64&height=64&name=icons8-trading-64%20(1).png)
Price Action
Read price clearly with candlesticks, key levels, and practical entry triggers.
Top guides: Supply and demand trading · Trendline trading guide

Chart Patterns
Learn continuation and reversal patterns, breakout rules, and how to spot fakeouts early.
Top guides: Cup and Handle · Triangle pattern guide

Market Structure
Understand trends and ranges using swing structure, breaks, and regime shifts.
Top guides: Elliot wave analysis

Trading Indicators
Use indicators such as moving averages, RSI, volatility tools, and simple filters.
Top guides: Moving Averages · Bollinger Bands

Risk Management
Build consistent risk rules with position sizing, stop placement, and reward-to-risk planning.
Top guides: Reward to risk ratio · Position sizing
.png?width=64&height=64&name=icons8-mind-64%20(1).png)
Trading Psychology
Improve execution by fixing common mistakes, managing emotions, and building discipline.
Top guides: Why 95% of traders fail

Trading Strategies
Explore proven strategy types—breakouts, pullbacks, trend following, and mean reversion.
Top guides: 3 trendline strategies · Day trading strategies

Trading Process & Improvement
Develop consistency with journaling, reviews, metrics, and a repeatable trading routine.
Top guides: Best trading journal · Backtesting guide