Supply and Demand Trading in 2026
We have been trading supply and demand strategies for over ten years, and they have stood the test of time remarkably well. Supply and demand is...
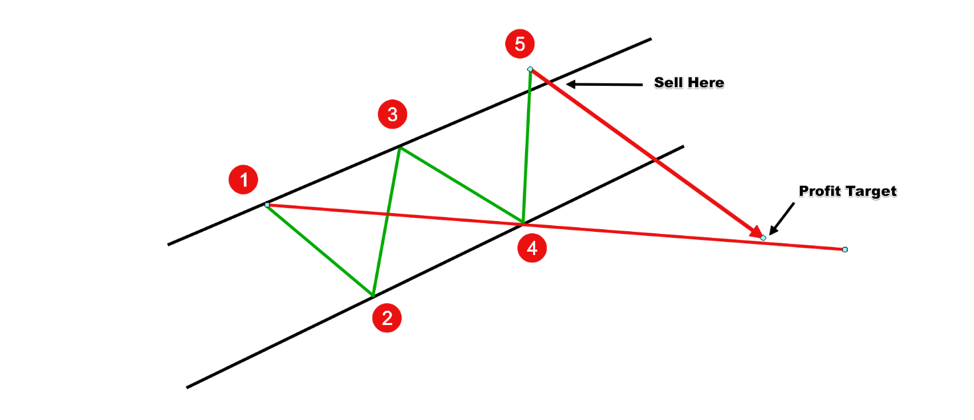
Wolfe waves are made out of a number of subsequent chart waves that form a very distinct pattern. The Wolfe wave pattern is named after a trading guru called Bill Wolfe. He identified that when price action remains within a price channel and makes a false breakout on the fifth wave, it usually starts a reversal of the prevailing trend in the opposite direction.
He clarified that Wolfe waves can help traders find a terrific entry point in the market at the beginning of a potential reversal with a great reward to risk ratio. Moreover, it can also pinpoint a potential exit point or offer traders a price target based on the symmetric configuration of the price pattern.
The first step in identifying a Wolfe waves pattern is finding a price channel.
Any seasoned trader would know that price never moves straight up or goes straight down. If we zoom within a daily timeframe Candle, we can see that the price on the hourly chart formed smaller waves that made up the bullish or bearish Candle. So, in an uptrend, the price can go up, retrace a bit, then resume the trend, and make a new high and it would follow a similar reverse pattern in a downtrend.
Drawing price channels around these waves of price actions can help traders identify the boundaries of the trend. The bottom line is that with price channels, traders can have a visual understanding of the underlying structure of a trend. It helps them extrapolate or forecast how the price will likely move in the near future.
There are different types of price channels, but for trading Wolfe waves, we need to focus on something called an Equidistant Channel.
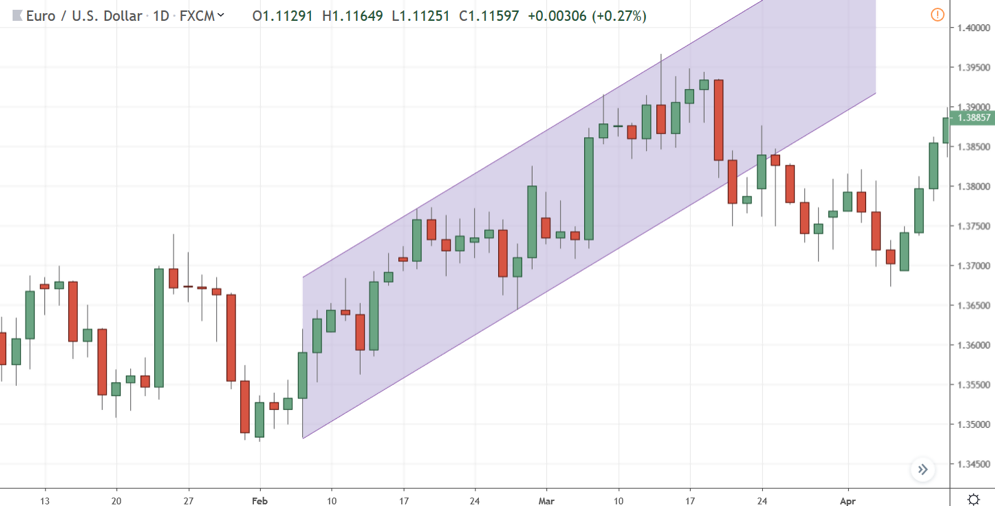
Figure 1: Example Bullish Equidistant Price Channel
As you can see in figure 1, the Equidistant Channel is just two parallel trend lines that define the boundaries of an ongoing trend.
Traders can easily identify a Wolfe waves pattern once they have successfully identified a parallel price channel. However, in order to identify a bona fide Wolfe waves pattern, you need to keep a few rules in mind. Let’s try to understand how to properly identify a Wolfe waves pattern with the example illustrated in figure 2 and 3 below.
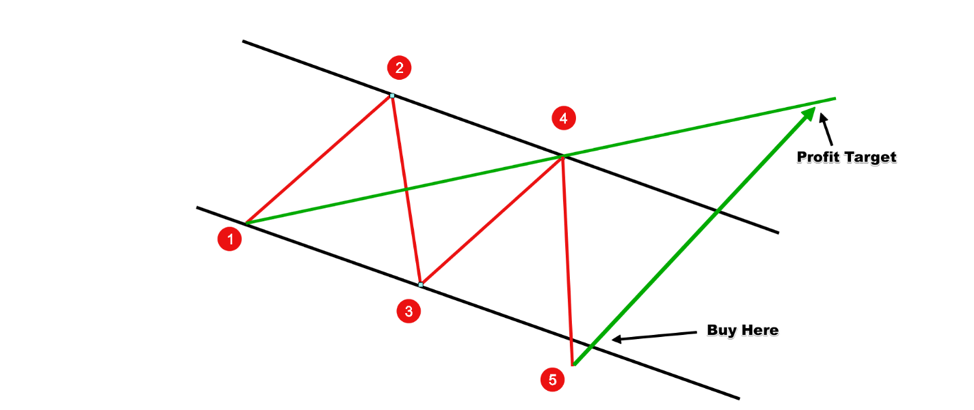
Figure 2:Bullish Wolfe Waves Pattern
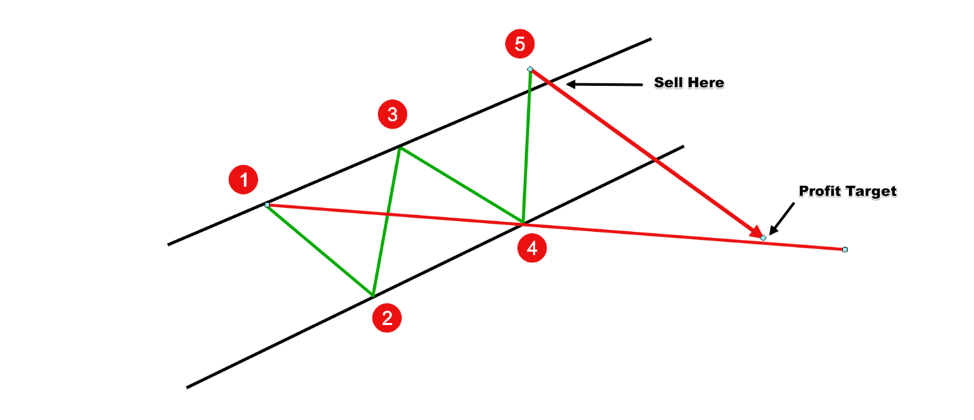 Figure 3: Bearish Wolfe Waves Pattern
Once you have a bar that comes back within the existing channel after a false break out, you can conclude that a Wolfe waves pattern has formed. At this point, you can consider taking a position in the opposite direction of the channel.
While it is counterintuitive to trade against the trend, the whole point of Wolfe waves pattern is that it is a reversal pattern. Also, getting into the market against the trend at the very beginning is part of the reason traders love to trade with the Wolfe waves reversal pattern as it offers an extremely high reward to risk ratio trades.
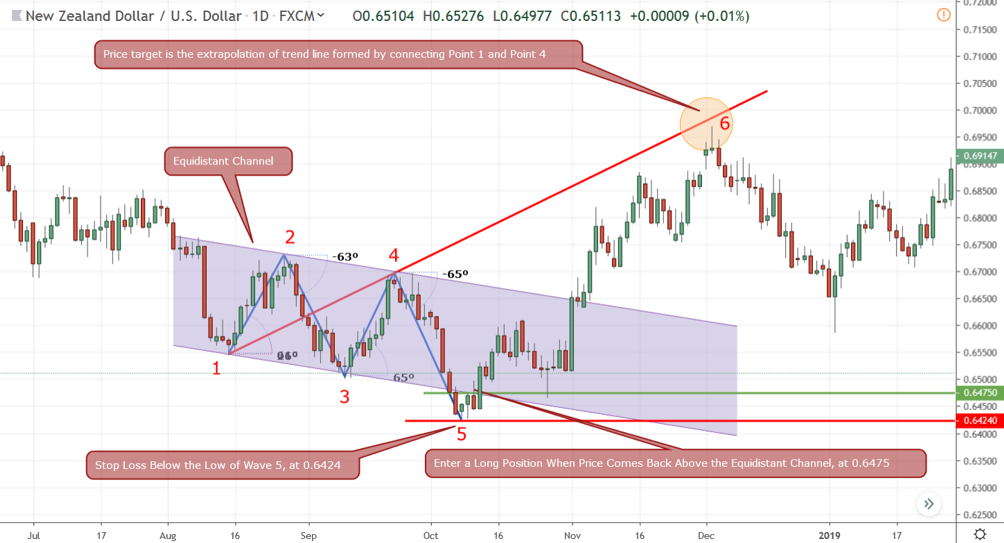
Figure 4: Bullish Signal Generated by the Wolfe Waves Reversal Pattern
In figure 4, we can see that the NZD/USD has formed a downward Equidistant Channel with a number of subsequent price waves contained within the two parallel downward sloping trend lines. The Wolfe waves pattern started to form from Point 1, when it went up to Point 2. In this example, once you see a clearly defined Point 3, draw the Equidistant Channel that should extrapolate Point 4 way before the price has reached it.
If we see the price of the asset remaining within the Equidistant Channel, there is potential that we might see that a Wolfe waves pattern might form. For that to happen, the next wave from Point 4 to Point 5 must break below the lower trend line of the Equidistant Channel, and on this occasion, it did just that.
Once the price of NZD/USD went back and broke above the lower trend line of Equidistant Channel, at 0.6475, we would have taken a long position.
In figure 2, the low of the fifth wave, from Point 4 to Point 5, was at 0.6424. Hence, we would have set a stop loss order at 0.6424 or 51 pips.
Now the fun part! The best aspect of Wolfe waves pattern is finding the price target by drawing a trend line that connects Point 1 and Point 4. In figure 2, the extrapolation of this trend line extended above 0.7000. After we got into the trade at 0.6475, over the next several weeks, the NZD/USD price continued the bullish move and broke above the upper channel of the Equidistant Channel in the process, ending up reaching near Point 6, which was very close to the extrapolated trend line of Point 1 and Point 4.
Identifying a Wolfe waves pattern and trading based on the false breakout reversal signal can result in some high reward to risk trades if the price breaks in the opposite side of the channel. However, the key is to pay attention to the symmetry of the Wolfe waves and the slope of the Equidistant Channel. The higher the slope of the channel, the better the chance of a complete reversal of the trend.

We have been trading supply and demand strategies for over ten years, and they have stood the test of time remarkably well. Supply and demand is...

3 min read
Choosing the right trading journal is essential for traders wanting to analyze performance, refine strategies, and improve consistency. In this...

3 min read
“95% of all traders fail” is the most commonly used trading related statistic around the internet. But no research paper exists that proves this...