3 min read
Scientist Discovered Why Most Traders Lose Money – 24 Surprising Statistics
“95% of all traders fail” is the most commonly used trading related statistic around the internet. But no research paper exists that proves this...
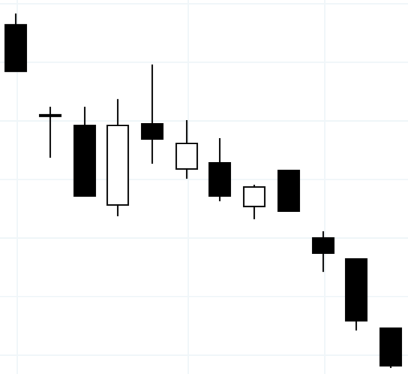
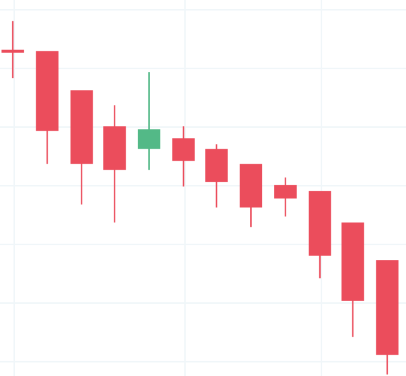
There are times when seeing a lot of detail can lead to a more enhanced and nuanced interpretation. But there are other times when seeing too much detail is tantamount to seeing nothing at all.
Take a look at the (much feared and avoided) lumber futures chart below.
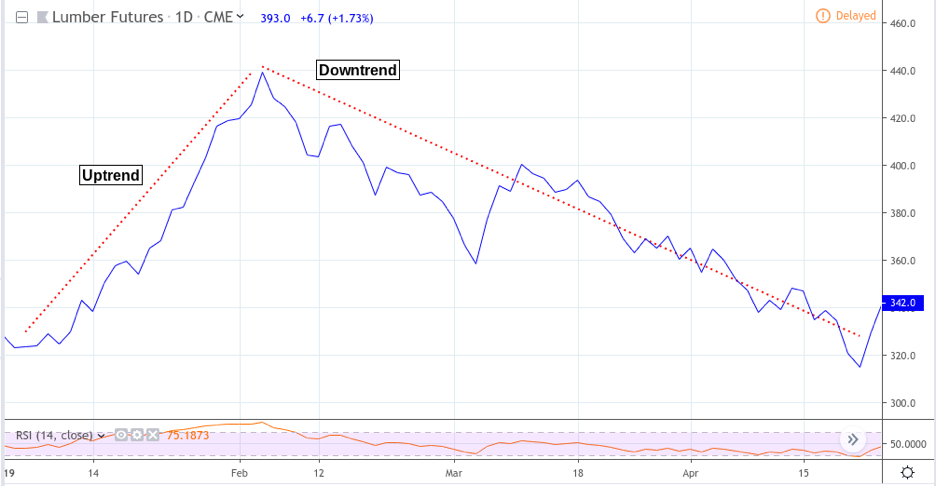
This chart looks fairly easy to interpret, as there are only two major movements taking place–a sharp uptrend and a longer downtrend with a 0.5 Fib retracement half way through.
But because line charts erase opening, high, and low points in addition to any trading gaps that might have occured, this chart may be filtering out some crucial information that might be critical to a trader’s decision-making process.
If you had to trade off this chart, it would be very difficult to get deeper insight into market sentiment and nearly impossible to set detailed entry or exit points based on support, resistance, and retracements.
So, let’s pull up a traditional candlestick chart in order to see price action in much greater detail.
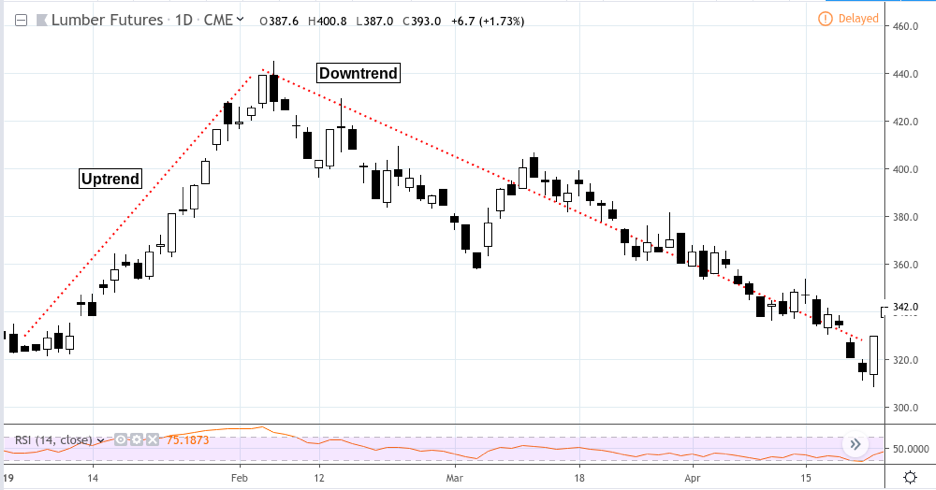
Now you can see the open, high, low, and close of each trading session. You can clearly see which days were bullish and which were bearish.
In retrospect, it’s easy to see the general trend. But imagine having to make trend-based decisions after each session (an up day followed by a down day). If you were simply following the swing highs and lows (assessing trend according to 3S or 1-2-3 patterns), then it might have been relatively easy to follow.
But what if you were able to confirm your trend bias with a chart that showed (end of day) the major trend based on an average calculation of price including opening, high, low and close? And what if the directional bias were represented via color in a more orderly fashion?
It might look something like this:

The two words that might best describe this price chart in comparison with the previous two are detailand clarity.
These are two beneficial characteristics of Heikin Ashi Candlesticks.
Let’s compare how both forms of candlestick charting represents price action. How did this…
…become this?
Apparently, the trend direction is much clearer in the Heikin Ashi (second) example.
But to understand how this chart filters prices in order to present a clearer trend bias, it’s best to understand how the chart is formulated. Let’s take a closer look.
Heikin Ashi Open = (Open of previous bar + Close of previous bar) / 2
Heikin Ashi High= Highest of High, Open, or Close
Heikin Ashi Low= Lowest of Low, Open, or Close
Heikin Ashi Close= (Open + High + Low + Close) / 4
Note that the smoothing operation is due to the averaging-out of various price levels. This means that actual price movements will occur around the represented price.
Caveat:
When using heikin ashi, you can treat it the same way as you would a traditional candlestick chart. The difference is that prices have been smoothed-out to reflect directional bias.
As with candlesticks, you might use chart patterns with a heikin ashi, but your view might be better informed by the consistency in the color coding, which may indicate reversal bars more clearly, sometimes more accurately.
Traditional Candlesticks
Heikin Ashi Candlesticks
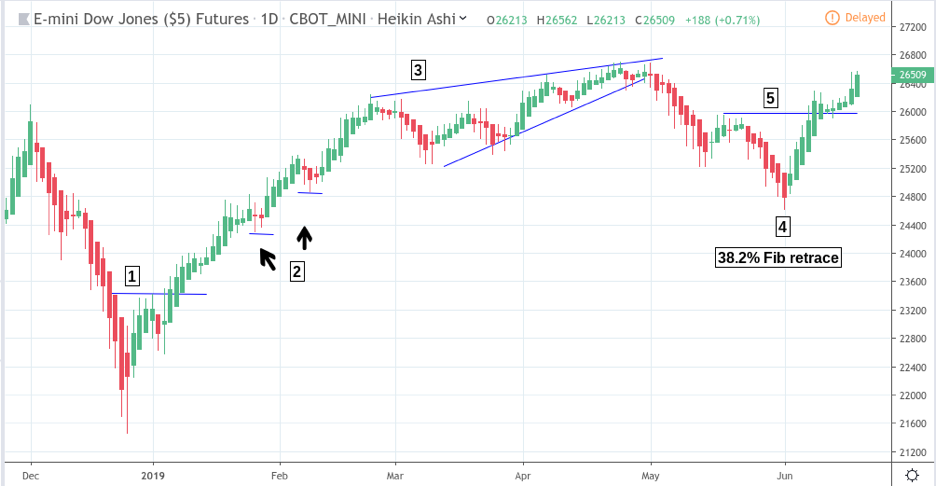
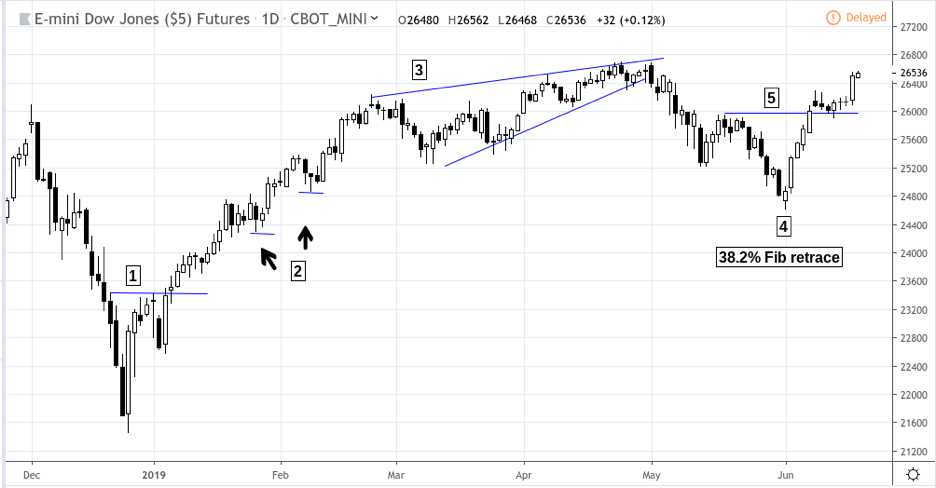
For instance, in the YM chart above, the consistency in color coding might have added clarity to the V bottom and breakout at [1].
The swing low support lines at [2] are emphasized a bit more clearly, and the bullish/bearish lines in the rising wedge at [3] are a bit less noisy as compared with its traditional candlestick counterpart.
You will also note that the 38.2% retracement at [4] is just as clear as the traditional candlestick version, but that the directional bias upon the breakout at [5] has filtered-out the bearish candles which might (or might not) have indicated a potential weakening post-breakout.
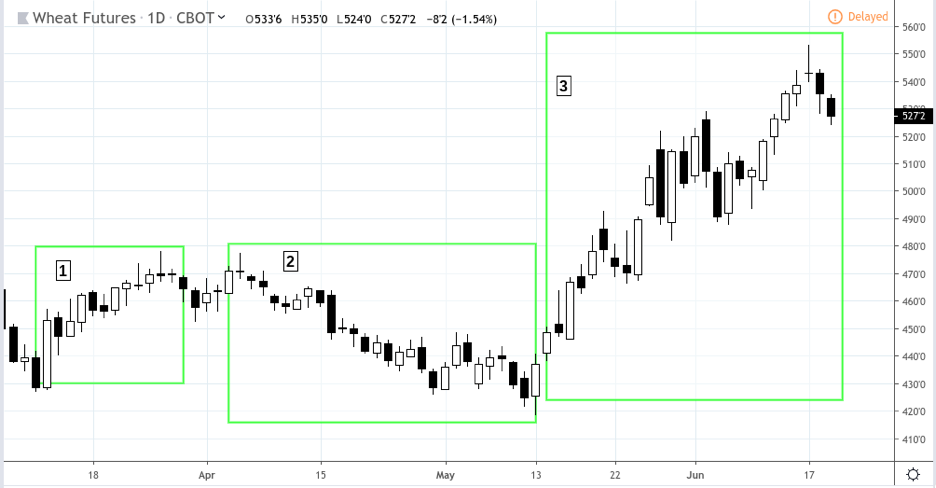
Let’s take a look at the ZW (wheat futures) chart and parcel out the main lines of movement.
If the devil is in the details and the insight in the nuance, then how might a traditional vs heikin ashi candlestick chart affect the way you see and interpret price movement?
Traditional Candlesticks
Heikin Ashi Candlesticks
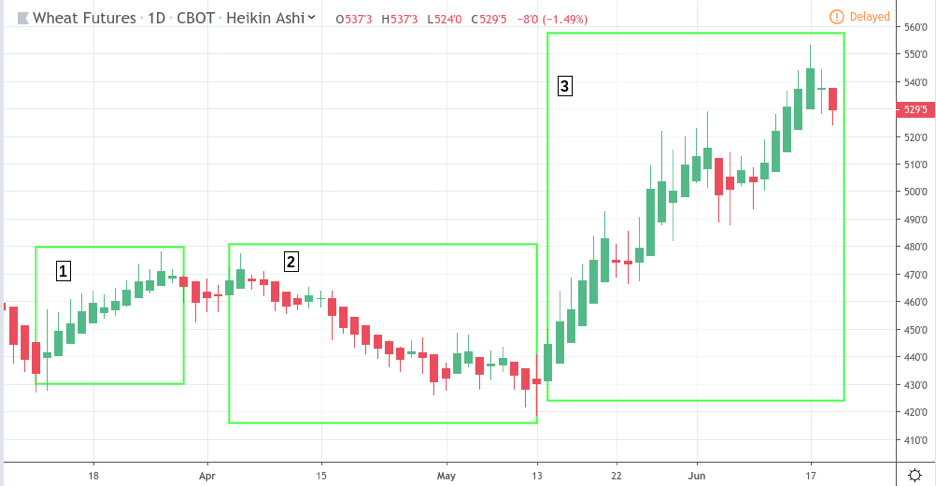
The heikin ashi’s rendering of spatial order and color sequences provide greater clarity in boxes [1] and [3]. Box [2], though still clear, contains more counter-movement.
At this point you’d have to ask yourself whether the heikin ashi candles might provide greater interpretive clarity when making trading decisions, or whether it would serve as a biased distraction.
For traders who find the filtering effect of these nuances beneficial, heikin ashi candlesticks may provide a versatile means–if only as a second-looktool–to interpret directionality in a manner that compliments traditional chart pattern analysis.
Perhaps this is the most useful aspect of the chart: a way to see price patterns from a more directional angle, a way to take an “x-ray” (however biased) of a pattern’s trajectory at the expense of some movement, and a means to minimize detail in order to derive an essential representation of trend.


external link:


3 min read
“95% of all traders fail” is the most commonly used trading related statistic around the internet. But no research paper exists that proves this...

3 min read
Trendlines can be great trading tools if used correctly and in this post, I am going to share three powerful trendline strategies with you.

3 min read
Choosing the right trading journal is essential for traders wanting to analyze performance, refine strategies, and improve consistency. In this...