Trading Indicators
 Learn how trading indicators work and how to use them in a clean, practical way.
This hub organizes our best indicator guides, from the most popular tools like moving averages, RSI, MACD, ATR, and Bollinger Bands to real-world ways traders apply them.
On this page:
![]() What are indicators?
What are indicators?
![]() Core indicator guides
Core indicator guides
![]() More indicator guides
More indicator guides
![]() Indicator strategy guides
Indicator strategy guides
![]() Tips for trading with indicators
Tips for trading with indicators
![]() Price action FAQ
Price action FAQ
 Indicators are tools that transform price, volume, or volatility data into a clearer signal you can interpret quickly. Instead of relying on intuition, indicators help you measure specific market characteristics such as direction (trend), strength (momentum), and conditions (volatility). That makes them useful for building repeatable trading rules, filtering low-quality setups, and standardizing decisions.
The key to using indicators well is to keep their purpose simple. Each indicator should answer one question: Is the market trending or not? Is momentum strengthening or fading? Is volatility expanding or contracting?
When you use indicators as supporting measurement tools rather than as “magic signals” they become a practical part of a structured trading process.
Moving Averages
 Price can be volatile at times and hard to read. That's where moving averages come in! They're a super popular trading indicator used by many of the best traders of all time, but using them right can be tricky. This article will cut through the confusion and show you exactly what you need to know. We'll cover picking the perfect moving average for your trades, and powerful ways to use them to make smarter decisions...
RSI - Relative Strength Index

The Relative Strength Index, or RSI indicator is among the most popular indicators used by traders. The RSI provides information about the strength of the price movements on your charts, hence the name. In this article, we will learn what the RSI really does, how to understand the information it provides and how to use it in our trading...
The MACD
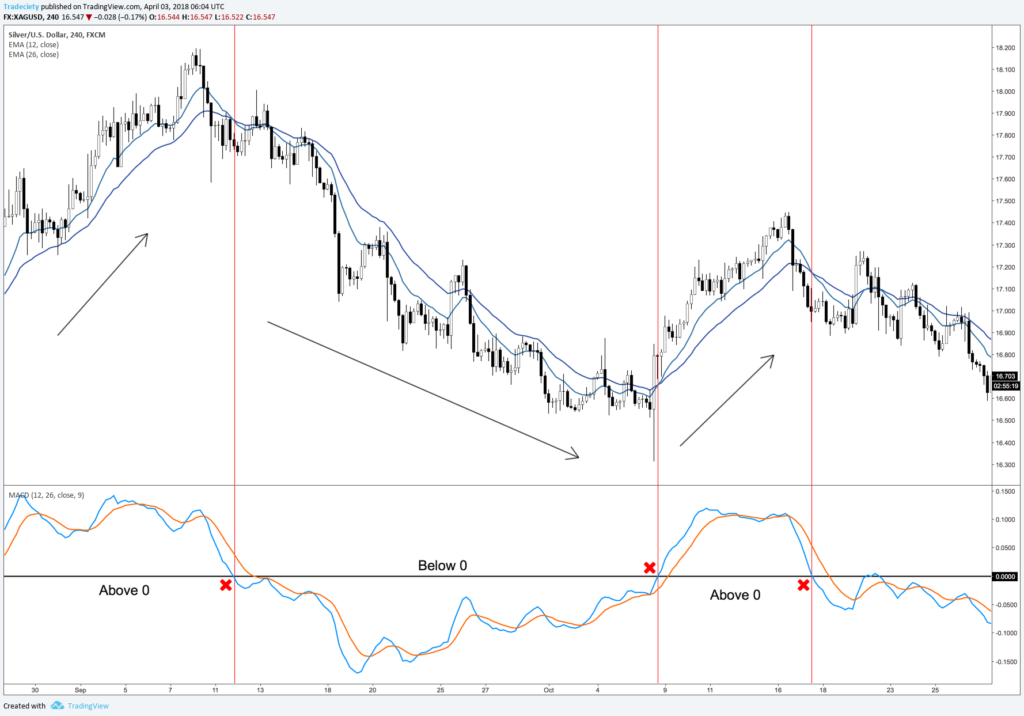
The MACD indicator is a popular momentum and trend-following indicator that is based on the information of moving averages and, thus, is ideal to act as an additional momentum tool and momentum filter for your trading...
Bollinger Bands ®
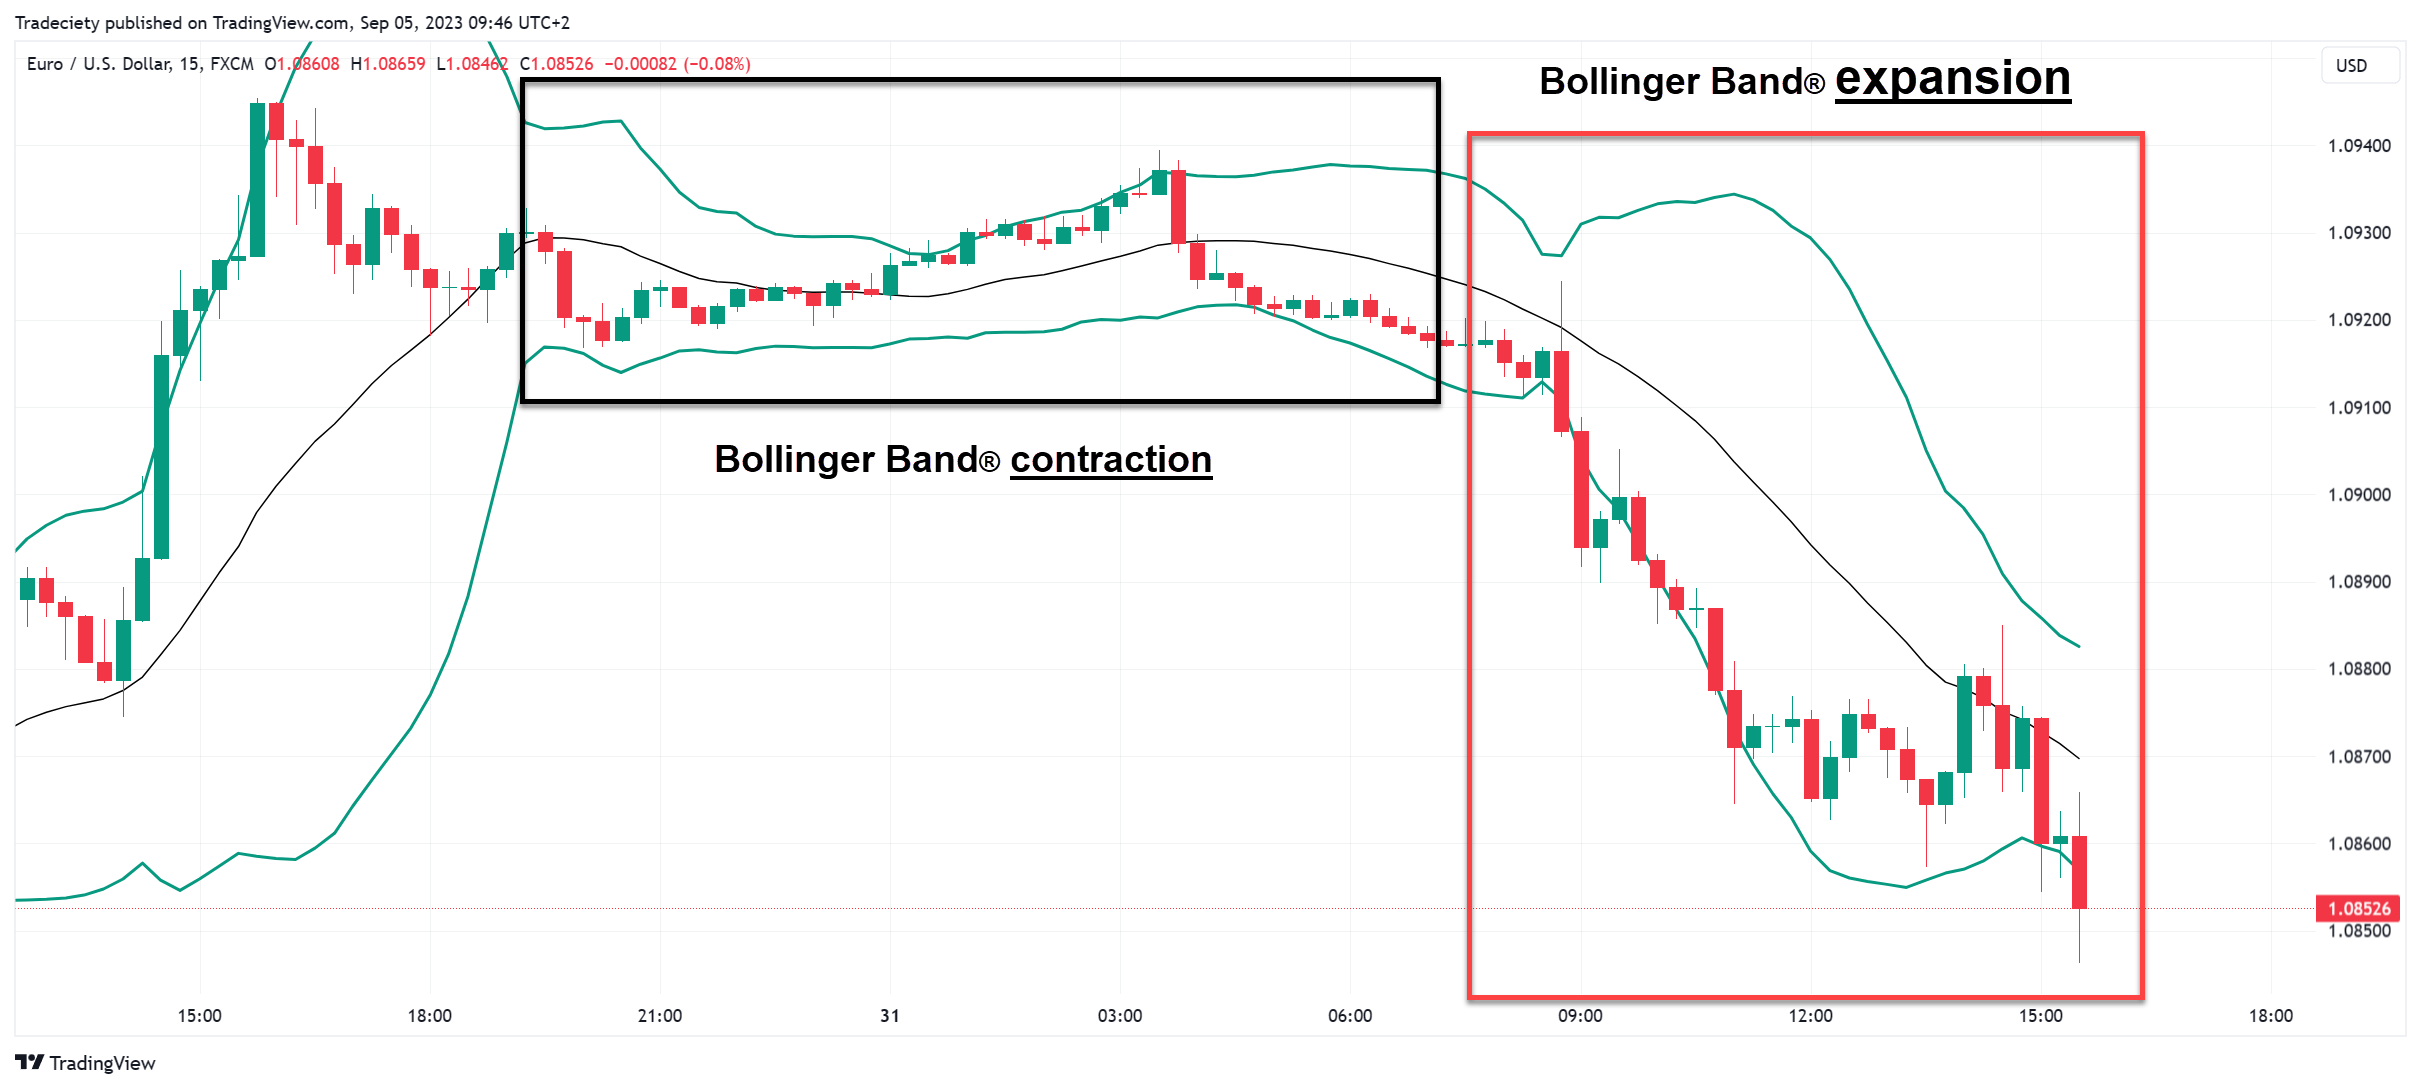
The Bollinger Bands® indicator is among the most reliable and powerful trading indicators traders can choose from. Bollinger Bands® can be used to read the trend strength, to time trade entries, ride trending markets, and find potential market tops for reversal trading. The Bollinger Band® indicator is not a lagging indicator because...
ATR - Average True Range
 The Average True Range indicator (ATR) is a trading indicator that can be used in many different trading situations. The ATR may be beneficial for trend-following trading, improve your understanding of market behavior, and may even help to optimize target placement to improve a trader´s winrate. This guide will first explain the idea behind the ATR indicator and then explore the different use cases...
The Stochastic

The STOCHASTIC indicator is among the most popular trading indicators and rightfully so. The STOCHASTIC indicator is a great momentum and trend-following indicator. It can assist traders in understanding trend dynamics and improve their chart reading. However, I am always astonished that many traders don’t really understand...
ADX indicator
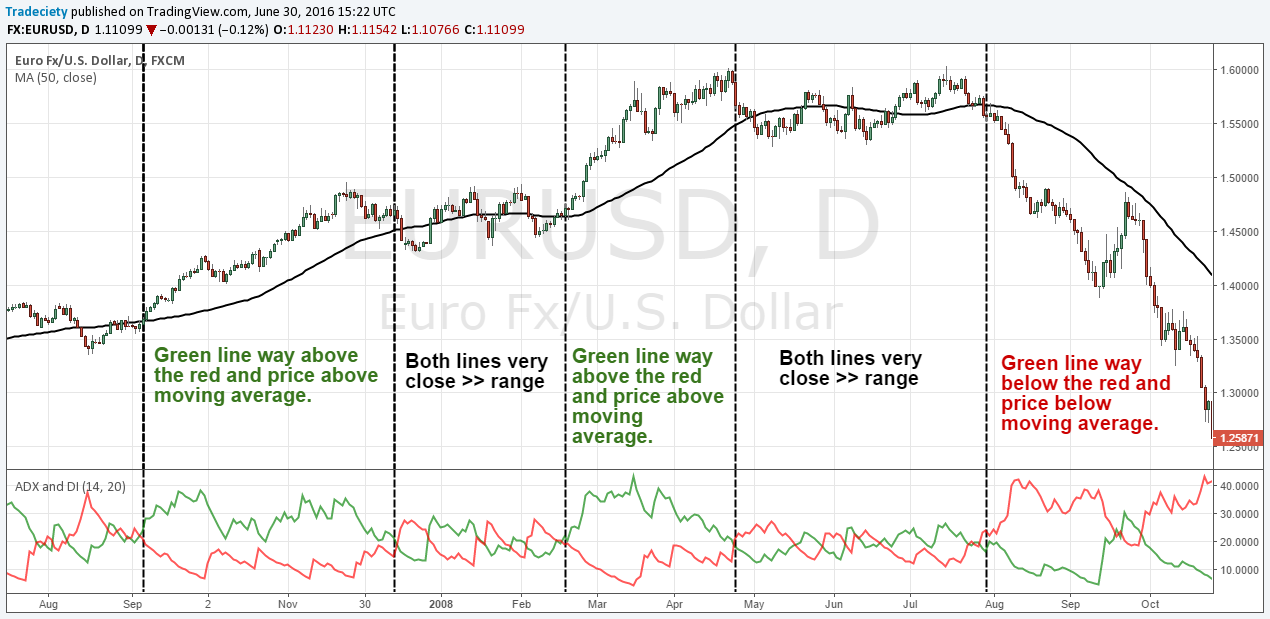
The ADX indicator is a popular trend indicator and it provides information about momentum and trend strength. In this article, we will dissect the individual components of the ADX and explore step by step how to use them to make sense of charts and find trading opportunities...
Ichimoku Cloud
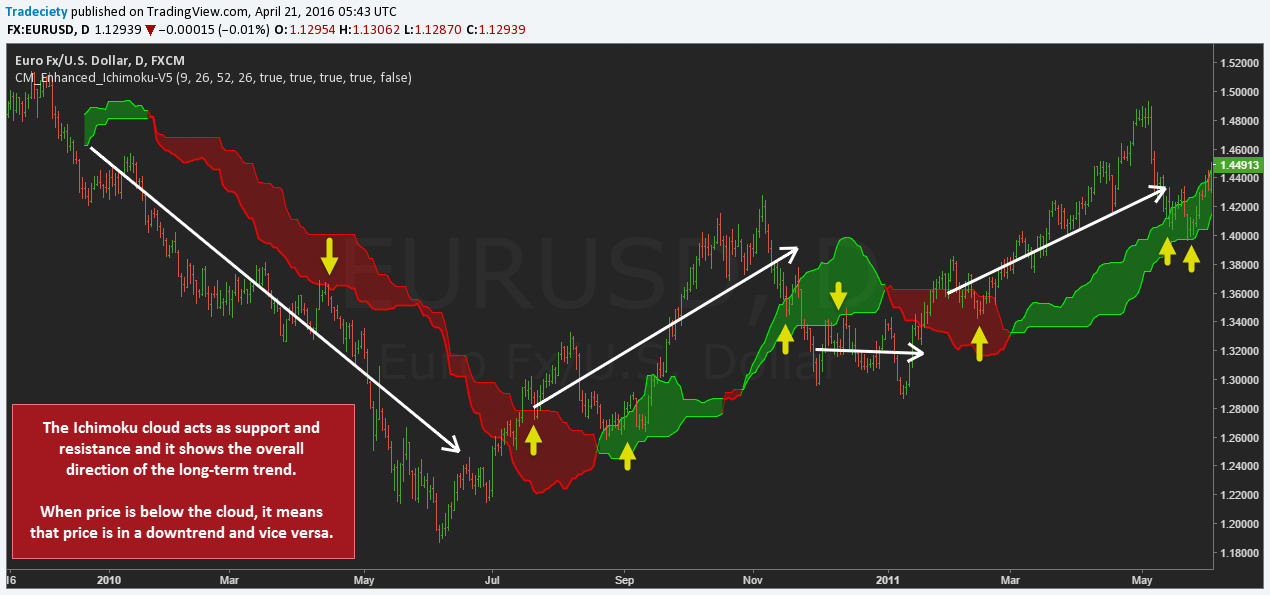
The Ichimoku indicator is an all-in-one indicator that provides information about support/ resistance, trend direction and momentum all at the same time. The Ichimoku indicator is a potent trading tool, but many traders feel overwhelmed when looking at all the lines...
VWAP
 Among the many available indicators, the VWAP indicator—or Volume Weighted Average Price—is particularly popular for day trading. By analyzing price movements, volume, and market trends, the VWAP can offer valuable insights into when to buy or sell. It’s a key tool that blends both price and volume, giving traders a clearer picture of an asset's average trading price throughout the day...
Donchian channel

The Donchian channel is a trend-following indicator which has been heavily used by the infamous Turtle traders. The Donchian channel measures the high and the low of a previously defined range – typically of the past 20 days. The screenshot below shows the channel on Apple with a 20-day range where it marks the highs and lows of a 20 day period...
How to combine indicators

When it comes to indicators, we can divide them into three classes:
-
momentum indicators
-
trend-following indicators
-
volatility indicators
Knowing which one belongs to which category, and how to combine the best indicators in a meaningful way can help you make much better trading decisions. On the other hand, combining indicators in a wrong way can lead to a lot of confusion, wrong price interpretation and, subsequently, to wrong trading decisions. Not good...
Fibonacci tool

The Fibonacci is a universal trading concept that can be applied to all timeframes and markets. There are also countless Fibonacci tools from spirals, retracements, Fib time zones, Fib speed resistance to extension...
Trading divergences
 Although indicators are somewhat lagging – just like price action is lagging too – when it comes to divergences, this lagging feature is actually going to help us find better and more reliable trade entries as we will see below. Divergences can not only be used by reversal traders but also trend-following traders can use divergences to time their exits...
Parabolic SAR
 The Parabolic SAR indicator is a price AND time based trend-following indicator. SAR stands for “stop and reverse”. The Parabolic SAR is one of the more complex trading indicators when it comes to the underlying calculations but in this article, you will learn exactly what it is that the SAR does...
Keltner channel
 Although many traders believe that there is no difference between the Bollinger Bands® and the Keltner Channel, there is! Although they look similar, it is very important to know about the differences. Here is what the Keltner Channel does:
If you want a structured introduction to price action, start with our free Price Action Trading Course on YouTube.
In about an hour, you’ll learn how to read charts with clarity. From candlestick behavior and price patterns, to trend analysis and practical trade execution.
It’s a practical walkthrough you can apply across markets and timeframes.
In this course you’ll learn:
![]() How to read candlesticks and use comment candle triggers.
How to read candlesticks and use comment candle triggers.
![]() How to identify trends and understand market structure.
How to identify trends and understand market structure.
![]() How to spot breakouts and pullbacks.
How to spot breakouts and pullbacks.
![]() How to combine price action into simple strategies.
How to combine price action into simple strategies.
.png?width=64&height=64&name=icons8-trading-64%20(1).png)
Price Action
Read price clearly with candlesticks, key levels, and practical entry triggers.
Top guides: Supply and demand trading · Trendline trading guide

Chart Patterns
Learn continuation and reversal patterns, breakout rules, and how to spot fakeouts early.
Top guides: Cup and Handle · Triangle pattern guide

Market Structure
Understand trends and ranges using swing structure, breaks, and regime shifts.
Top guides: Elliot wave analysis

Trading Indicators
Use indicators such as moving averages, RSI, volatility tools, and simple filters.
Top guides: Moving Averages · Bollinger Bands

Risk Management
Build consistent risk rules with position sizing, stop placement, and reward-to-risk planning.
Top guides: Reward to risk ratio · Position sizing
.png?width=64&height=64&name=icons8-mind-64%20(1).png)
Trading Psychology
Improve execution by fixing common mistakes, managing emotions, and building discipline.
Top guides: Why 95% of traders fail

Trading Strategies
Explore proven strategy types—breakouts, pullbacks, trend following, and mean reversion.
Top guides: 3 trendline strategies · Day trading strategies

Trading Process & Improvement
Develop consistency with journaling, reviews, metrics, and a repeatable trading routine.
Top guides: Best trading journal · Backtesting guide