Supply and Demand Trading in 2026
We have been trading supply and demand strategies for over ten years, and they have stood the test of time remarkably well. Supply and demand is...
Bull flags and bear flags are among the most popular chart patterns and especially trend-following traders should study those common trend continuation patterns carefully to improve their chart understanding.
Bull flags indicate a potential trend continuation of an uptrend, providing an entry point for long trades, while bear flags may foreshadow a downward trend continuation, signaling a selling opportunity. This article delves into the details of these patterns, explores their formation, and provides practical trading strategies.
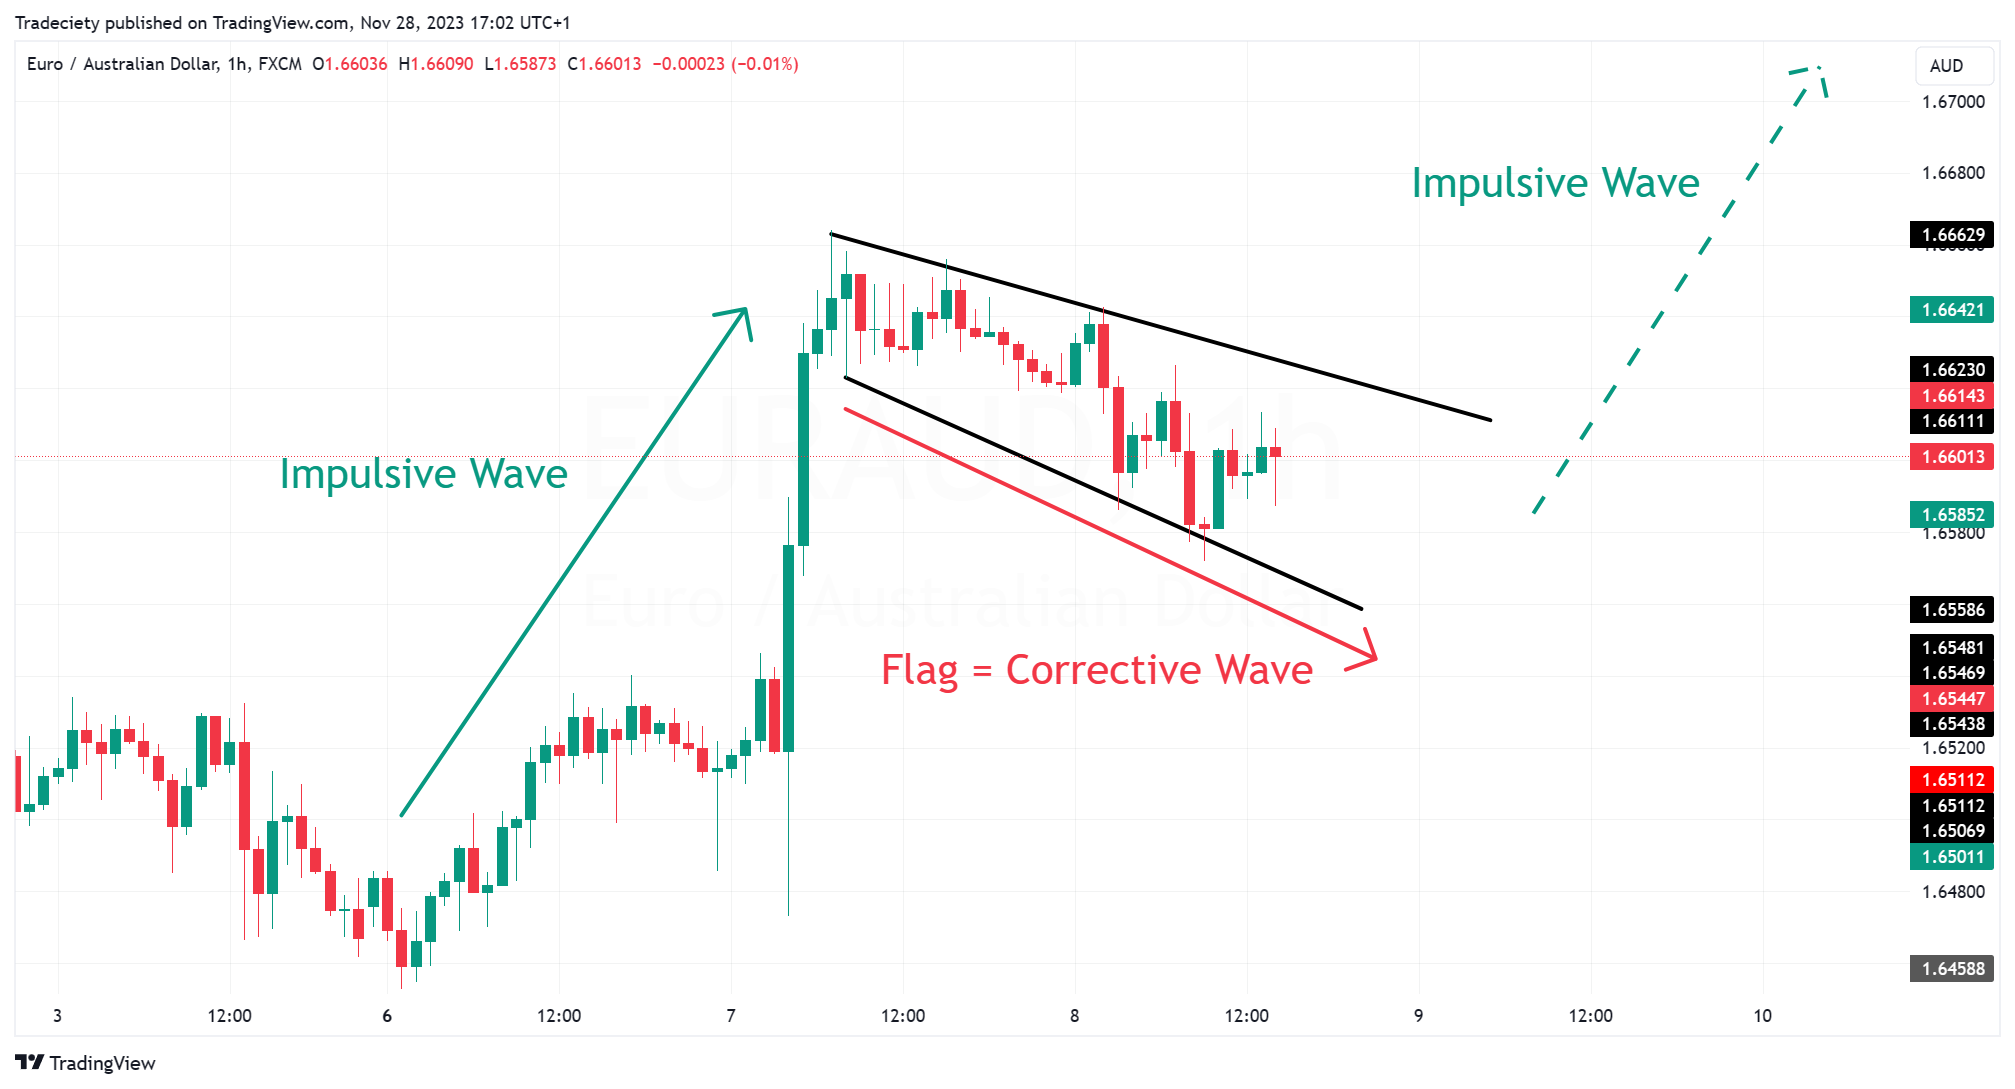
A bull flag forms during an uptrend, after an impulsive trend wave (the pole), when the price consolidates in a narrow, downward-sloping range, resembling a flag on a pole. Typically, traders use trendlines to define the range behavior in a bull flag.
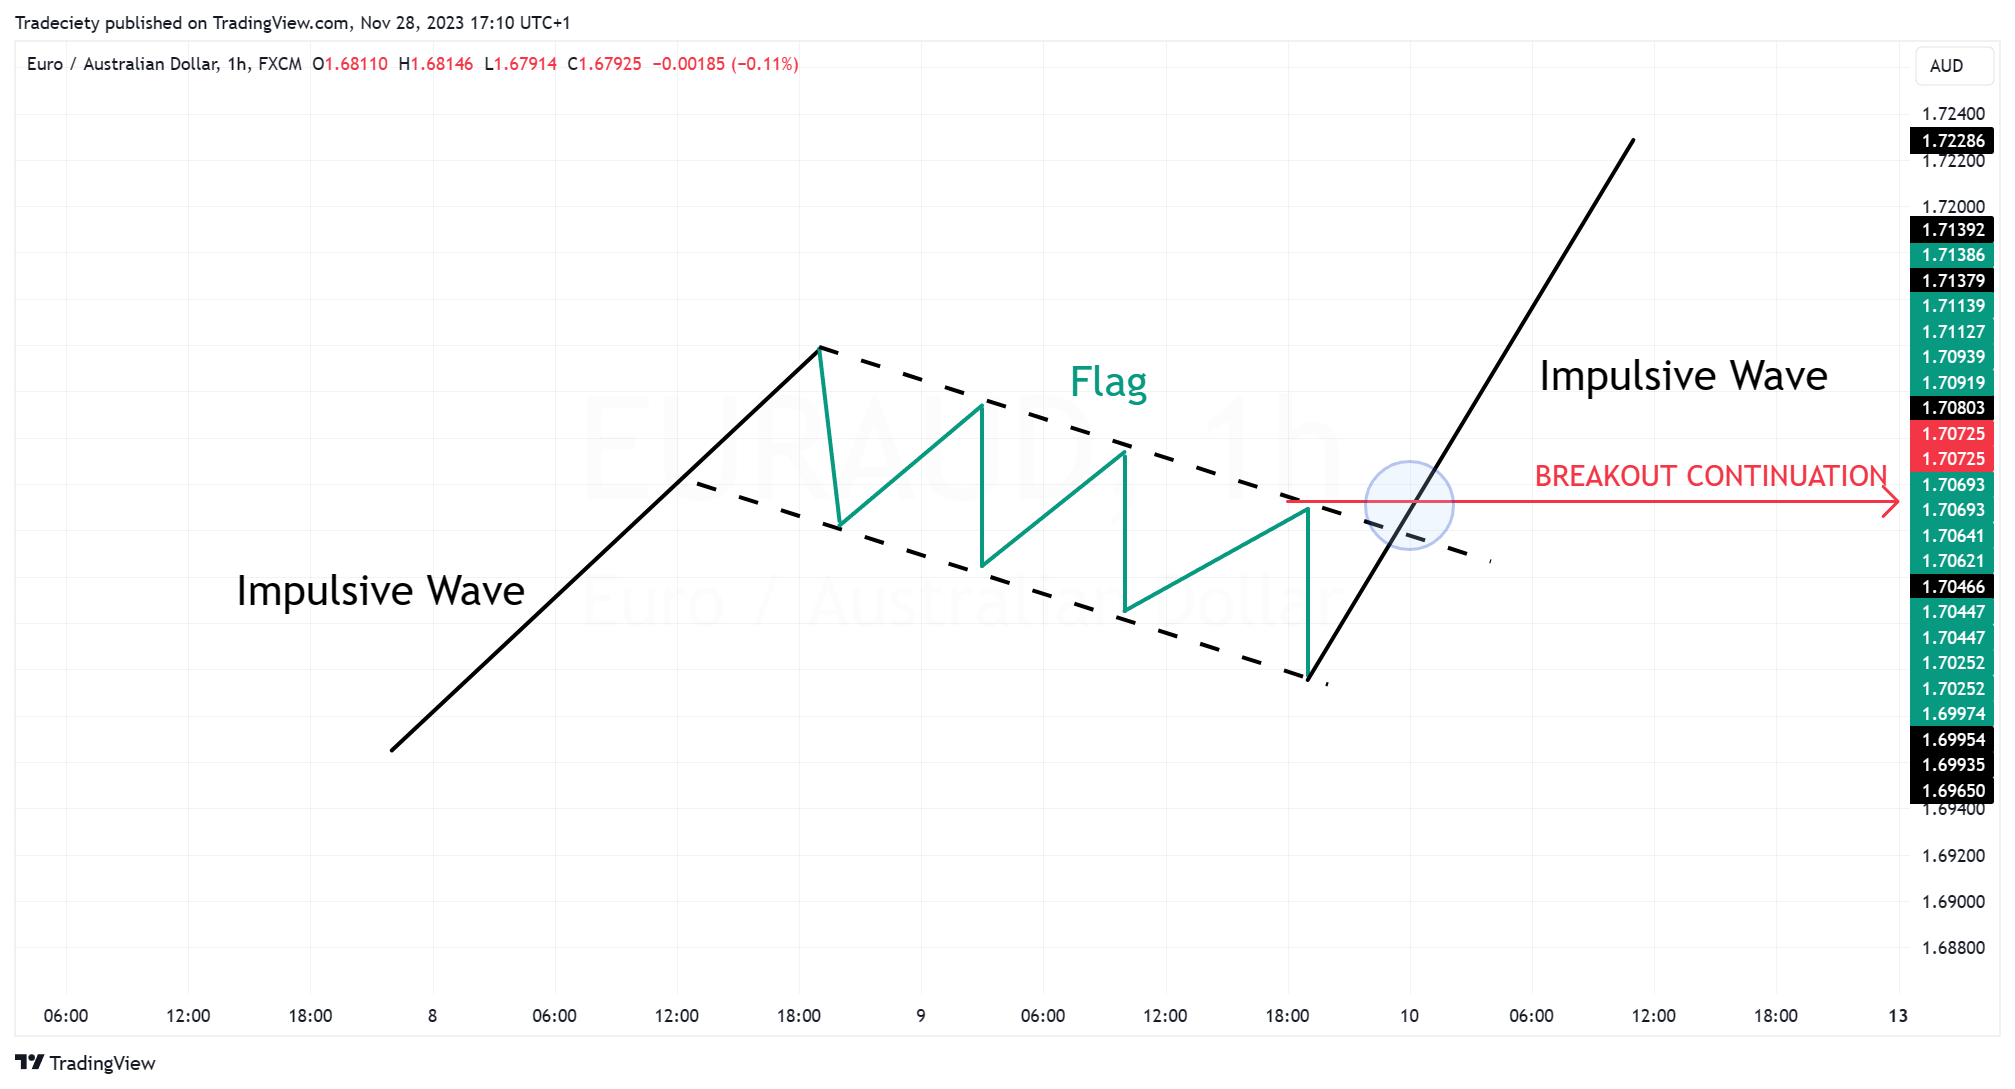
The screenshot below shows the ideal bull flag scenario. The flag pattern suggests that the upward trend may continue when the price breaks above the flag trendline and starts making higher highs once again.
There are, of course, many different ways one could trade a bull flag and we are going to explore some variations later in this article.
The first step when it comes to finding bull flags is making sure that the instrument is in a trending market environment. The strong impulsive trend wave in the screenshot below confirms that the instrument is indeed overall in a trending market.
Many traders make the mistake of chasing the price as a bullish trend keeps pushing higher during the impulsive wave. Such a trading approach usually doesn't perform as well because of a high likelihood of a pullback.
Bull flag trading may offer a more favorable approach because traders are waiting for a price correction and, therefore, can enter their long trades at a lower price, providing a better reward:risk ratio.
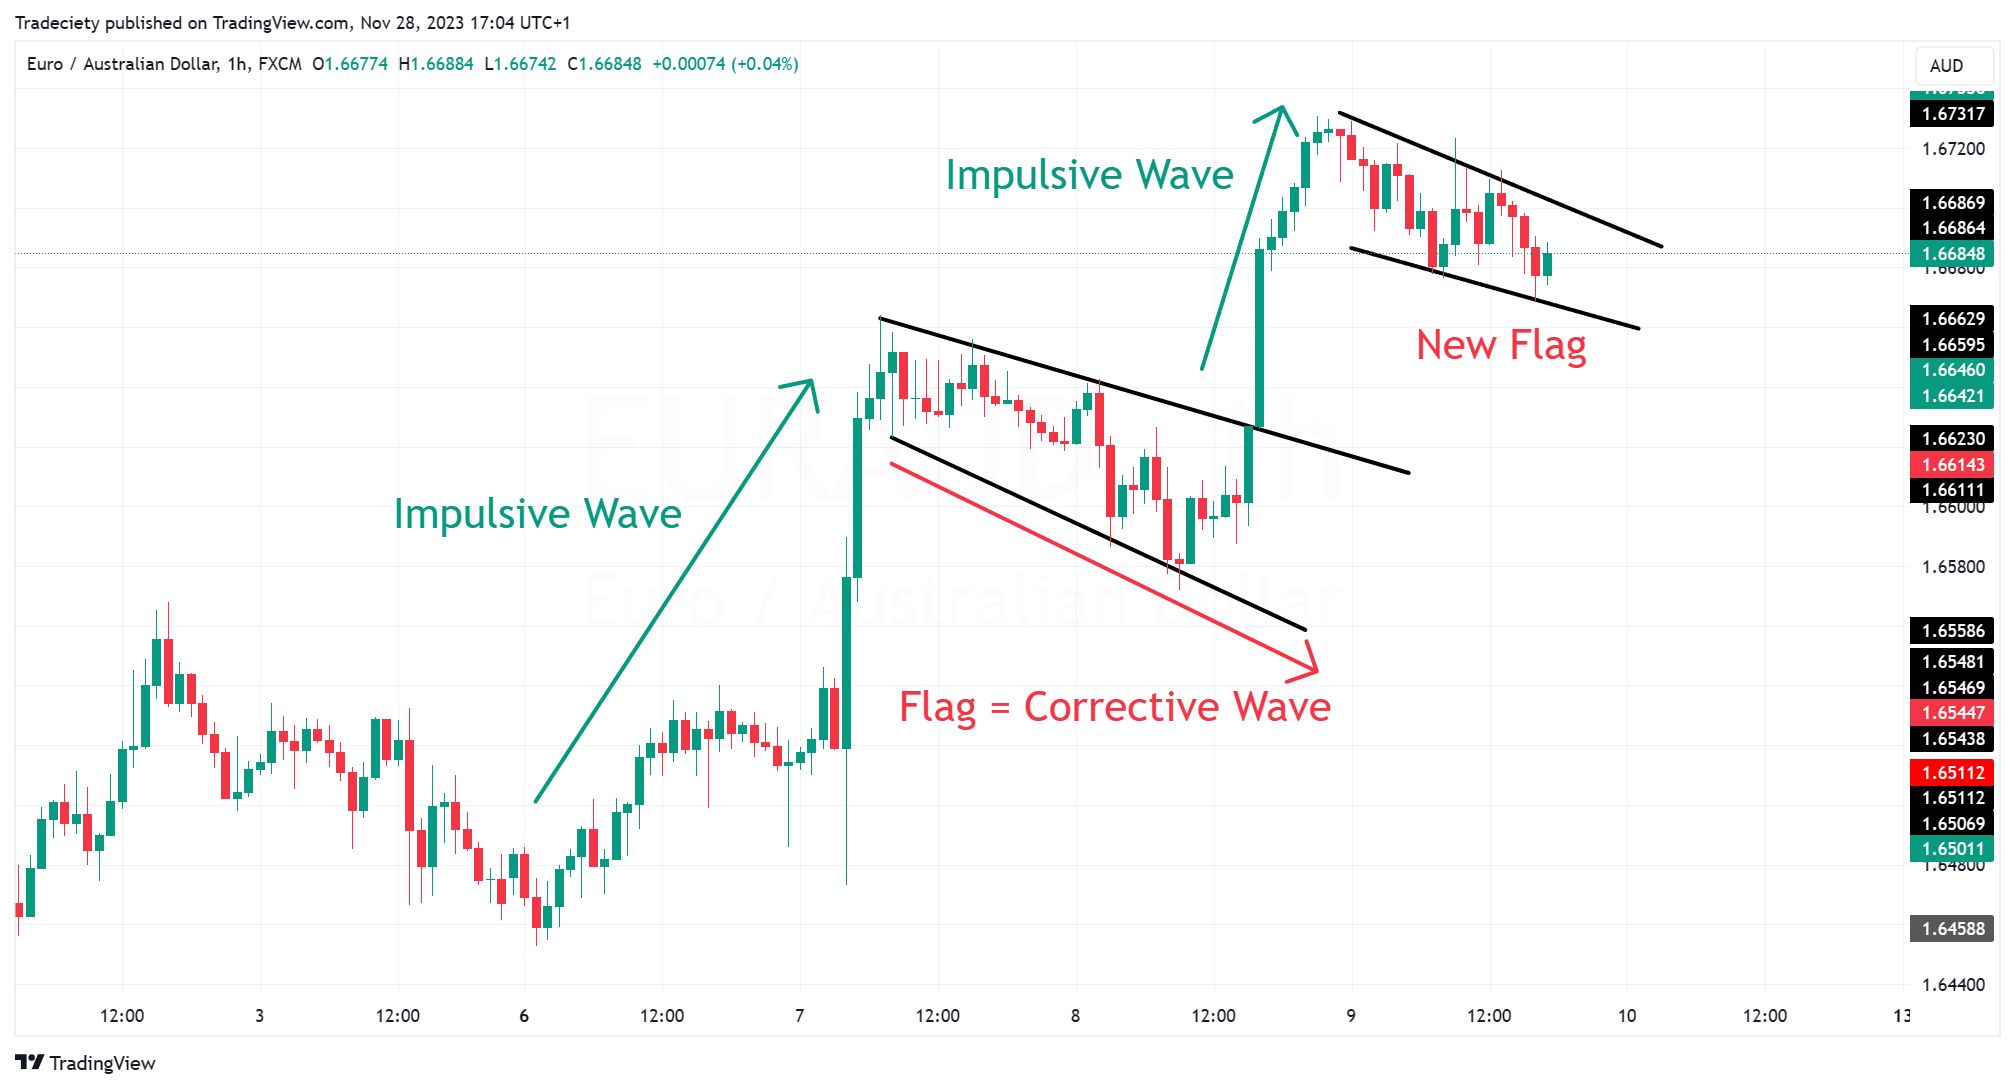
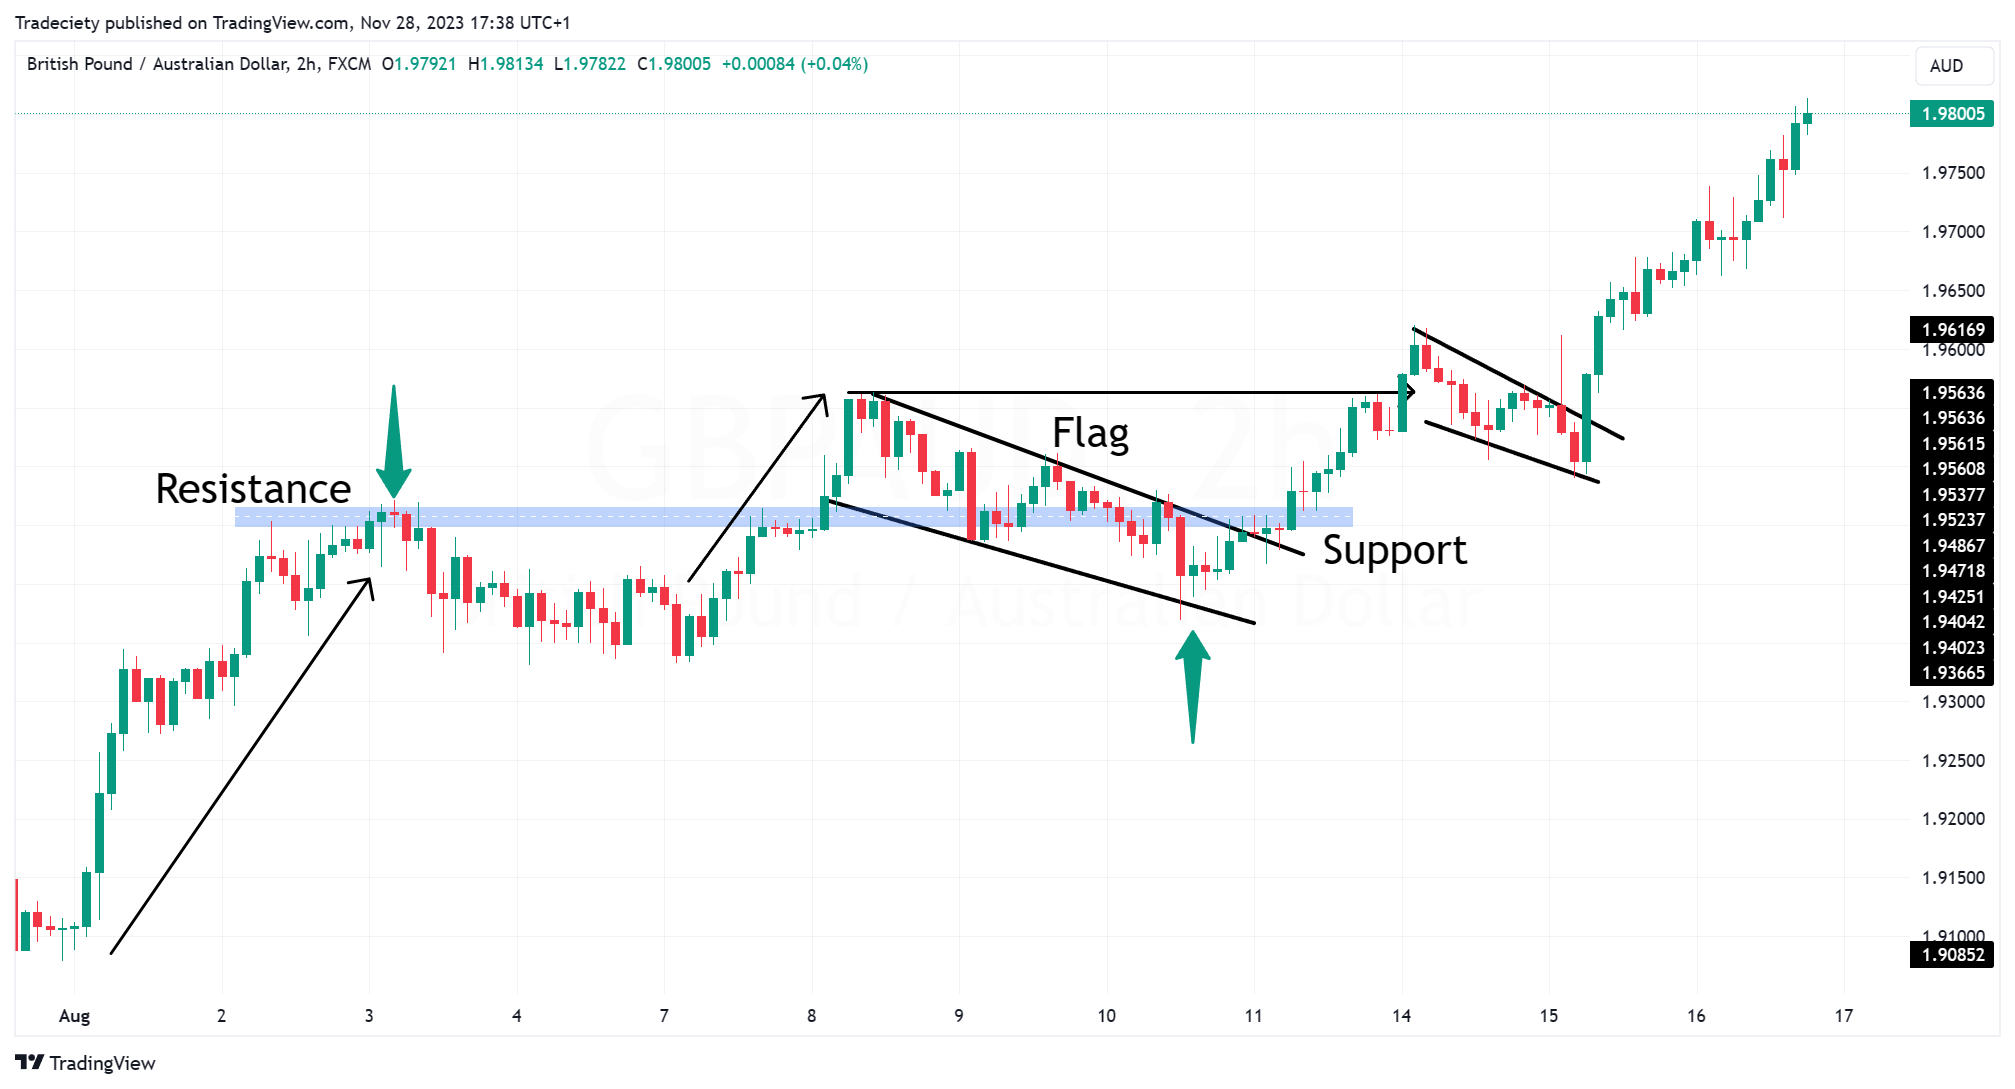
After the breakout from the first flag, the trend continued higher with a second impulsive trend wave. Elliot wave traders may recognize this trending behavior because it resembles the interplay between impulsive and corrective trend waves.
As the new impulsive trend wave loses momentum, the price, once again, goes over into a bull flag during the corrective wave.
Using trendlines can often be more subjective because trendlines can be drawn in many different ways. Although we are going to explore other bull flag trading strategies later in this article, I want to introduce a more objective trading approach at this point.
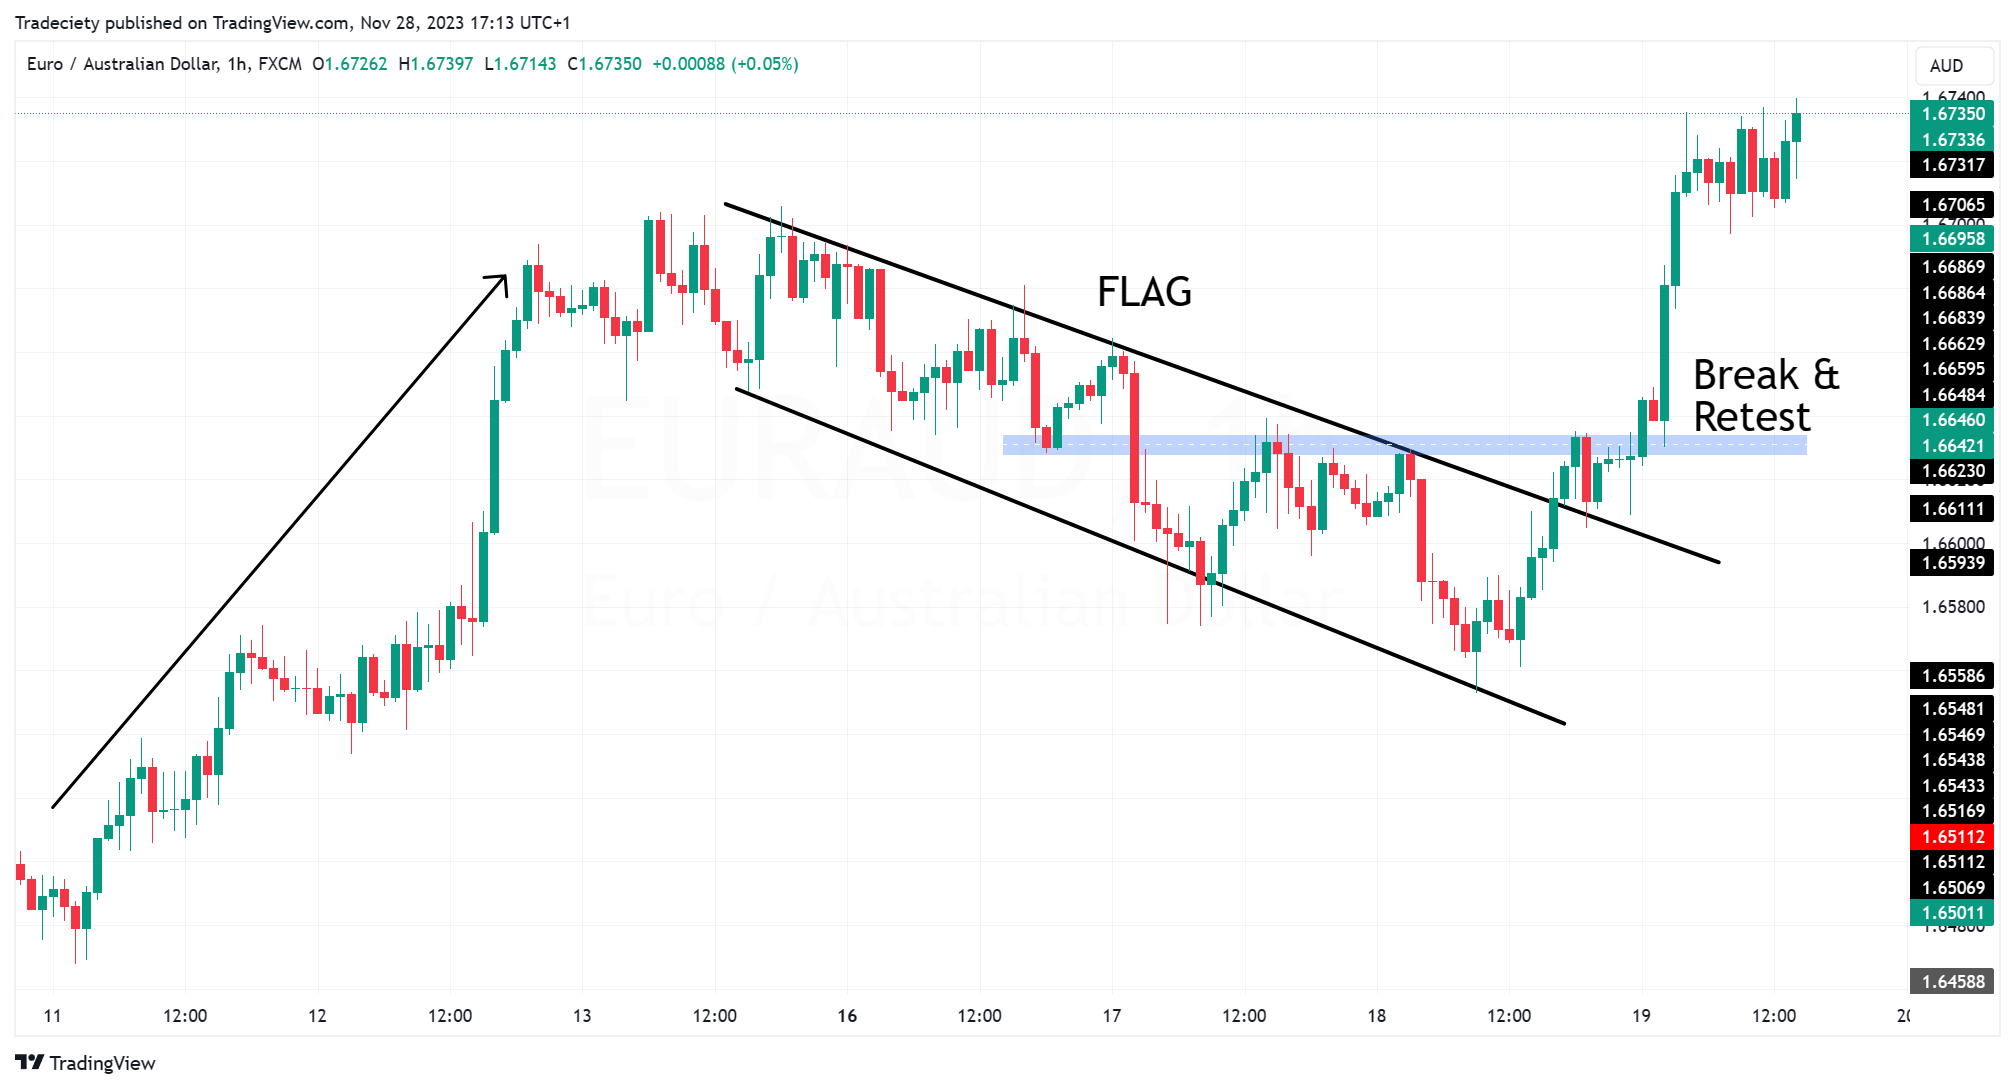
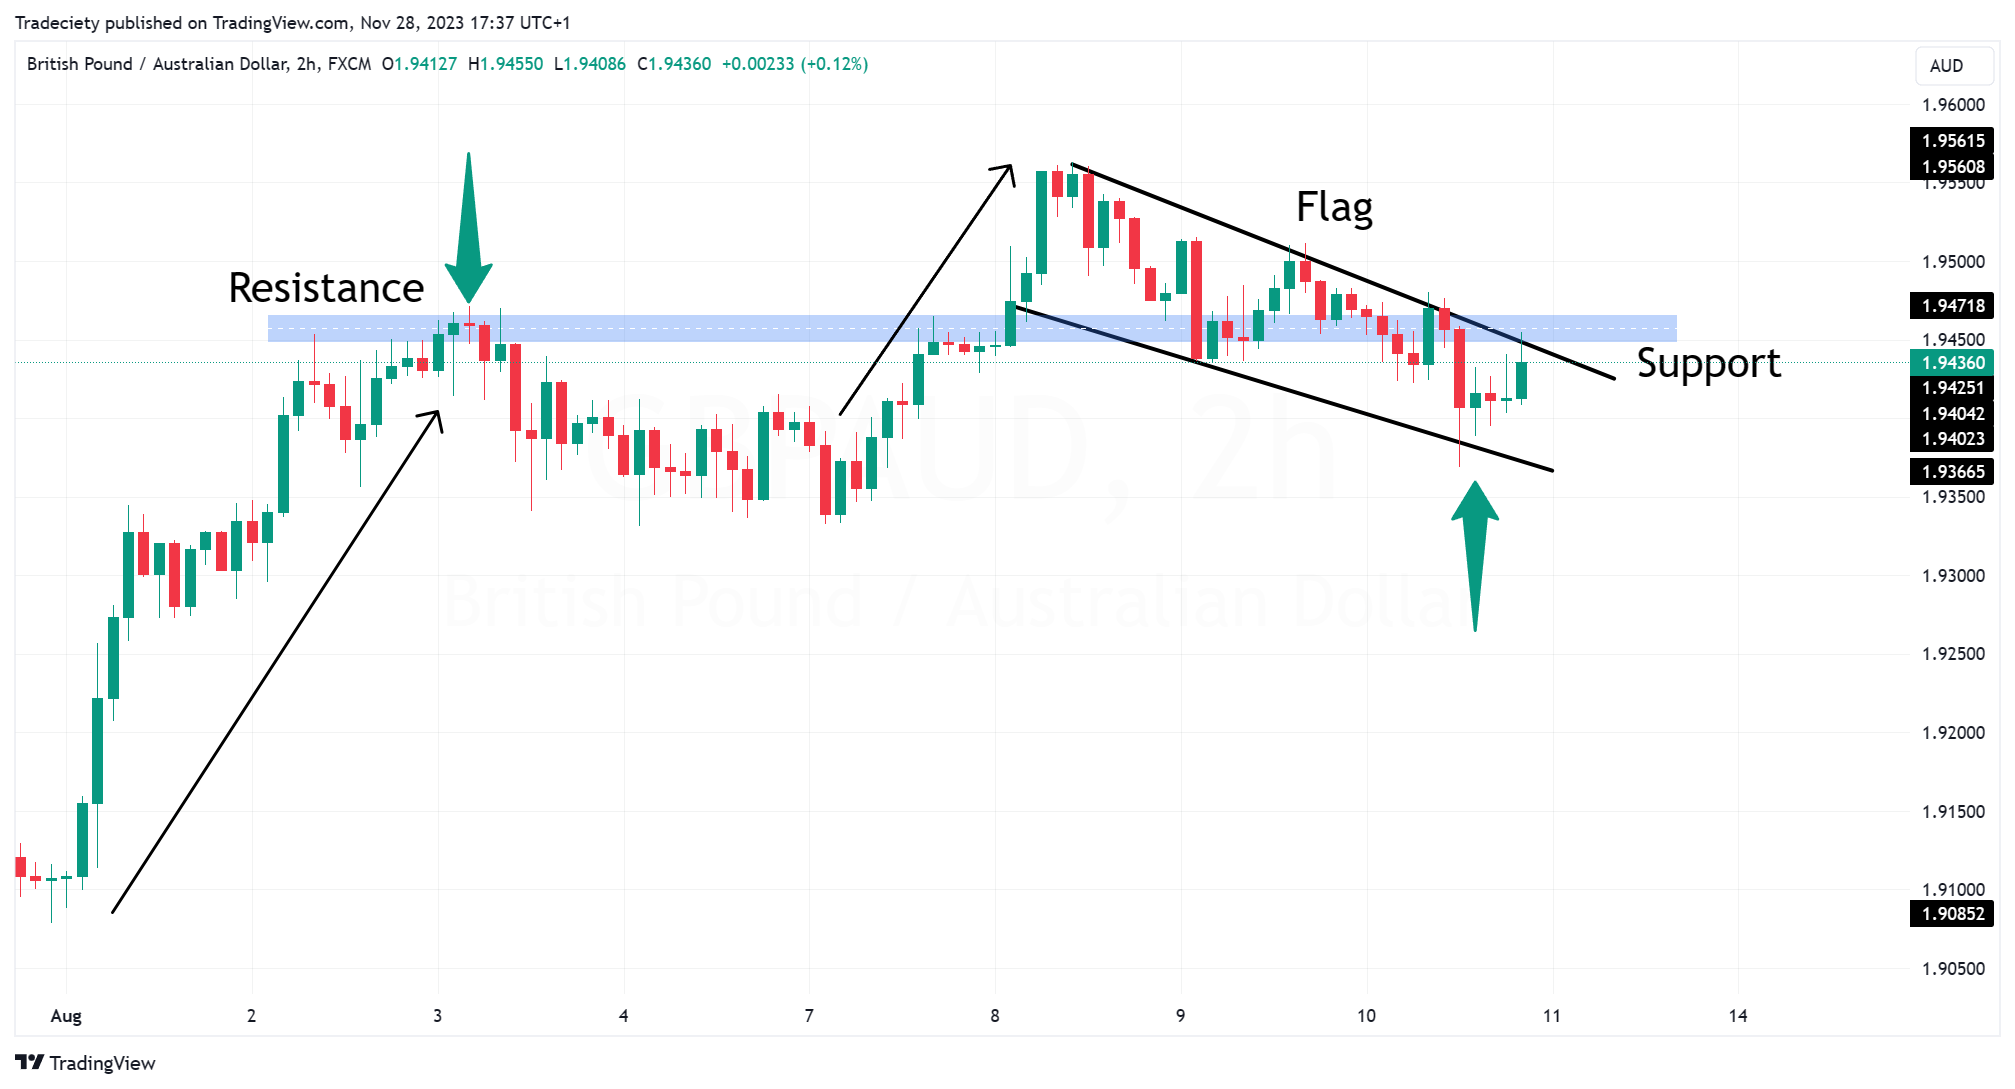
By looking at the price behavior within a flag pattern, we can often draw support and resistance zones to explain the price action better. Instead of just trading the trendline breakout, some traders may find it helpful to incorporate horizontal support and resistance concepts into their flag trading strategies.
In the screenshot below we see a clear horizontal support and resistance level that could have been used as a second entry trigger. In this case, traders choose to wait for the price to break above the horizontal resistance before entering a long trade. Often, you will also see the common break and retest pattern at this point when the price transitions from the corrective phase into the following impulsive trend wave.
Bear flags work the same and they occur during a downtrend, functioning as a trend continuation pattern to the downside. Here, the price consolidates in a narrow, upward-sloping range, again forming a flag on a pole, but this time it indicates the possibility of the downward trend continuation. When the price breaks below the flag, it's often seen as a selling signal by traders, expecting further decline.
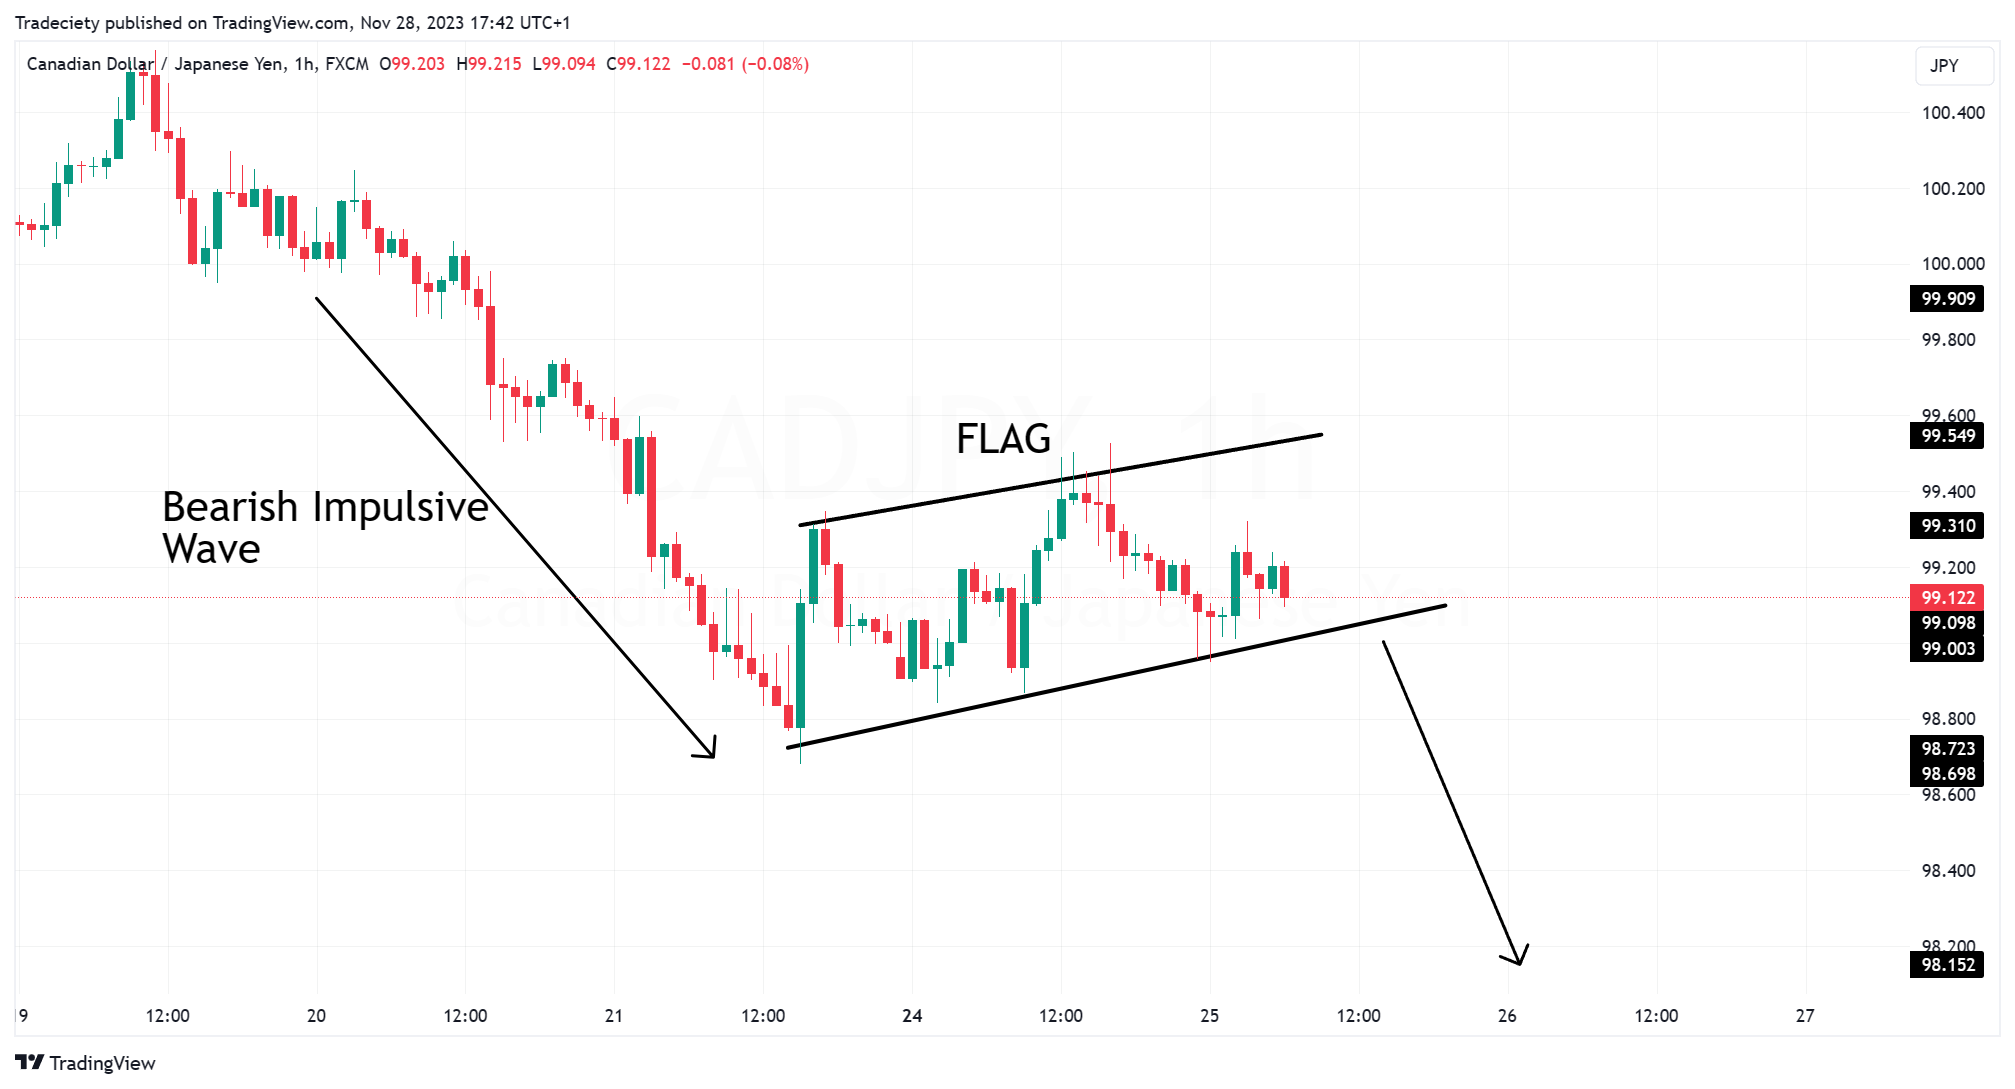
Both patterns are characterized by a strong initial trend (the pole), followed by a consolidating counter move (the flag), and a potential breakout in the direction of the initial trend.
Now, we are going to explore some bull and bear flag trading strategies, using different trading concepts and tools to improve our decision-making. Trading bull flags by themselves, without additional confluence signals, is typically not recommended. As with all chart patterns, it is usually best to trade chart pattern-based strategies in a complete trading system with additional rules and concepts.
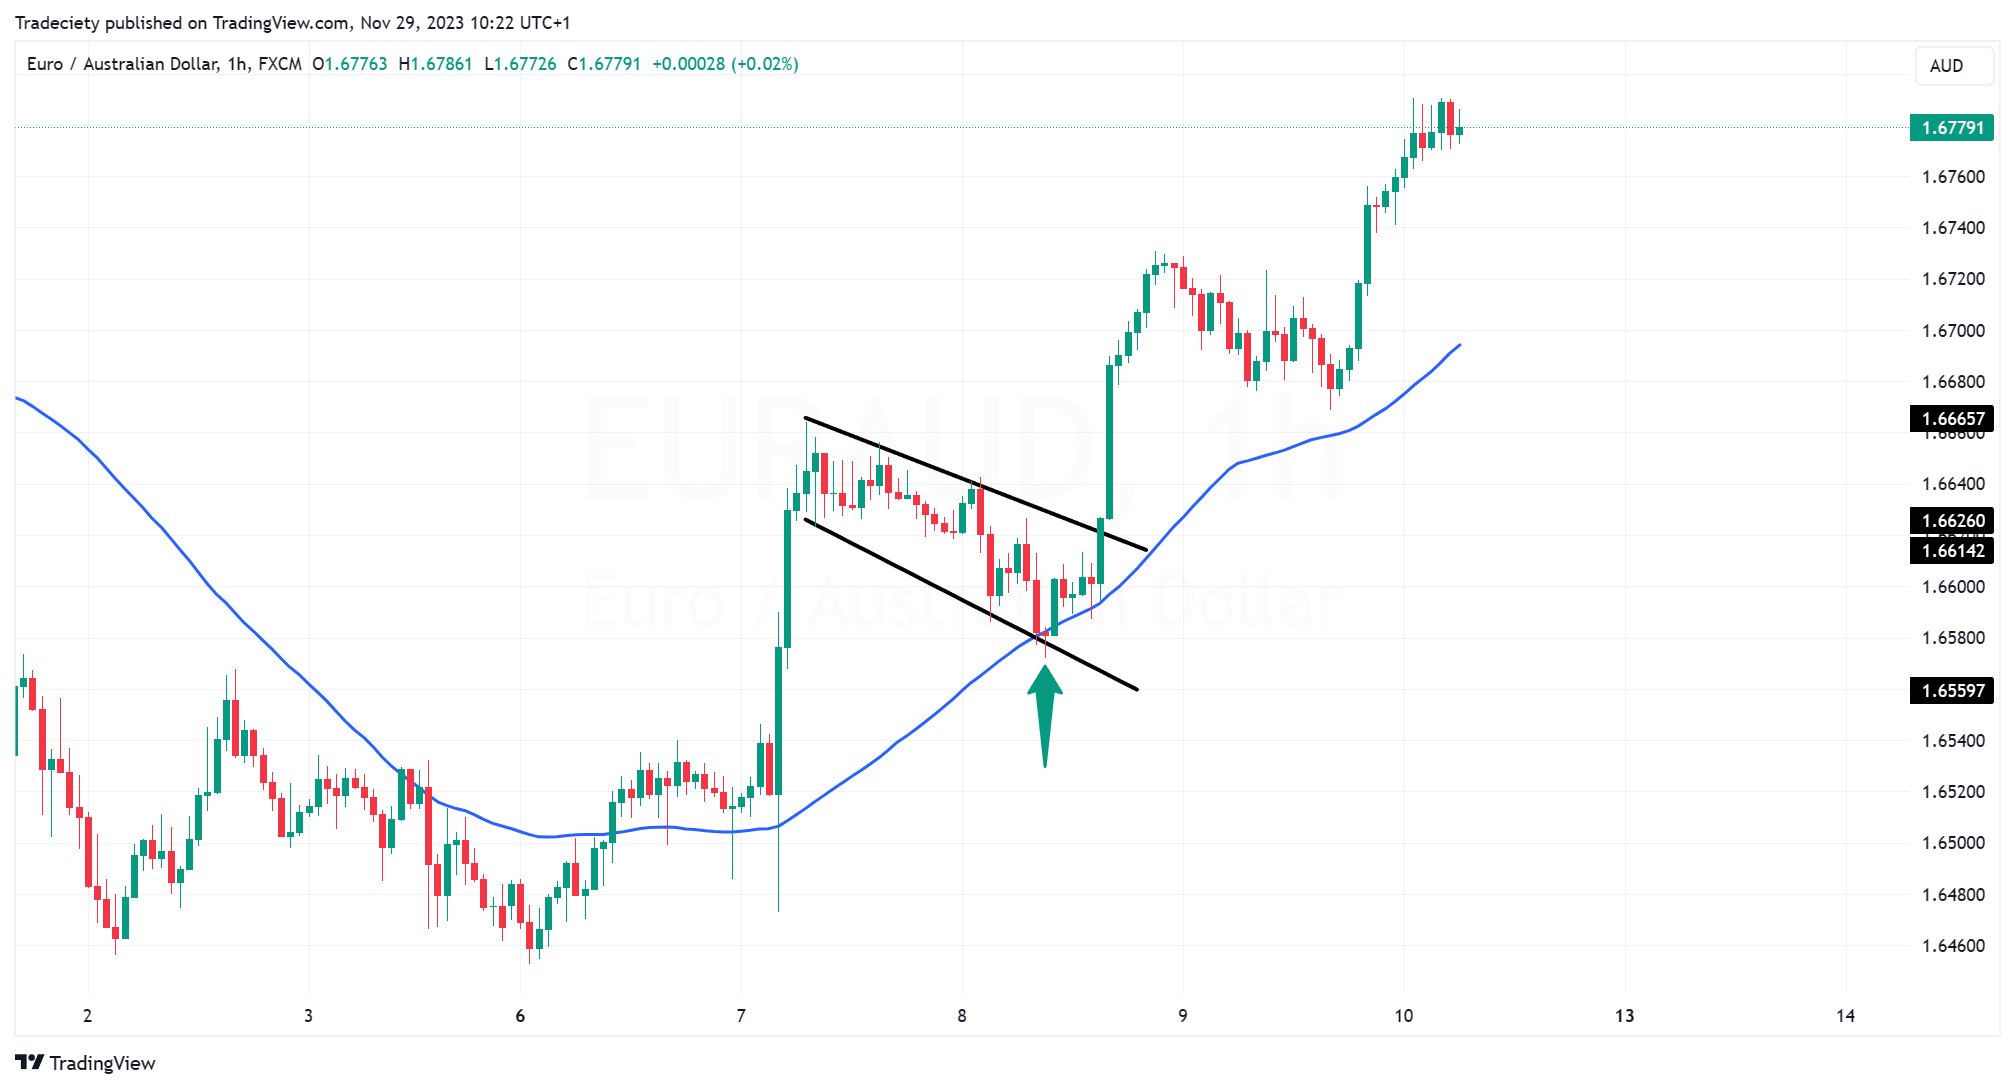
For a simple start, adding a moving average (the 50 SMA in our example) can help to identify bull flag pullbacks objectively. In the example below, the 50 SMA held perfectly as support during the bull flag formation.
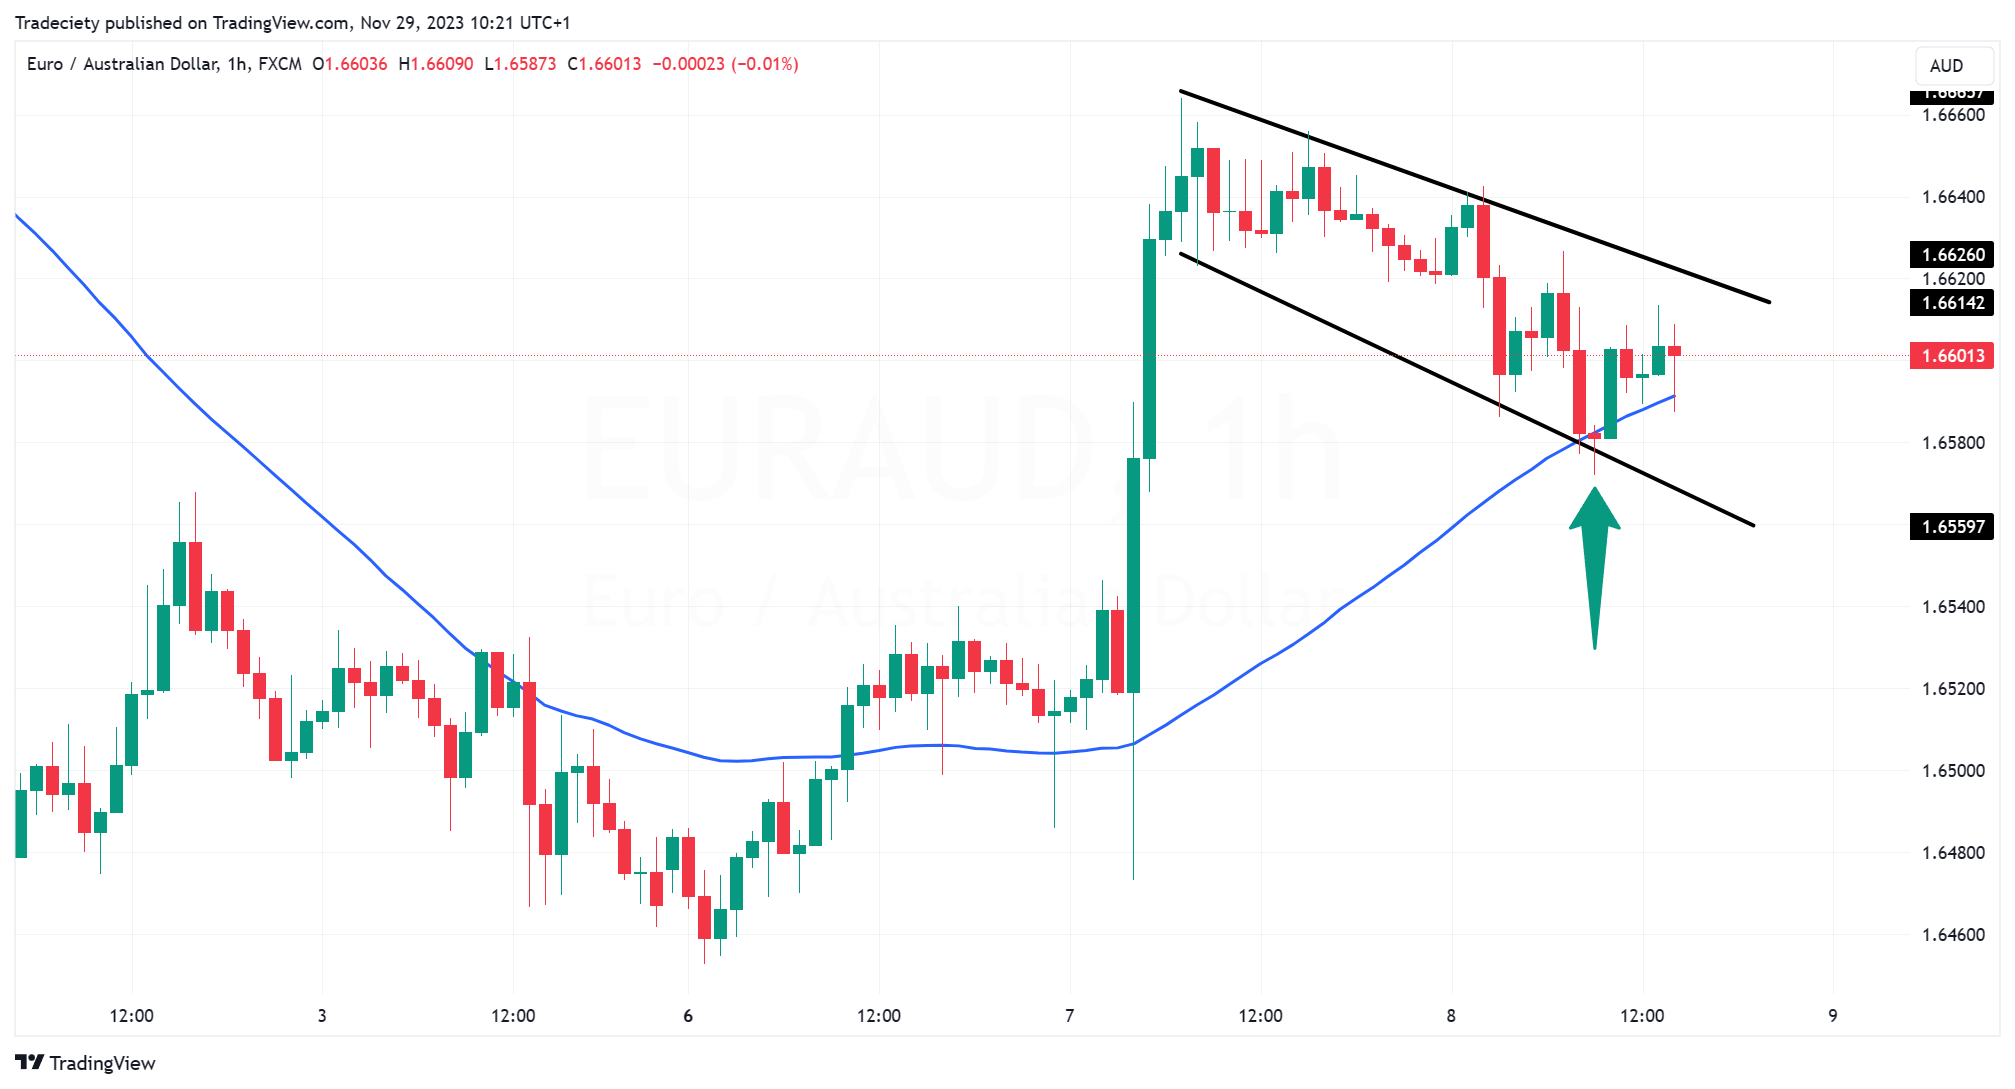
It is not necessary that the moving average holds precisely and even if the price breaks the moving average to the downside, it can still be a valid bull flag. The moving average just provides an objective way of identifying pullbacks and helps to distinguish between impulsive and corrective trading phases.
With this strategy, we are going to use the bear flag within a multi-timeframe context.
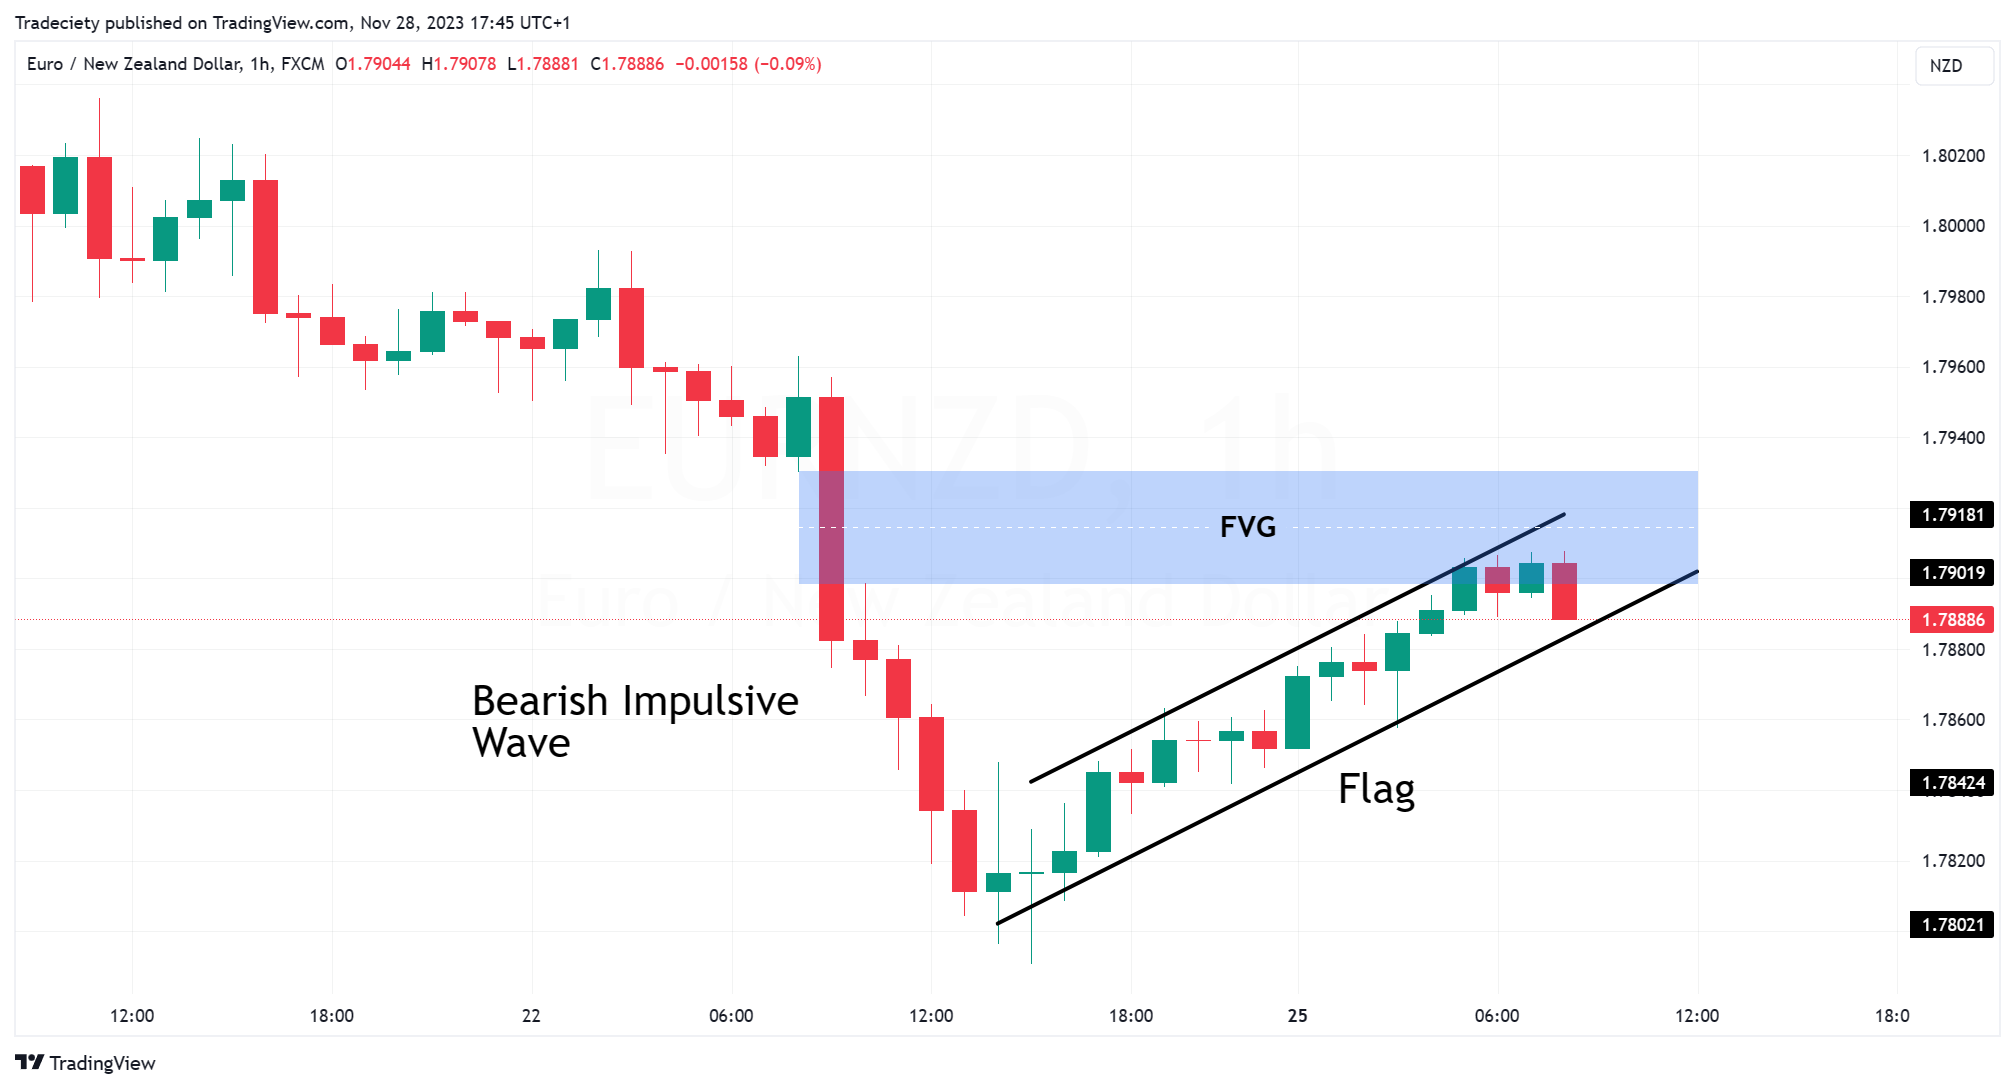
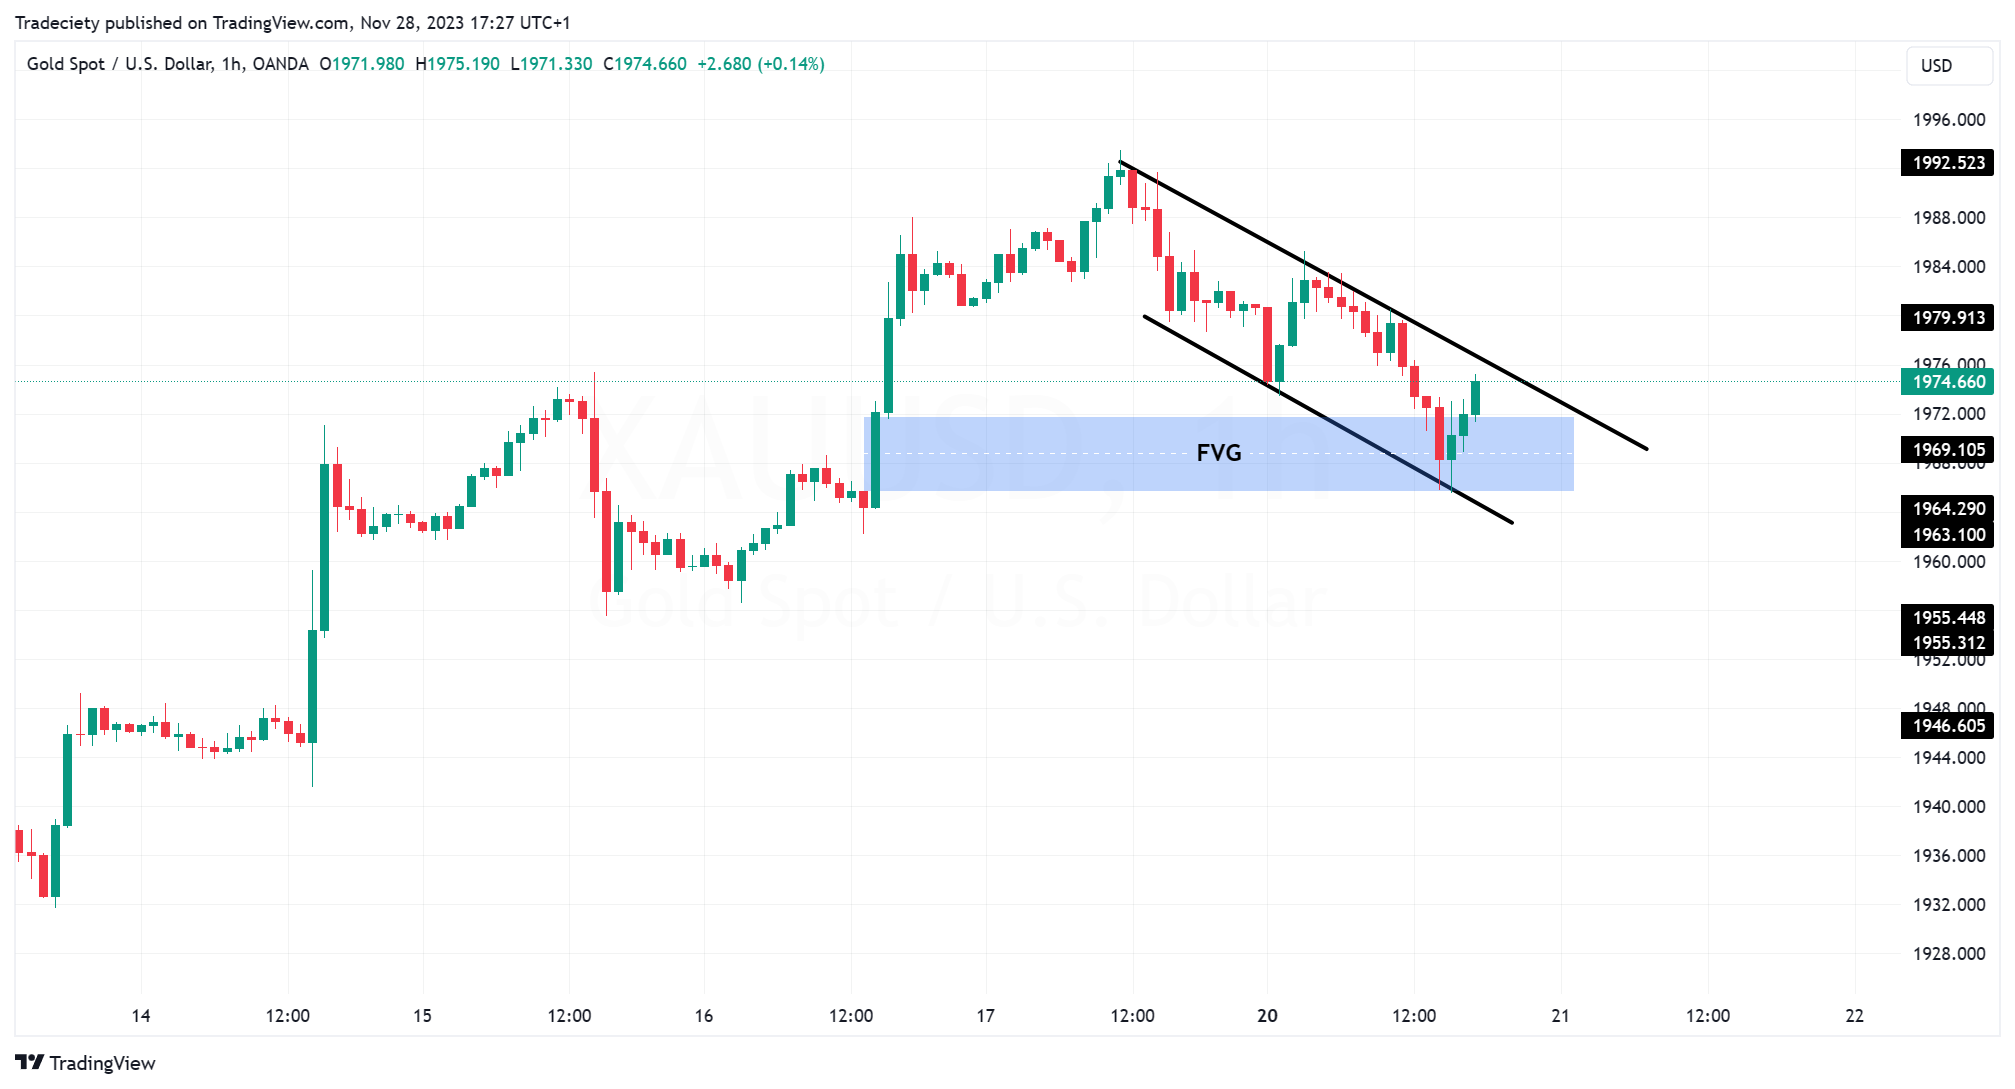
The screenshot below shows a bear flag on the 1H timeframe. Instead of simply trading the breakout through the trendline, we can look for additional trading signals that may improve the trade quality.
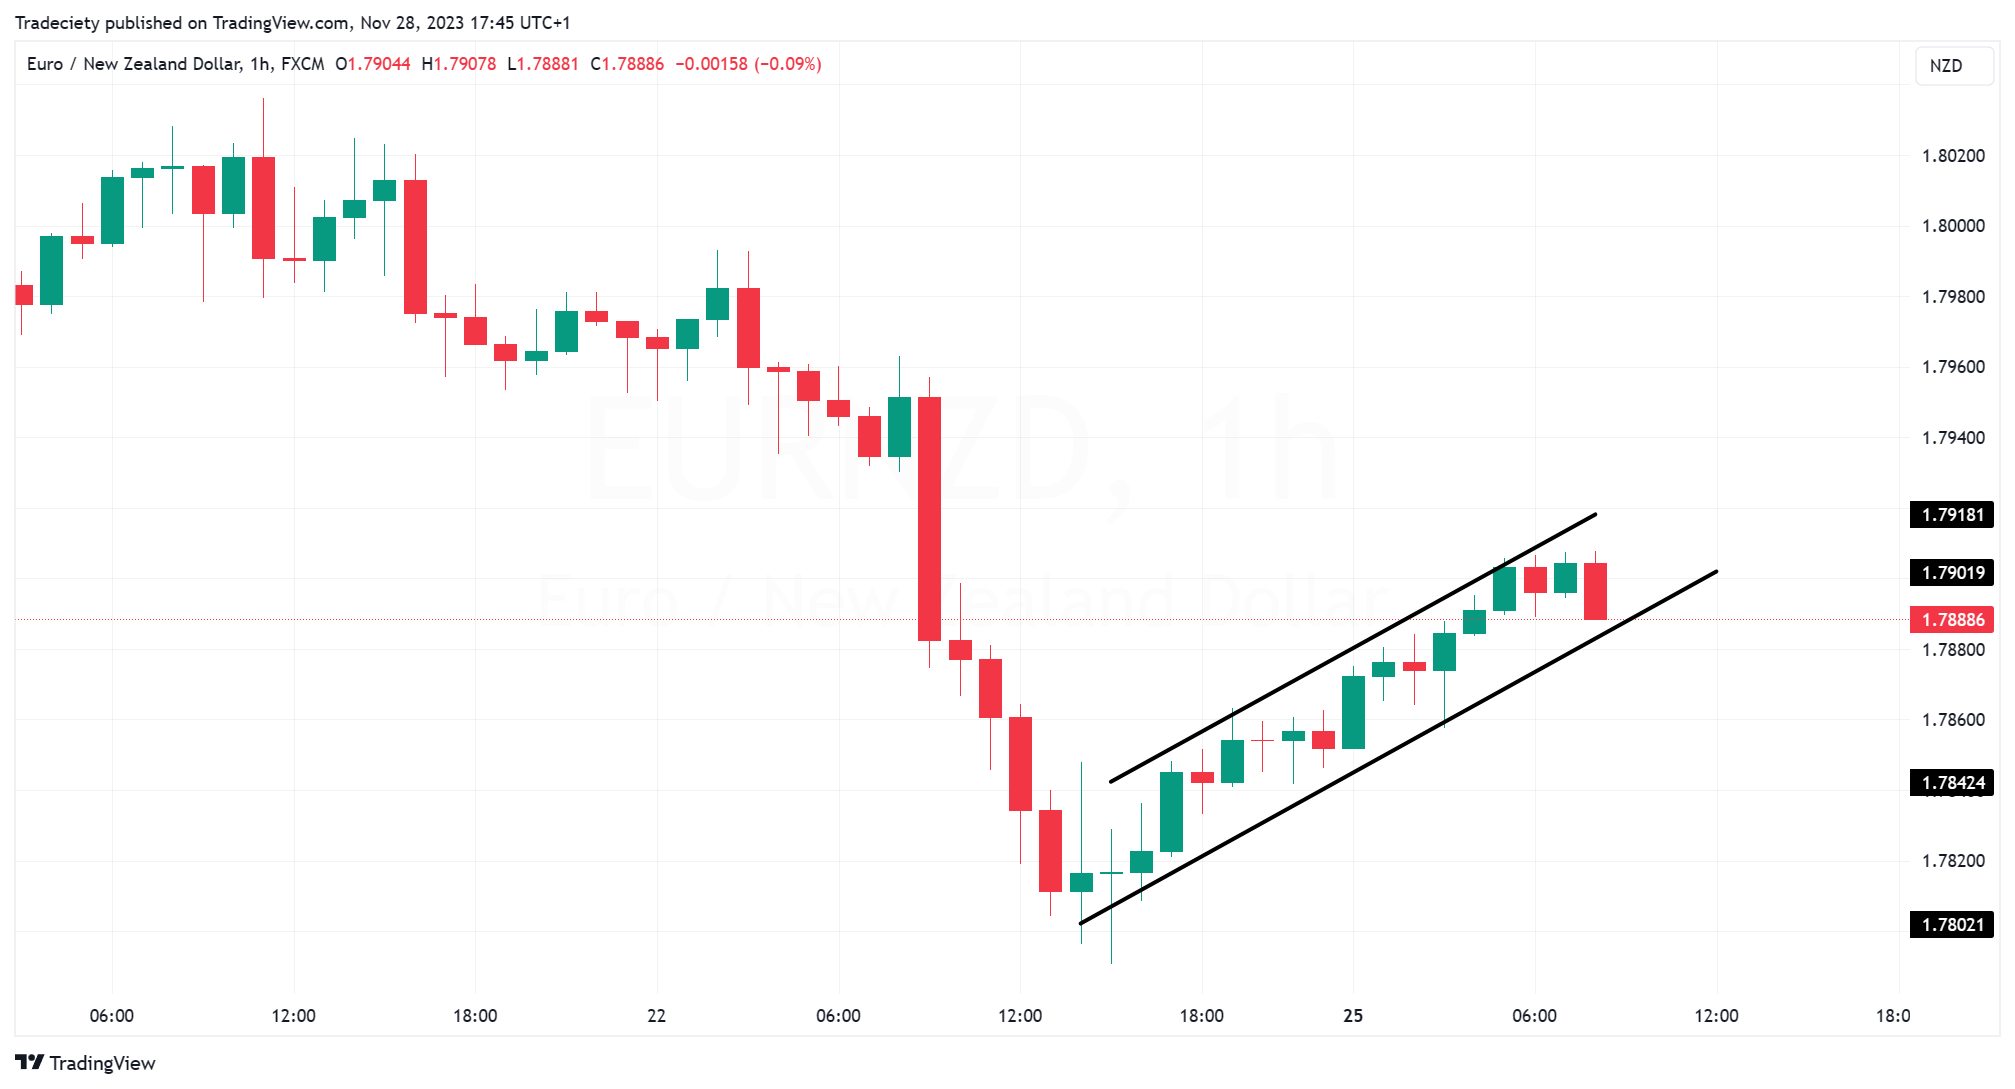
First, we can see that the price has reached a previous Fair Value Gap (FVG) which is a smart money concept. The idea is that like conventional support and resistance, price often gets rejected from FVGs. This can be a great additional trading signal because the bear flag is happening at a chart location from which a rejection downward may have a higher probability.
When we go to the 15-minute lower time frame, we can find additional confluence trade signals: first, the price has broken a swing low, now making lower lows which is a strong trend shift signal. Second, the price has also broken the 15-minute 50-SMA to the downside, signaling a momentum trend change.
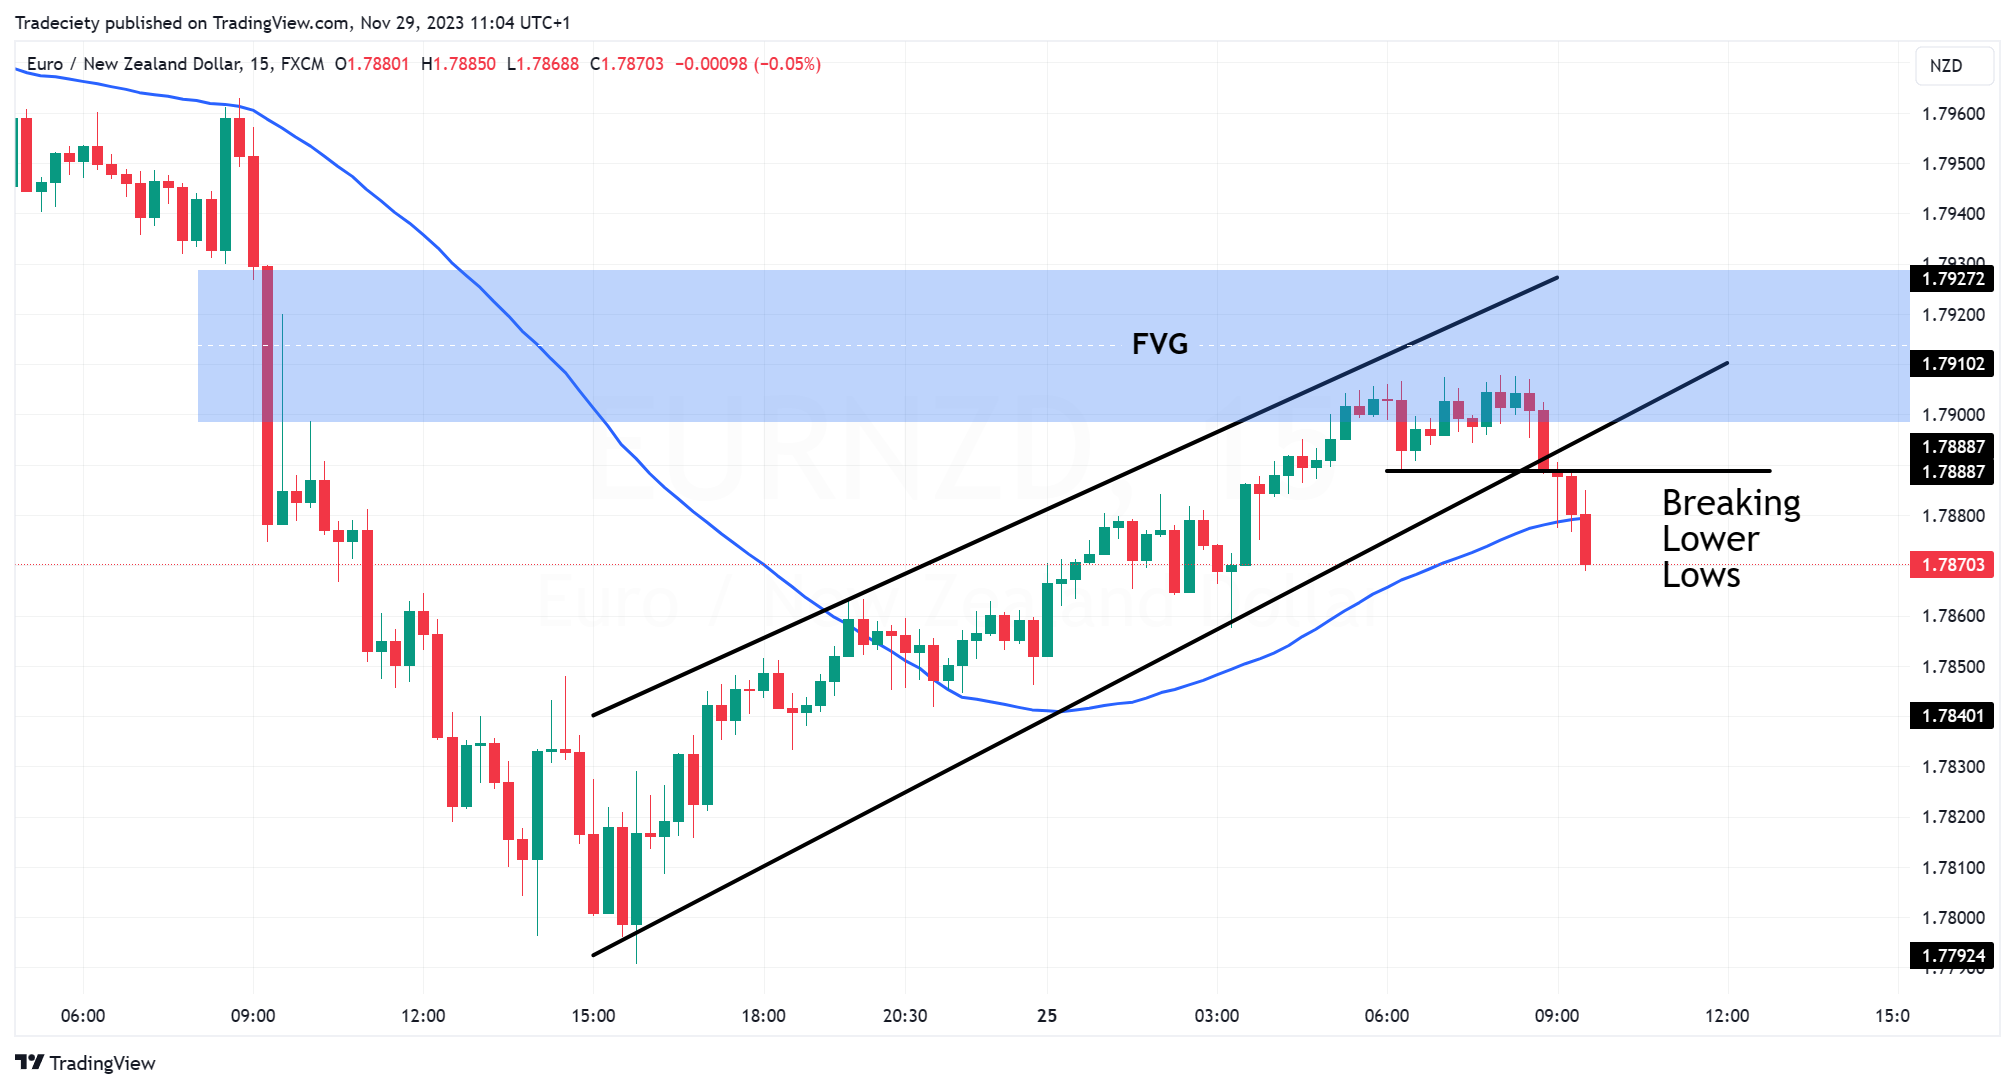
Looking for trade entry signals on the lower timeframe often also provides a much better reward:risk ratio. And by adding additional confluence factors, false signals can often be avoided.
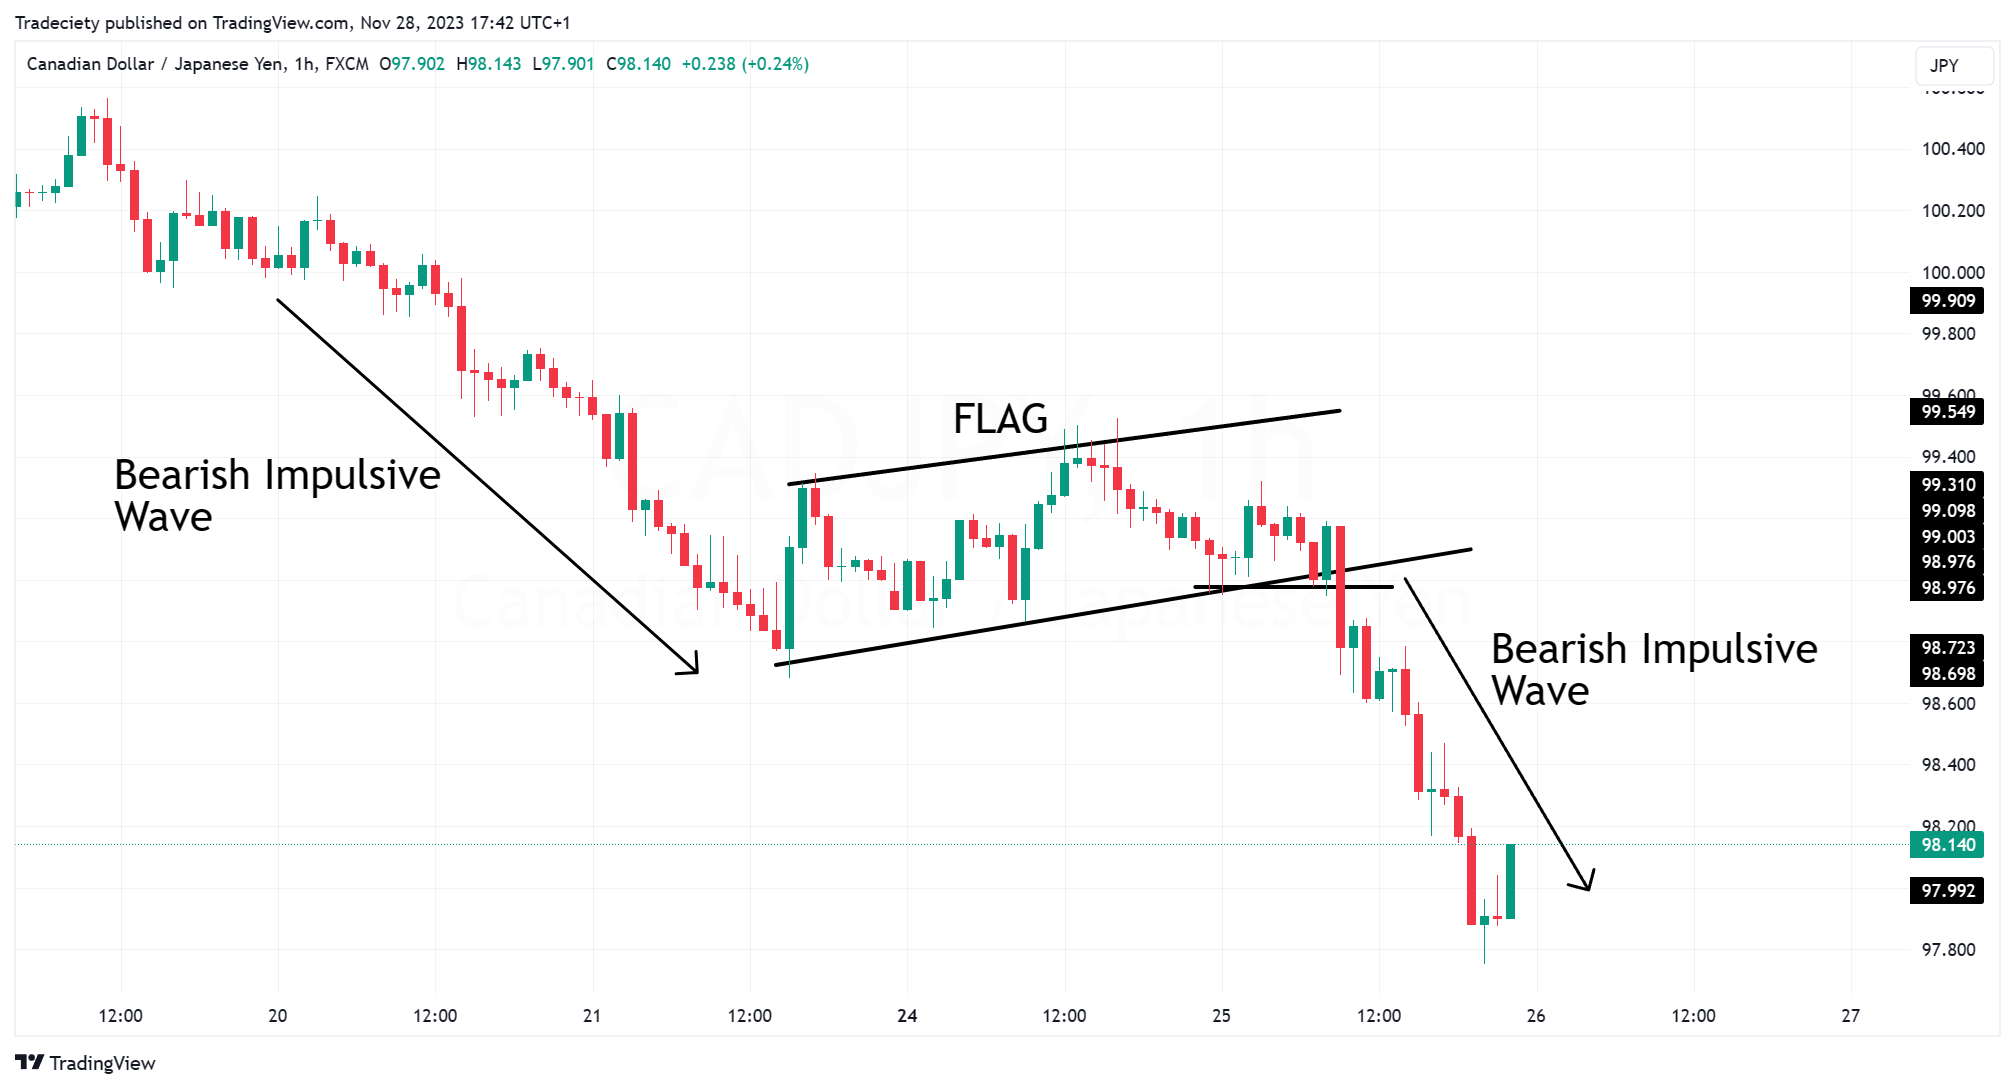
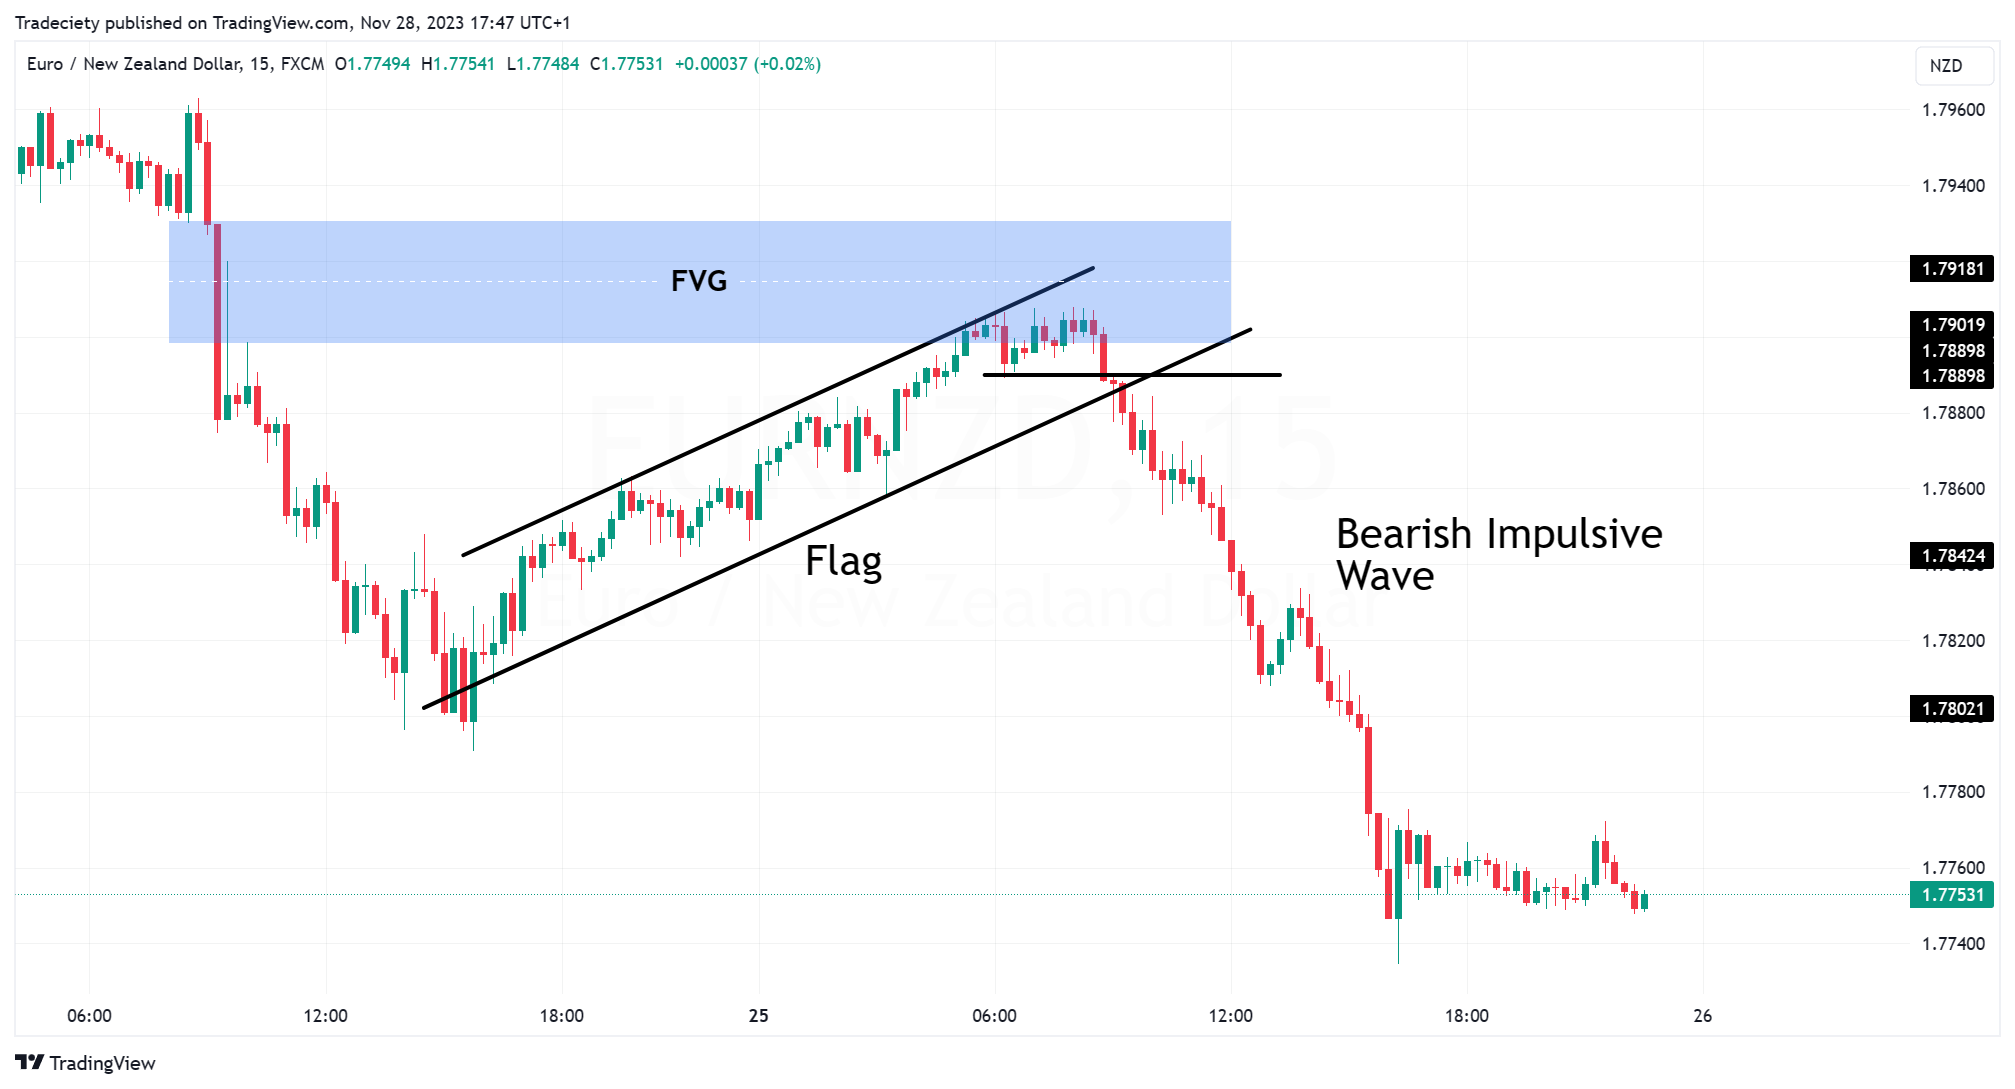
After the bear flag breakout, the bearish trend continued with a strong impulsive bearish wave. The tipping point was the exit from the flag pattern.
With this strategy, we are using FVGs as our first trade filter and we only consider bull flags if they have moved into an FVG; this will also make your trade scanning more effective and objective. In the example below, this is the case.
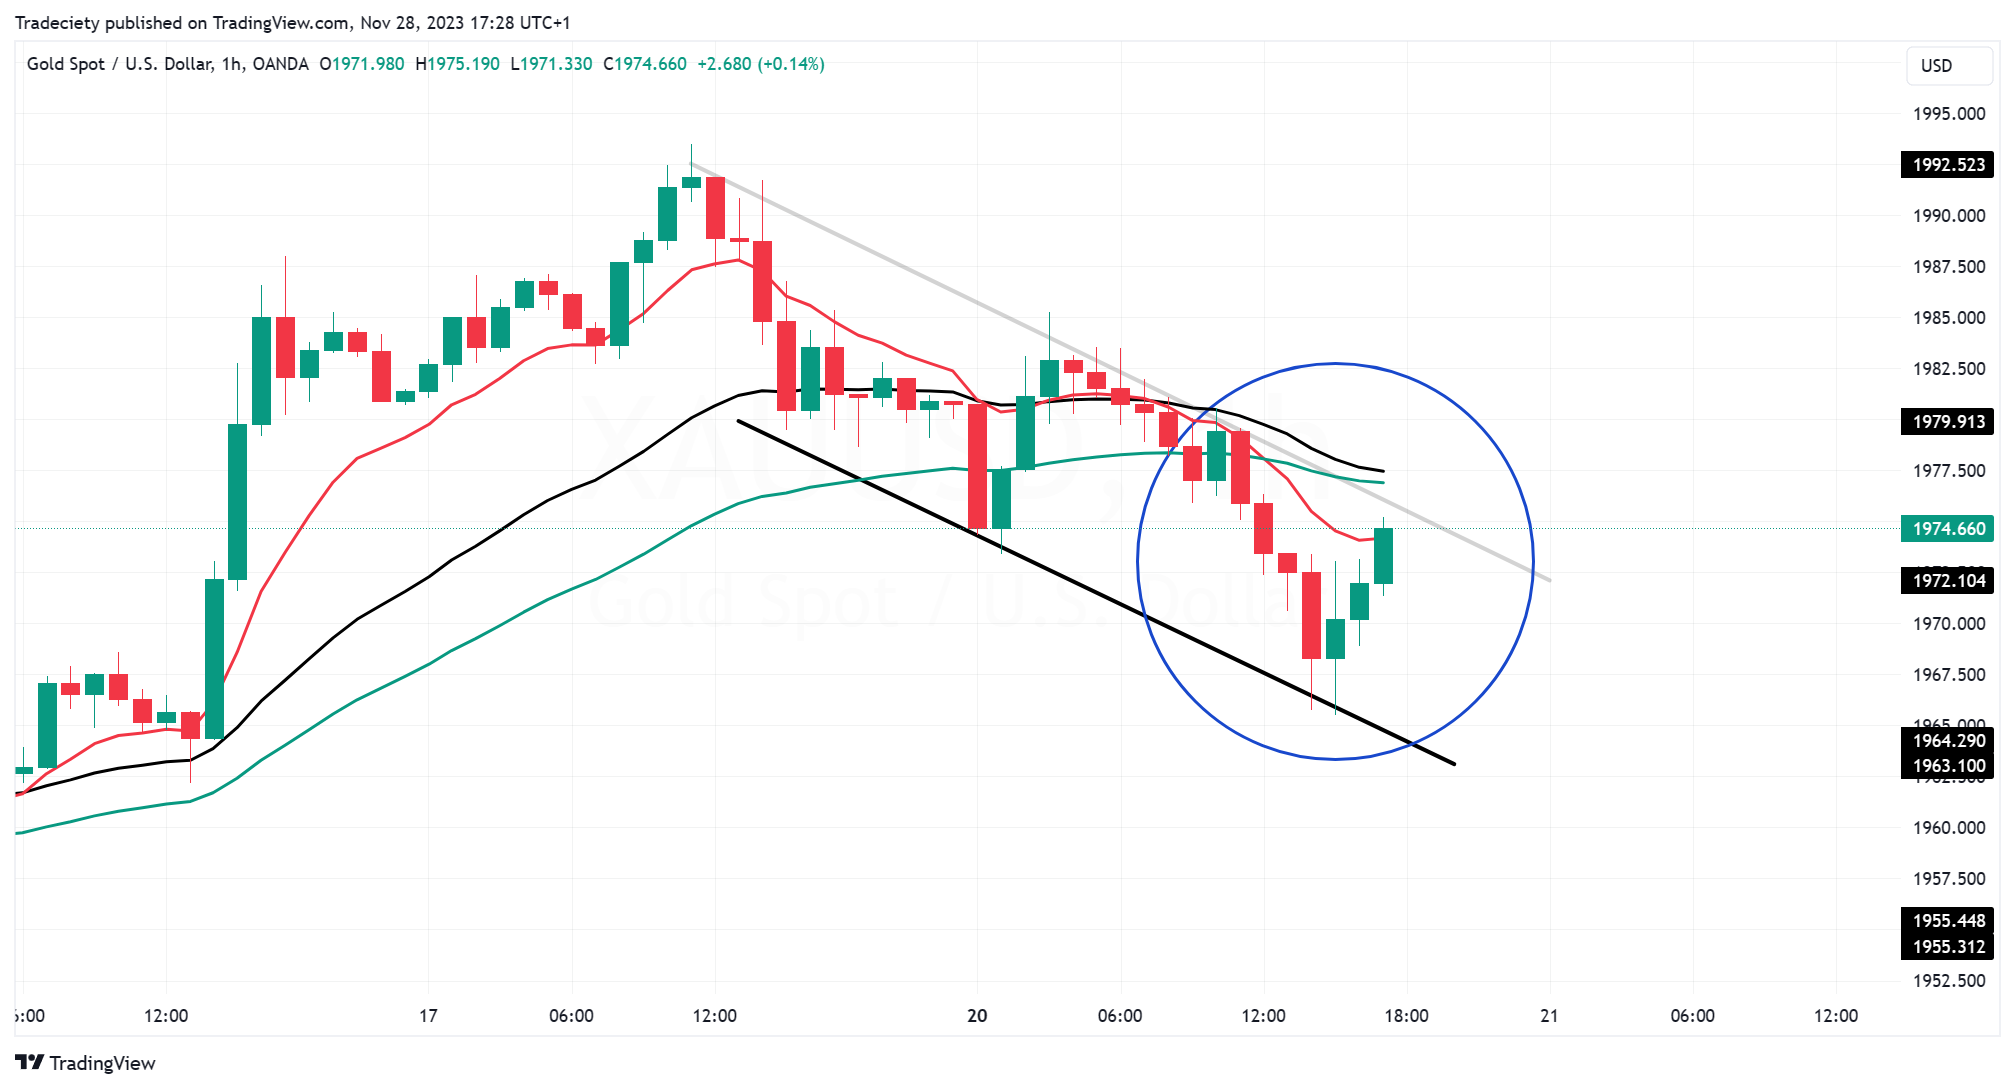
In the image below, the 10 EMA, 30 EMA, and 50 EMA have been added to the chart. During a pullback, the price dips below all three moving averages, signaling a significant market drop. Entering a long position at this point would be too early as the price is showing a bearish momentum structure.
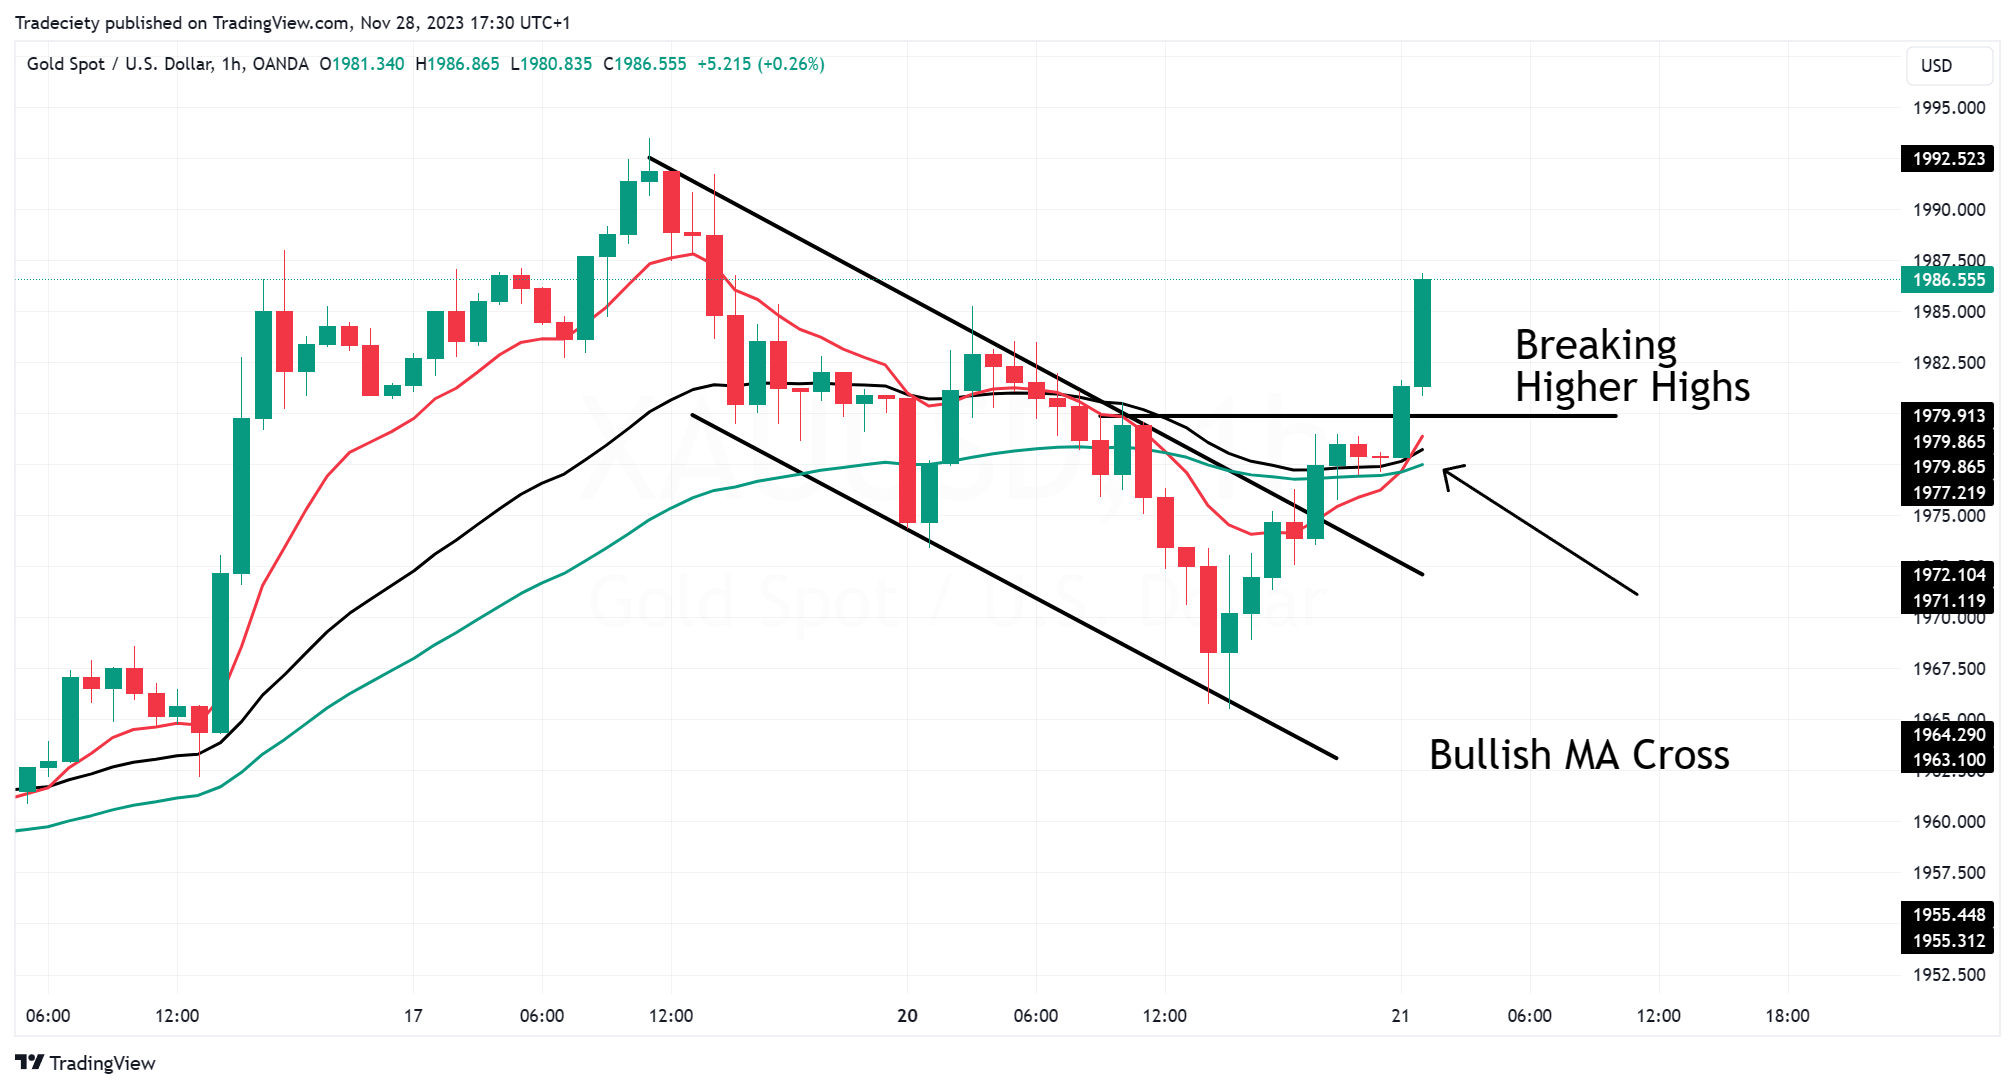
After the breakout from the bull flag, the moving averages have also been broken to the upside and the short-term 10 EMA (red) is back above the longer-term moving averages. When the short-term moving average crosses bullish, it can often foreshadow a trend continuation.
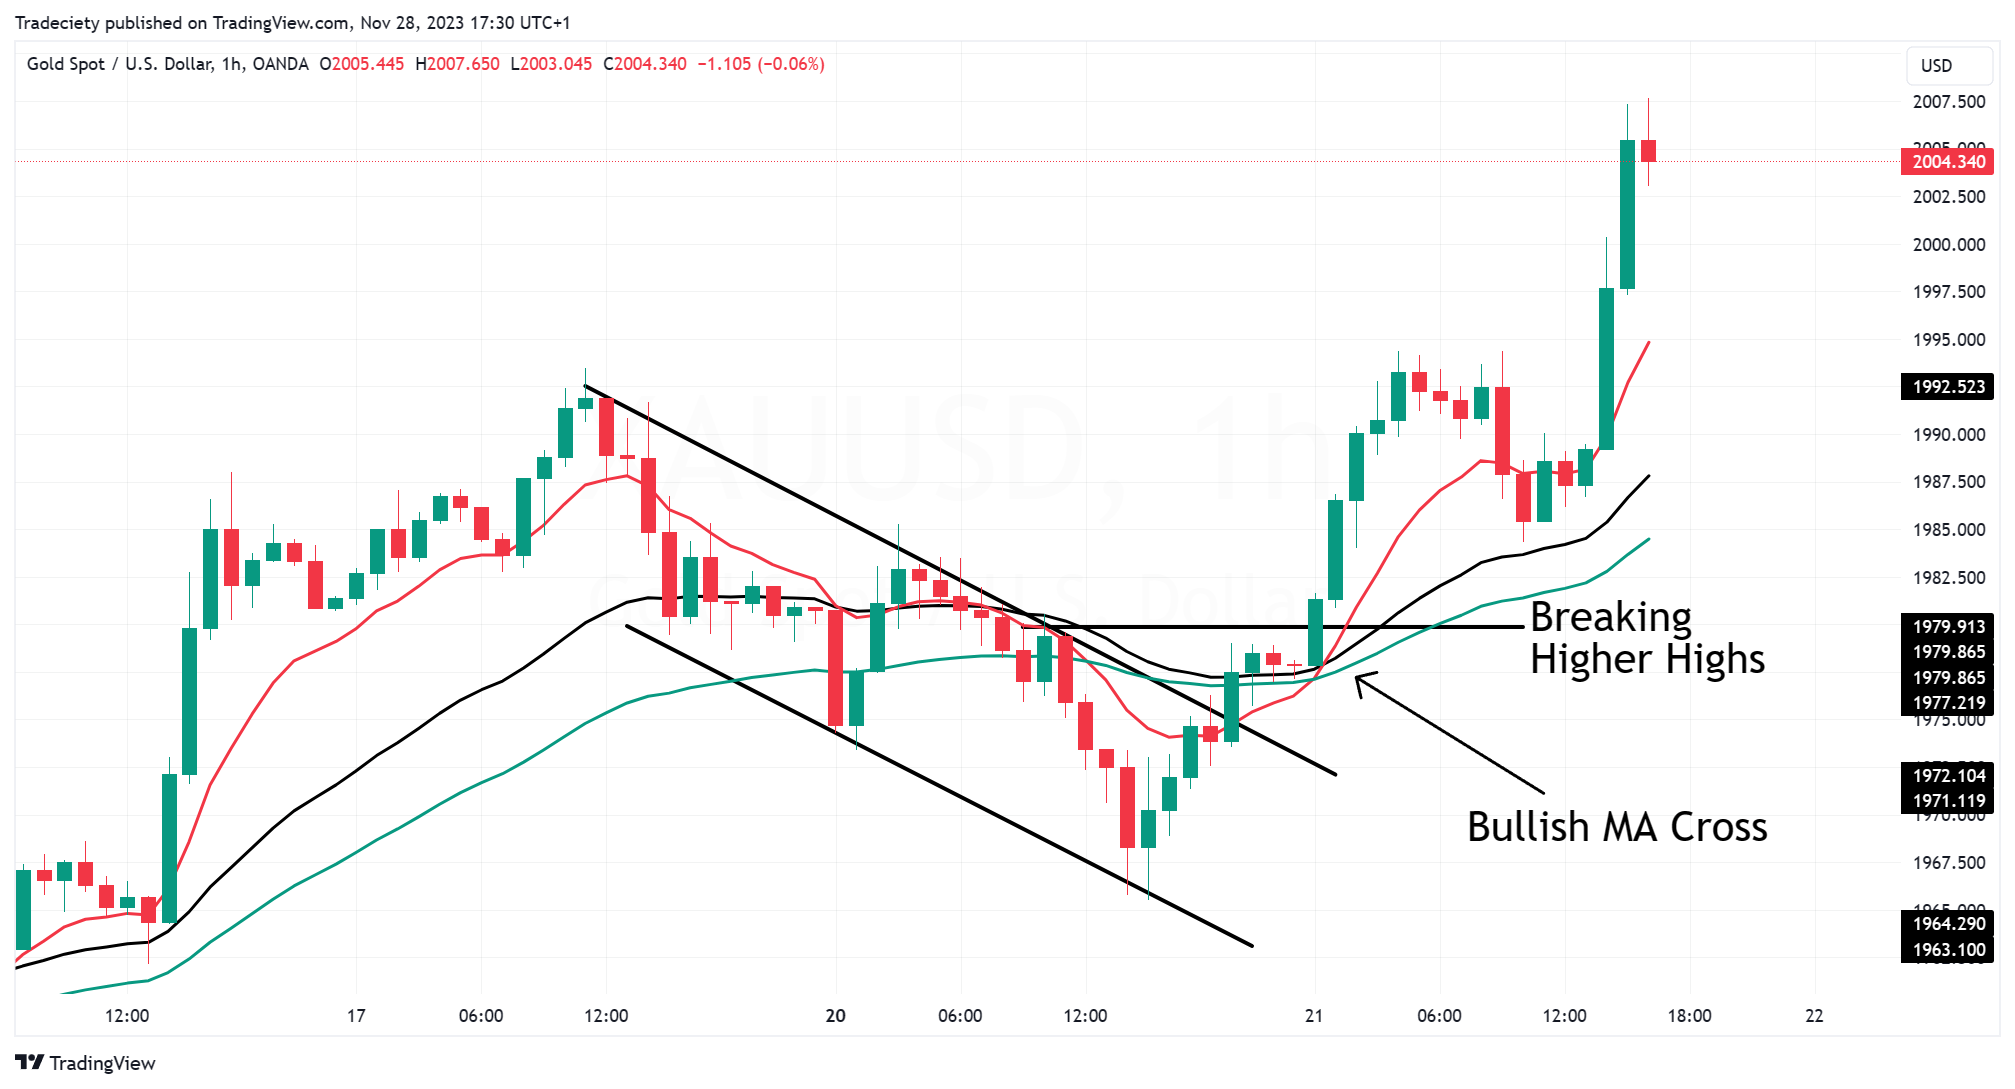
During the following bullish trend continuation, the short-term 10 EMA (red) stayed above the long-term moving averages, confirming the bullish trending phase.
In the example below, the bull flag pattern is forming after breaking above a previous resistance level in a long-term uptrend. The bull flag is retesting the previous resistance as support and even though the price is falling below the support level, it does not negate the quality of the bull flag pattern. Price is a dynamic concept and you do not always expect the price to react to chart drawings precisely; the overall idea of the setup and the context matters more than the precision.
After the first retest bull flag was broken, the impulsive trend wave continued the uptrend before entering a new, short-term bull flag. And once the new bull flag was broken, the price advanced higher again.
The bull flag is a versatile trend-following chart pattern that can be used in combination with a variety of other trading signals to build a robust trading strategy. Understanding the context in which the bull flag occurs is an important factor when it comes to reading trending markets and finding the best pullback opportunities.
external link:


We have been trading supply and demand strategies for over ten years, and they have stood the test of time remarkably well. Supply and demand is...

3 min read
Choosing the right trading journal is essential for traders wanting to analyze performance, refine strategies, and improve consistency. In this...

3 min read
“95% of all traders fail” is the most commonly used trading related statistic around the internet. But no research paper exists that proves this...