Supply and Demand Trading in 2026
We have been trading supply and demand strategies for over ten years, and they have stood the test of time remarkably well. Supply and demand is...
This is going be a short piece on multi time frame (MTF) analysis which will be incredibly valuable to you – this knowledge changed my life, that’s for sure. Every sophisticated trading strategy out there is using an MTF approach. The underlying idea is to go with the larger theme on the higher time frame, and then drill down to the lower time frame in order to gain impeccable timing and to increase our risk:reward ratio.
A simple example of that would be pattern trading. Once you see a double-top, for example, on the daily chart, you don’t have to wait until the last swing low gets broken before jumping in as classical charting principles tell you to. Simply go down to a 1-hour chart and look for another pattern there like an H&S or a broken trendline. Increase your RRR and your chances of having the pattern work out, easy.
Or look for S/R levels on the weekly chart, then go down to the daily chart and look for pin bars and outside bars – one of the simplest methods of MTF analysis.
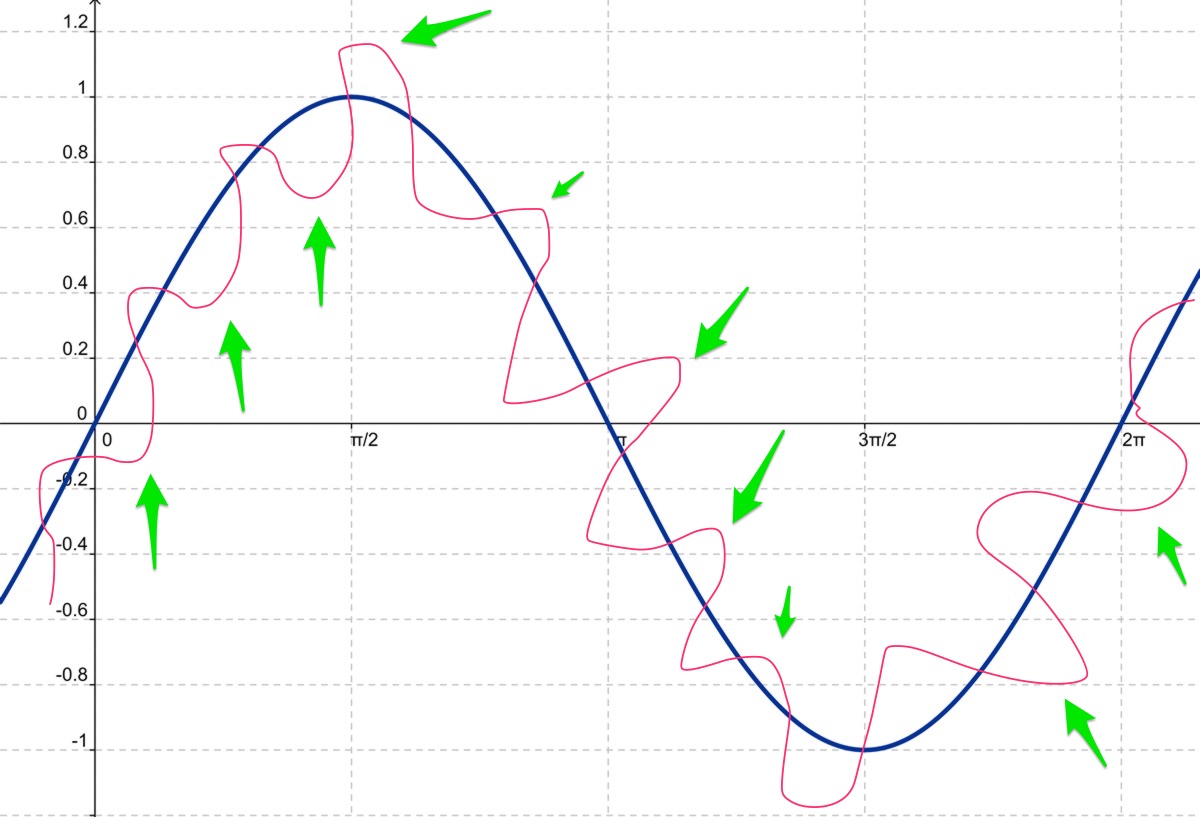
My favorite way to do MTF, however, is to use indicators – favorably, oscillators – with the same settings on two different timeframes. I then catch the moment when both the higher time frame indicator and the lower time frame indicator come from oversold or overbought and are moving in the same direction. This makes sure I am on the right side of the longer-term price cycle as well as the shorter-term price cycle. This makes it incredibly easy to almost always get enough reasonable movement to either exit with a small loss or profit, move a trade to break-even, or to let a trade run by managing it on the higher time frame. I first found this approach years ago in a thread on Forex Factory, and the trader there got it from a book called “High Probability Trading” by Marcel Link – a great read, by the way. Take a look at the following picture, a simple sine curve.
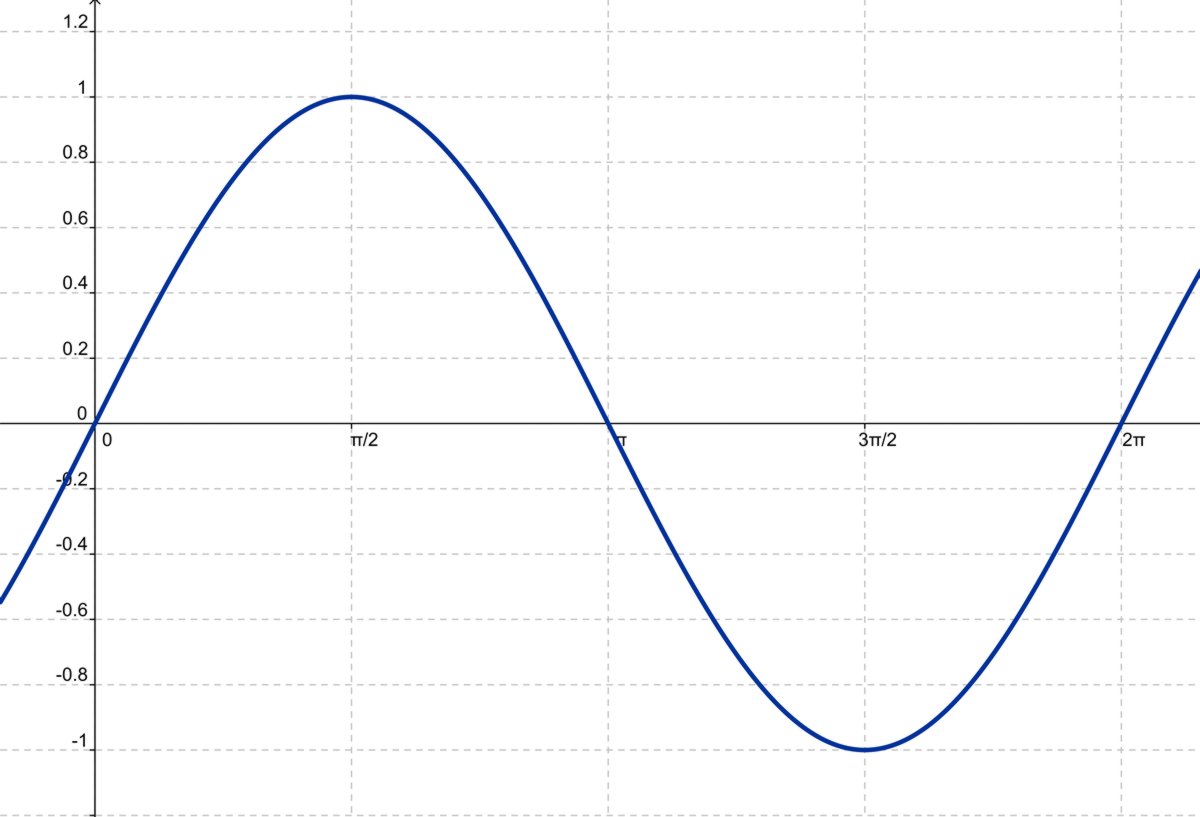
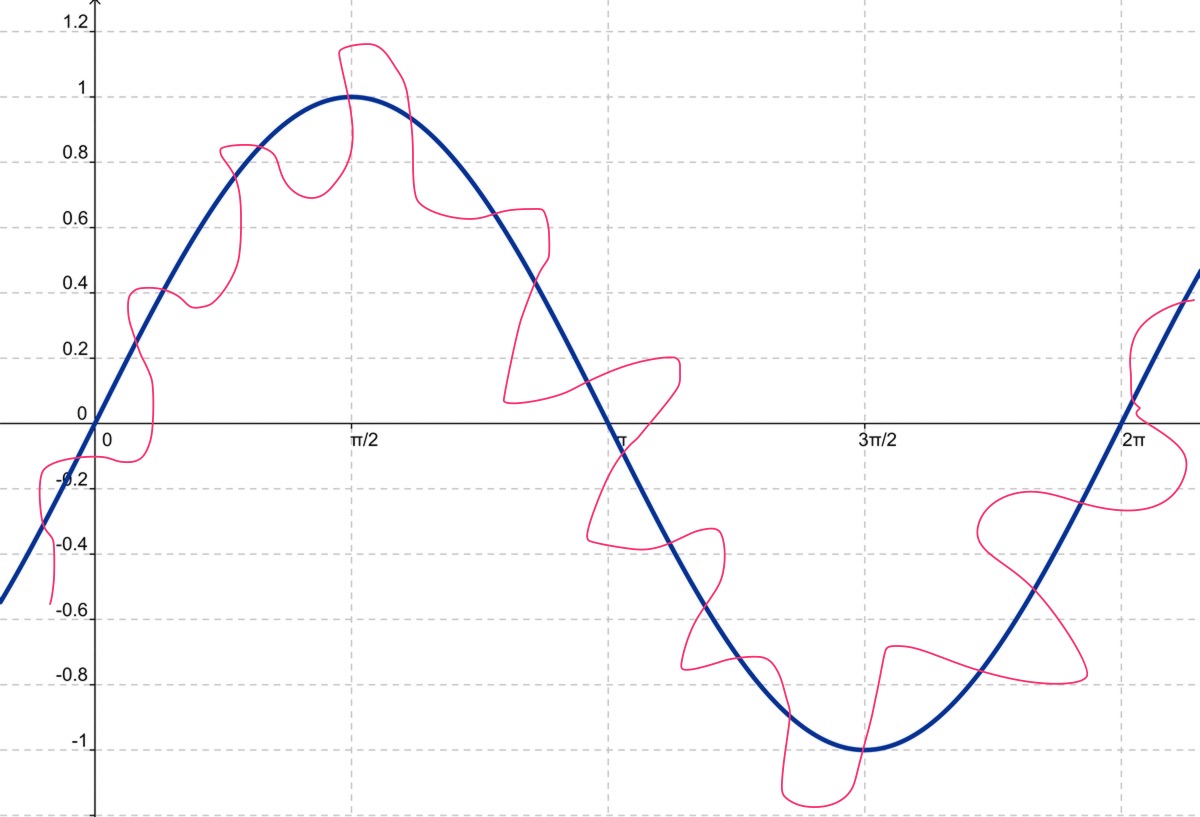
Let’s imagine that this is our higher time frame trend. The short-term trend is swinging around this long-term trend – simply add two moving averages of different lengths to your chart and you will get the same picture. If you didn’t notice until now, trading moving average crosses follows the same principle of getting in on the short-term trend in direction of the long-term trend. You will also quickly see why trading moving average crosses on their own is such a shitty idea.
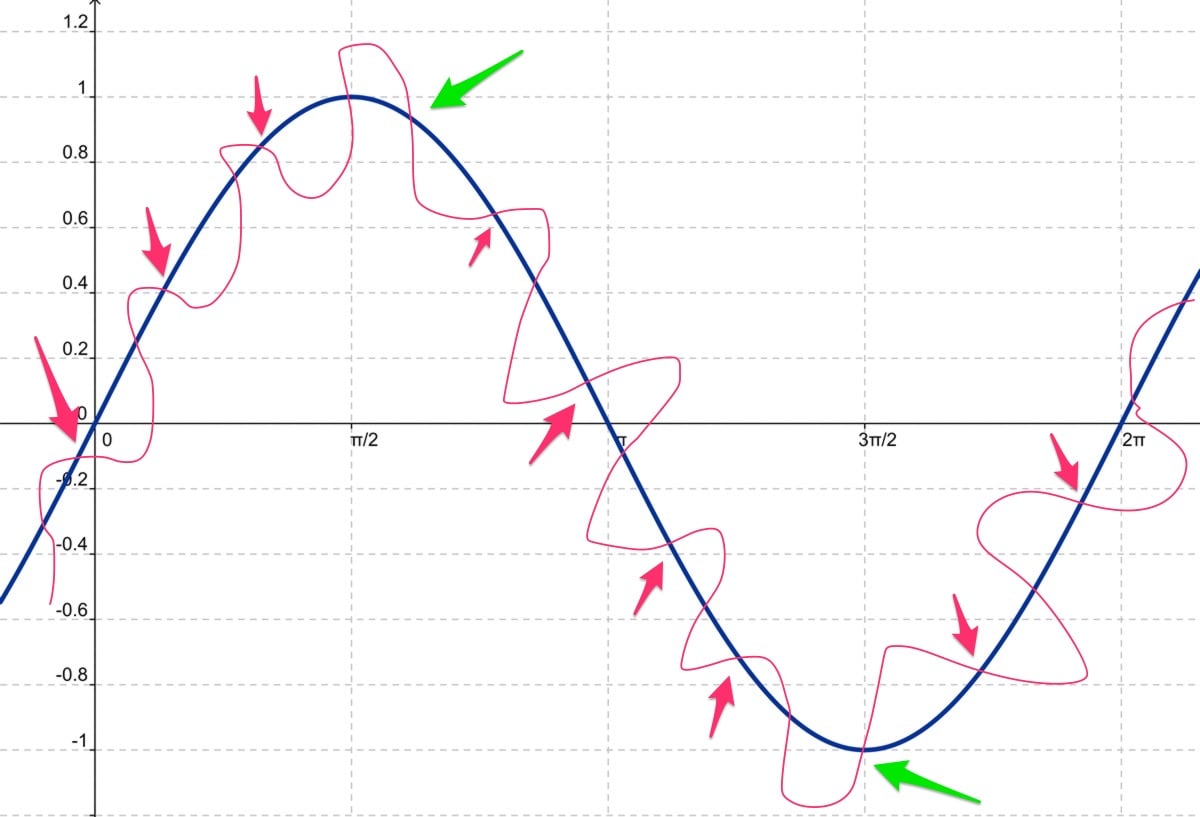
Do you see where the MA crossover strategy would get completely slaughtered? Well… (down-arrows stand for shorts, up-arrows for longs).
Every pink arrow would have resulted in a loss, every green arrow in a win. Good luck with that – lots of entries during ranging times and the occasional runner, and most people just don’t know how to let a trade run or when to get out. That is also why many people trade 3 or more moving averages in order to avoid fakeouts, or look at the angle of the moving averages, or use additional indicators as filters and so on. But I am just not a fan, I must admit, even though for quite some time I was trading a strategy with multiple moving averages successfully because I have the ability to read the market environment – something that will make almost every strategy perform at least at break-even. There are just easier ways to trade.
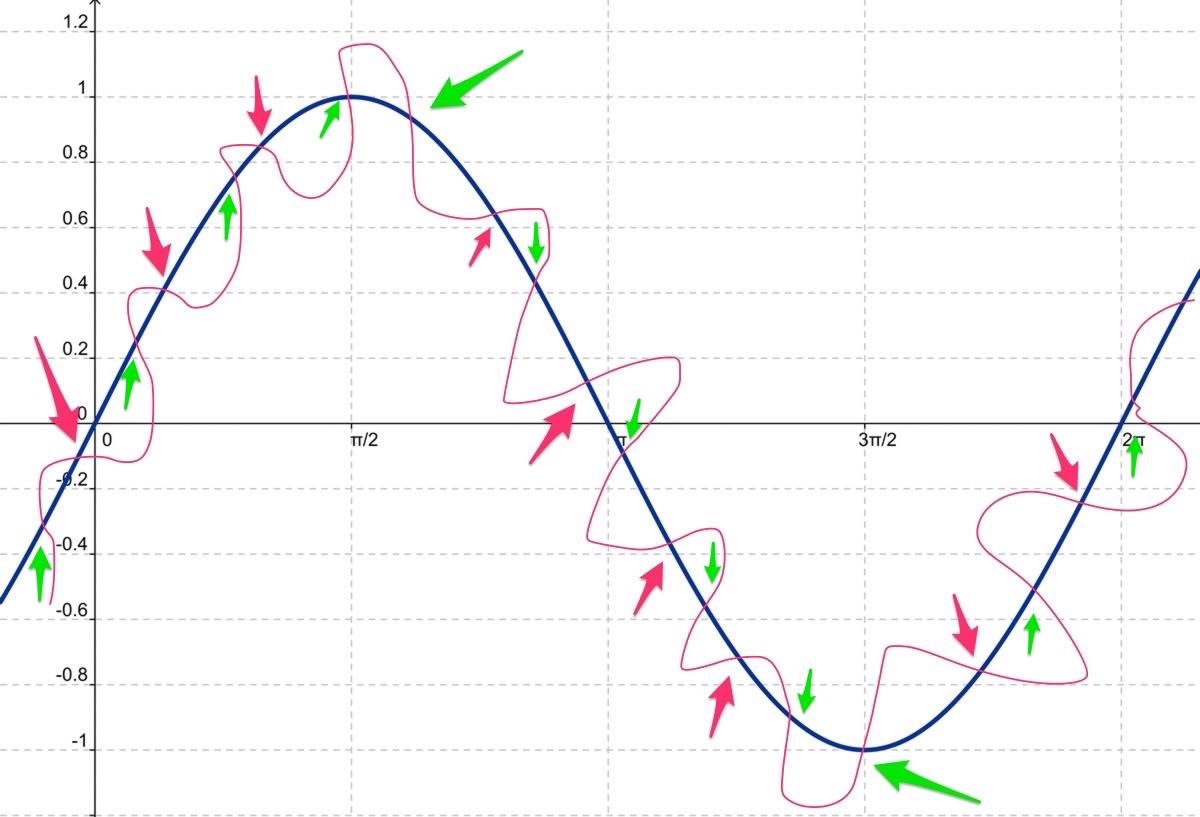
Now, which trades would we have taken if we went with the longer-term oscillator momentum and the shorter-term oscillator momentum at the same time, say, the Stochastic Oscillator on the M5 and the M15 time frame?
That looks much friendlier, doesn’t it? Note that if we go with the long-term momentum, we, of course, don’t take crosses of the short-term oscillator into the opposing direction. Also, we enter at the peaks and valleys, giving us a lot more time to move our stops to break-even or to get out with minimum impact to our account, making it much easier to manage our trades. Whoever says oscillators don’t work is a nutjob in my eyes. They are by far my most favorite indicators out there and work incredibly well in every (yes, every!) trading environment – if you KNOW how to read the trading environment, which always comes first, of course. Unfortunately, most strategies are – unintentionally – optimized for one trading environment only, and thus traders get slaughtered on a regular basis because they misunderstand the premises of such systems.
By the way, which would be my favorite two trades of all the trades on the chart above?
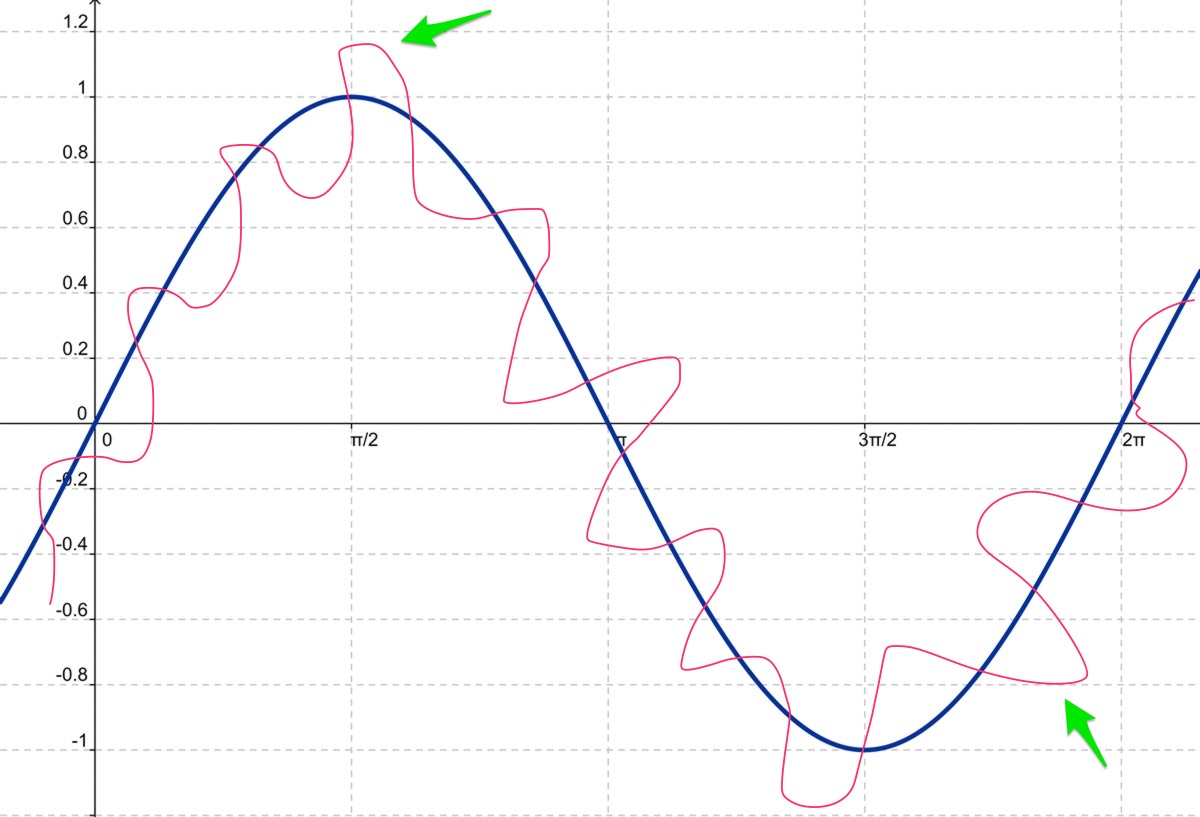
Yep, when the higher time frame momentum just turned and our lower time frame momentum aligns, those are the triple-A trades we are looking for. The others are also good trades, but the more we go into oversold or overbought territory on the higher time frame, the more cautious we have to become unless the trend is fueled by a fundamental backdrop. A move of the Stochastic Oscillator into overbought and an extended stay in that territory can very much signal strength rather than exhaustion, but that is another topic for another day. Let’s take a look at a real-life example of what we just learned.
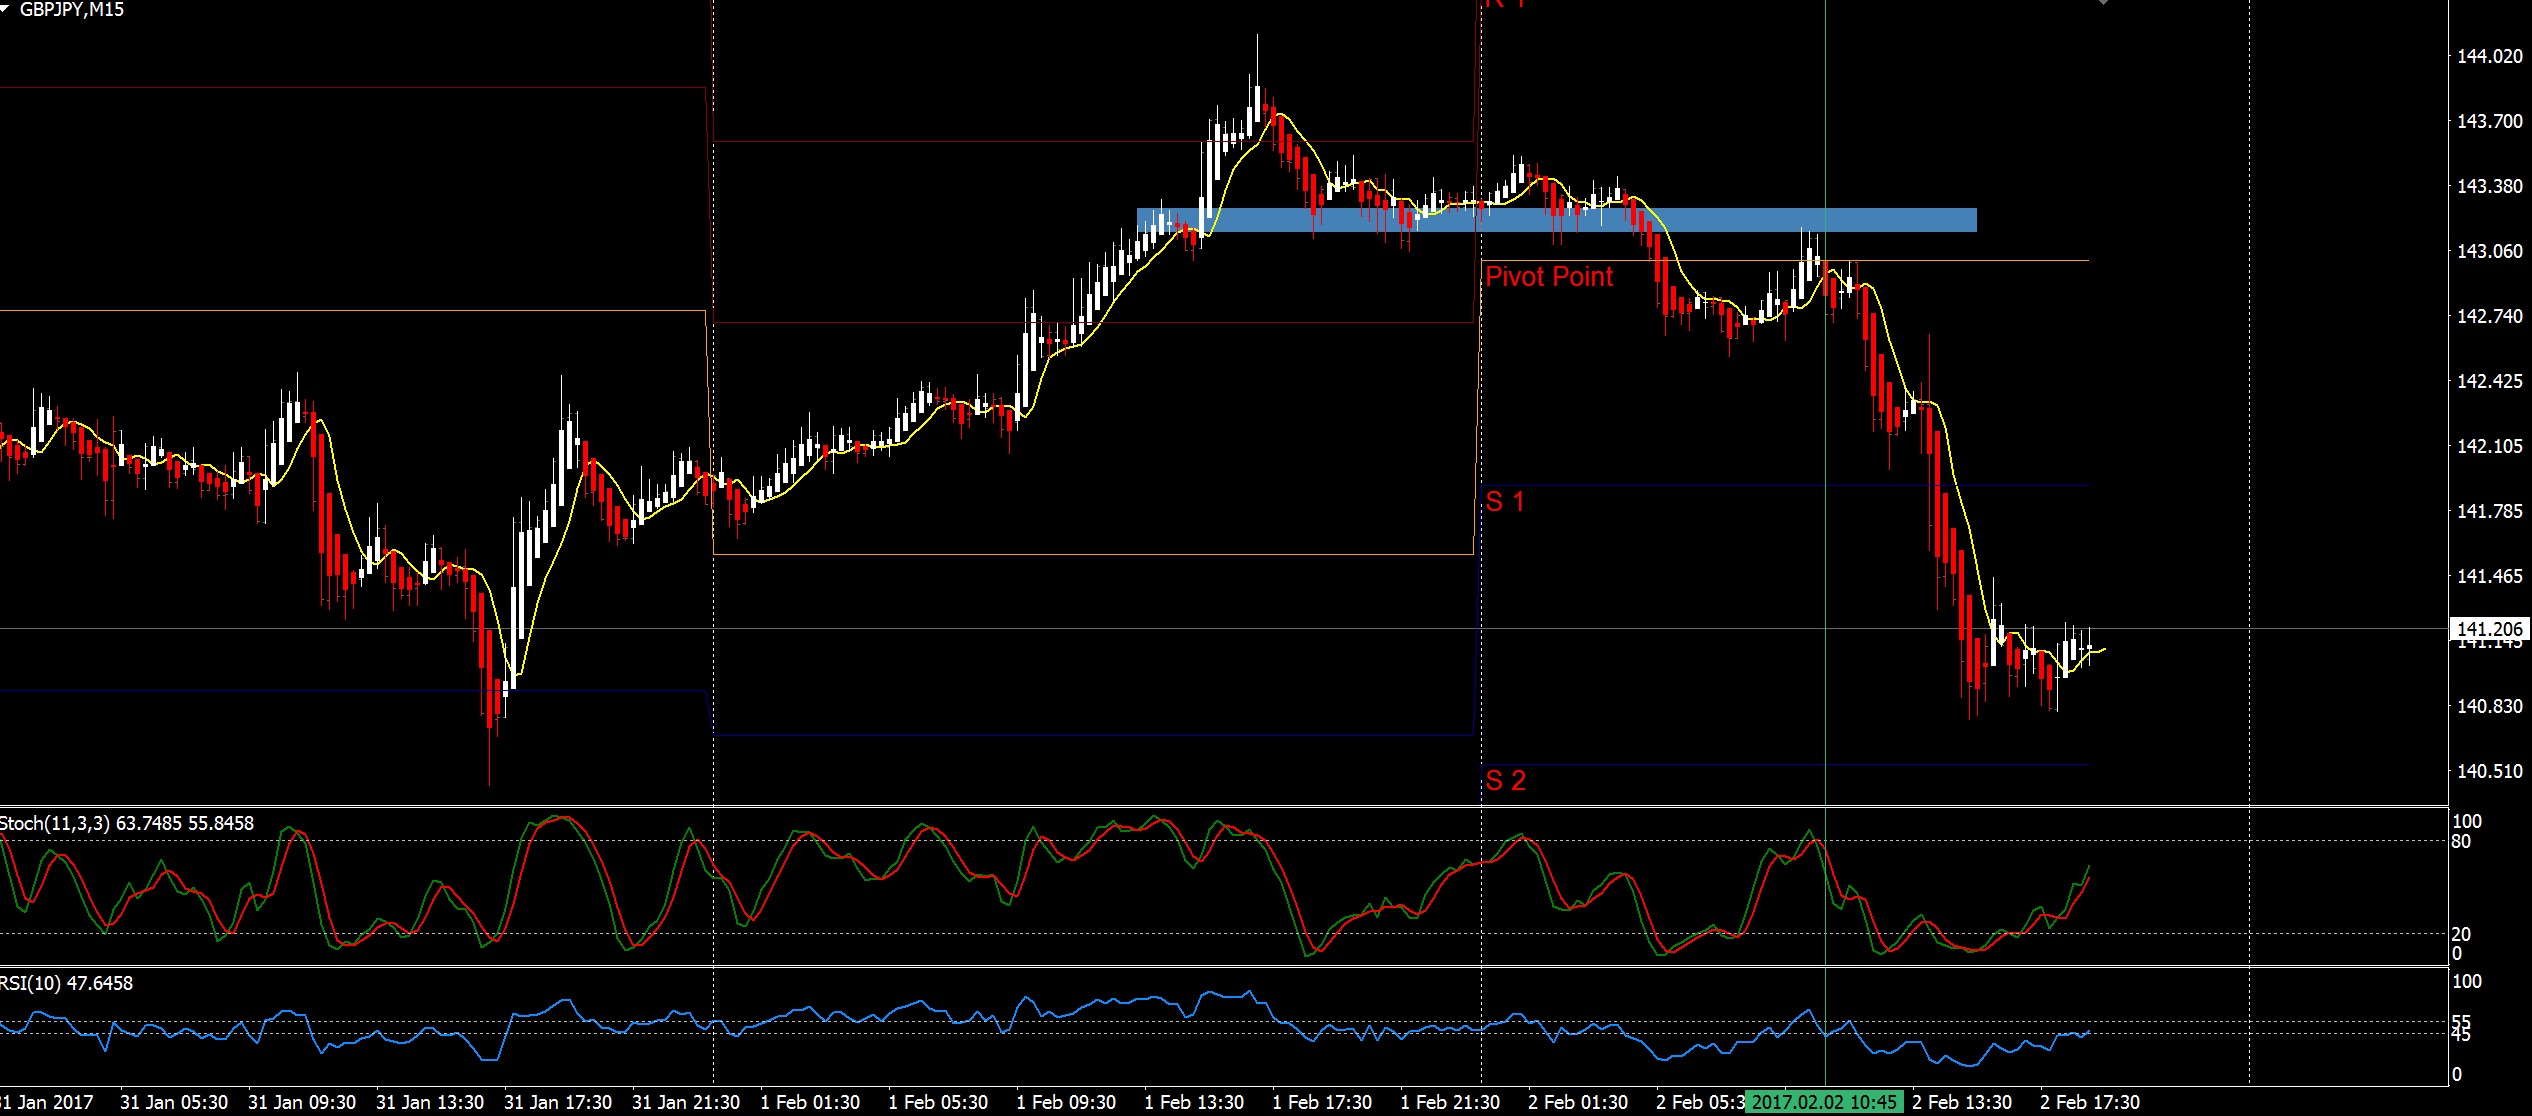
As always, there is no substitute for doing your homework. Analyze the trend, mark your highs and lows, see what price is doing. Here, after an extended drive up, we consolidated, broke below that consolidation and the daily pivot point, retested both from below and then our Stochastic turned to the downside (green line) after a white Heiken Ashi Doji (a reversal candle on Heiken Ashi charts). There are other reasons why price got rejected so harshly from the level above and why I have reason to believe that price will move lower here, but for simplicity’s sake, I will omit these reasons today. Now, let’s move down to the M5. We are on the right side of the price cycle on the M15 already.

Surprise, surprise, the M5 aligns itself with the M15 Stochastic and we have an incredibly great momentum trade on our hands (as the Stochastic Oscillator is not only an overbought/oversold indicator but very much a momentum indicator, as well!).
We could have entered at the green line, but if you are like me and want additional confirmation, you will wait for the local trendline to break and enter at the yellow line (again a prime example of MTF analysis, the blue zone comes from the M15, the green trendline becomes visible on the M5, everything falls into place, we pull the trigger).
Will we get faked out with this method? You bet on it. Will it make our trading much easier to always be on the right side of the price cycle, so we can easily get our trades to break even or book a small profit because price will almost never turn on us the moment we get in? Hell yeah. Also, as we go with momentum, we get easy exits. Price doesn’t move after you got in? Well, then get out – no momentum, no trade!
I just explained to you the very “secret” behind my trend trading. It is really that simple and makes a lot of sense once you see it happen on the charts day in, day out. Hunting emerging momentum is tons of fun. Enjoy!
external link:


We have been trading supply and demand strategies for over ten years, and they have stood the test of time remarkably well. Supply and demand is...

3 min read
Choosing the right trading journal is essential for traders wanting to analyze performance, refine strategies, and improve consistency. In this...

3 min read
“95% of all traders fail” is the most commonly used trading related statistic around the internet. But no research paper exists that proves this...