
Supply and Demand Trading in 2026
We have been trading supply and demand strategies for over ten years, and they have stood the test of time remarkably well. Supply and demand is...
Elliot Wave Theory (EWT) is a popular method of technical analysis that helps traders predict market trends by analyzing the psychology of market participants. Developed in the 1930s, this theory suggests that market prices follow specific patterns driven by collective investor behavior, known as waves. Understanding these waves allows traders to forecast potential price movements and adjust their strategies accordingly. By mastering Elliot Wave theory trading, traders can gain insights into the structure of market trends, ultimately improving their ability to identify opportunities and manage risk.
This guide will explore how Elliot Wave Theory can be applied to real-world trading scenarios.
At its core, Elliot Wave Theory revolves around the concept of fractals—structures that are self-similar at different scales and timeframes. Market trends often form a wave structure, which consists of two primary types: impulsive waves and corrective waves.
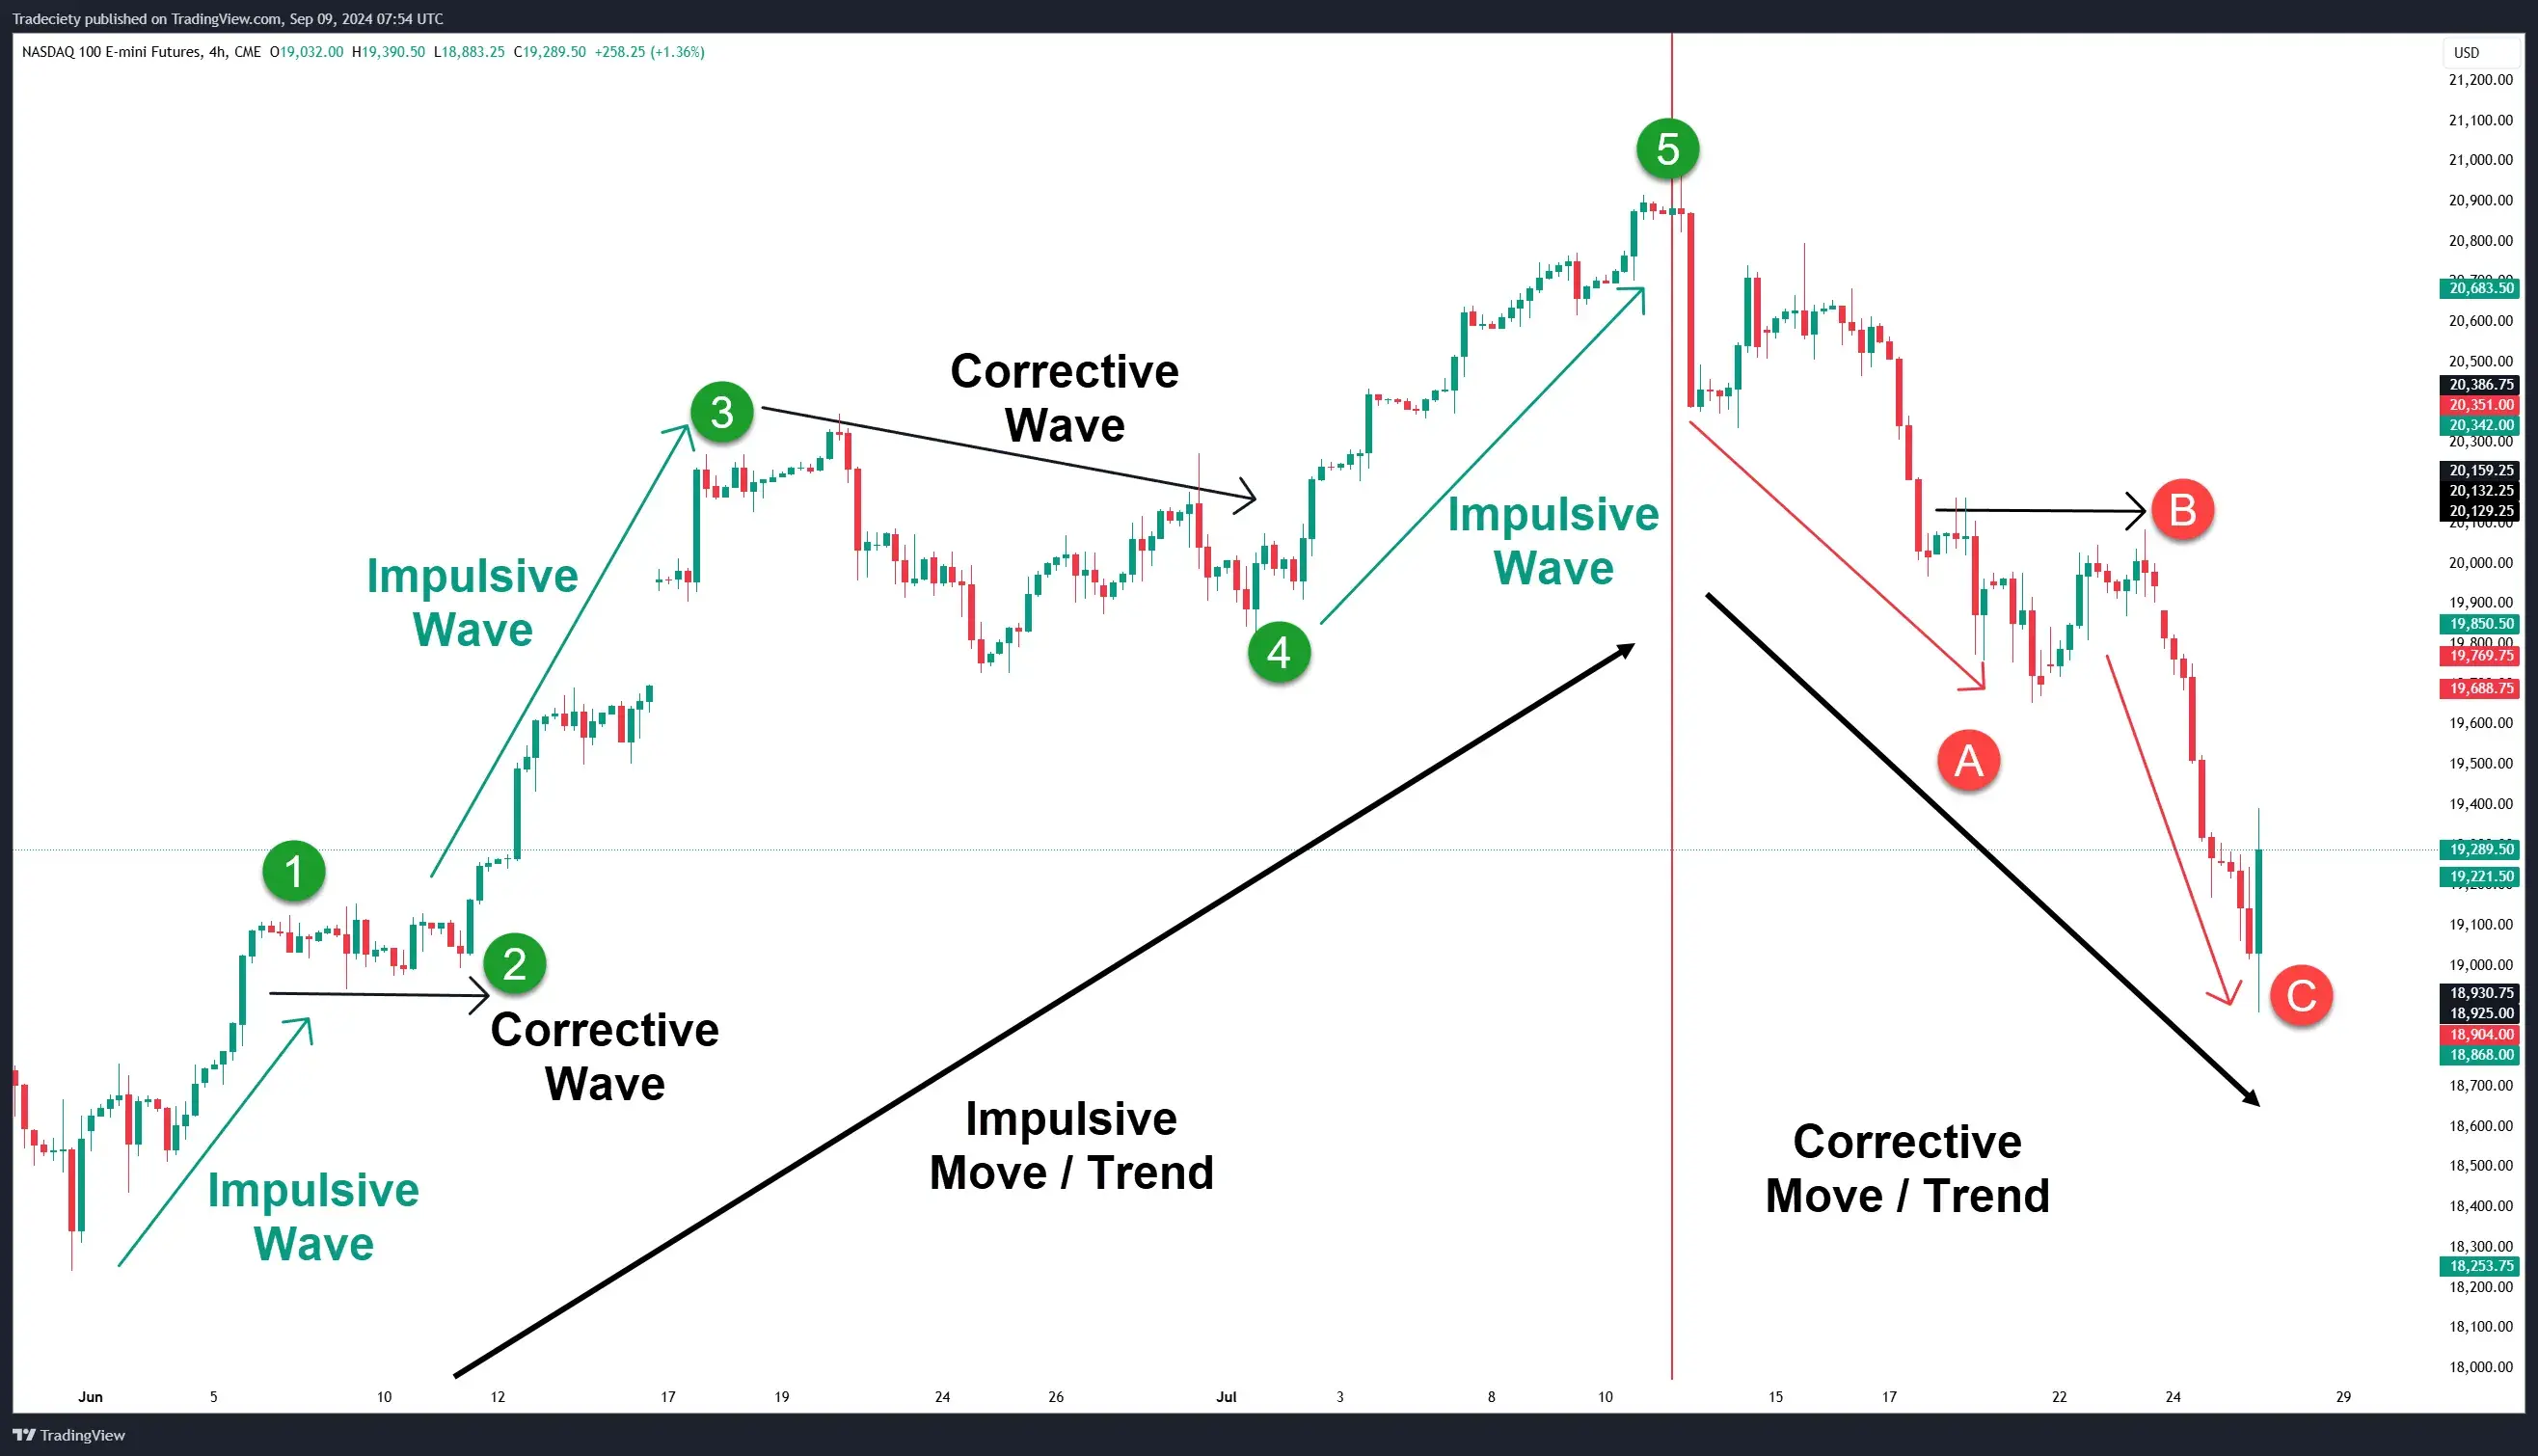
The theory is based on a 5-3 wave structure: five waves that move in the direction of the overall trend, followed by three waves that correct this movement.
Impulsive Move / Uptrend: These waves follow the main trend and consist of five sub-waves, labeled 1 – 5. Within the five trend-following waves, the price forms three impulsive and 2 corrective waves.
Impulsive waves: Trend waves that push the price higher in the ongoing uptrend. Impulsive waves are longer and stronger than corrective waves.
Corrective waves: Shorter waves that go against the ongoing trend direction.
Corrective Move / Downtrend: These counter the primary trend and are typically made up of three waves, labeled A-B-C. The start of the corrective move is confirmed when the first wave breaks below the low of a previous impulsive wave.
Understanding these core principles allows traders to identify the natural ebb and flow of market trends, making it easier to anticipate future price directions.
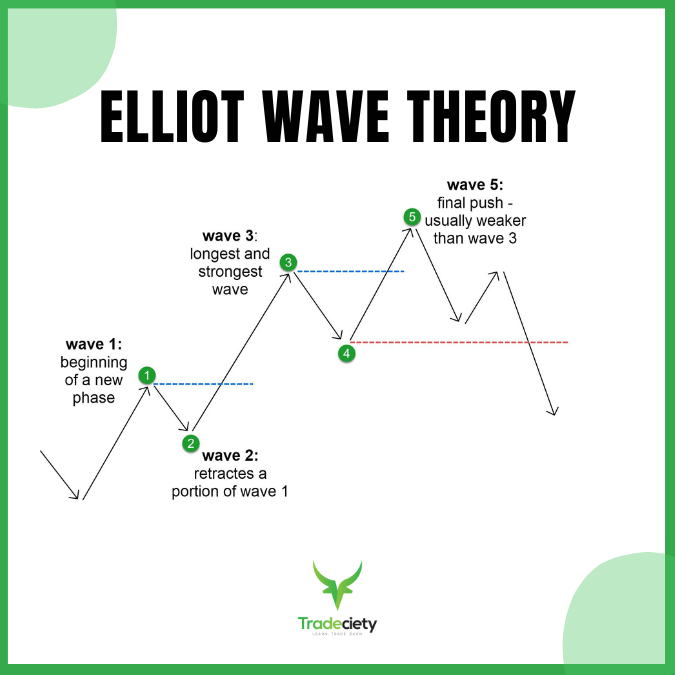
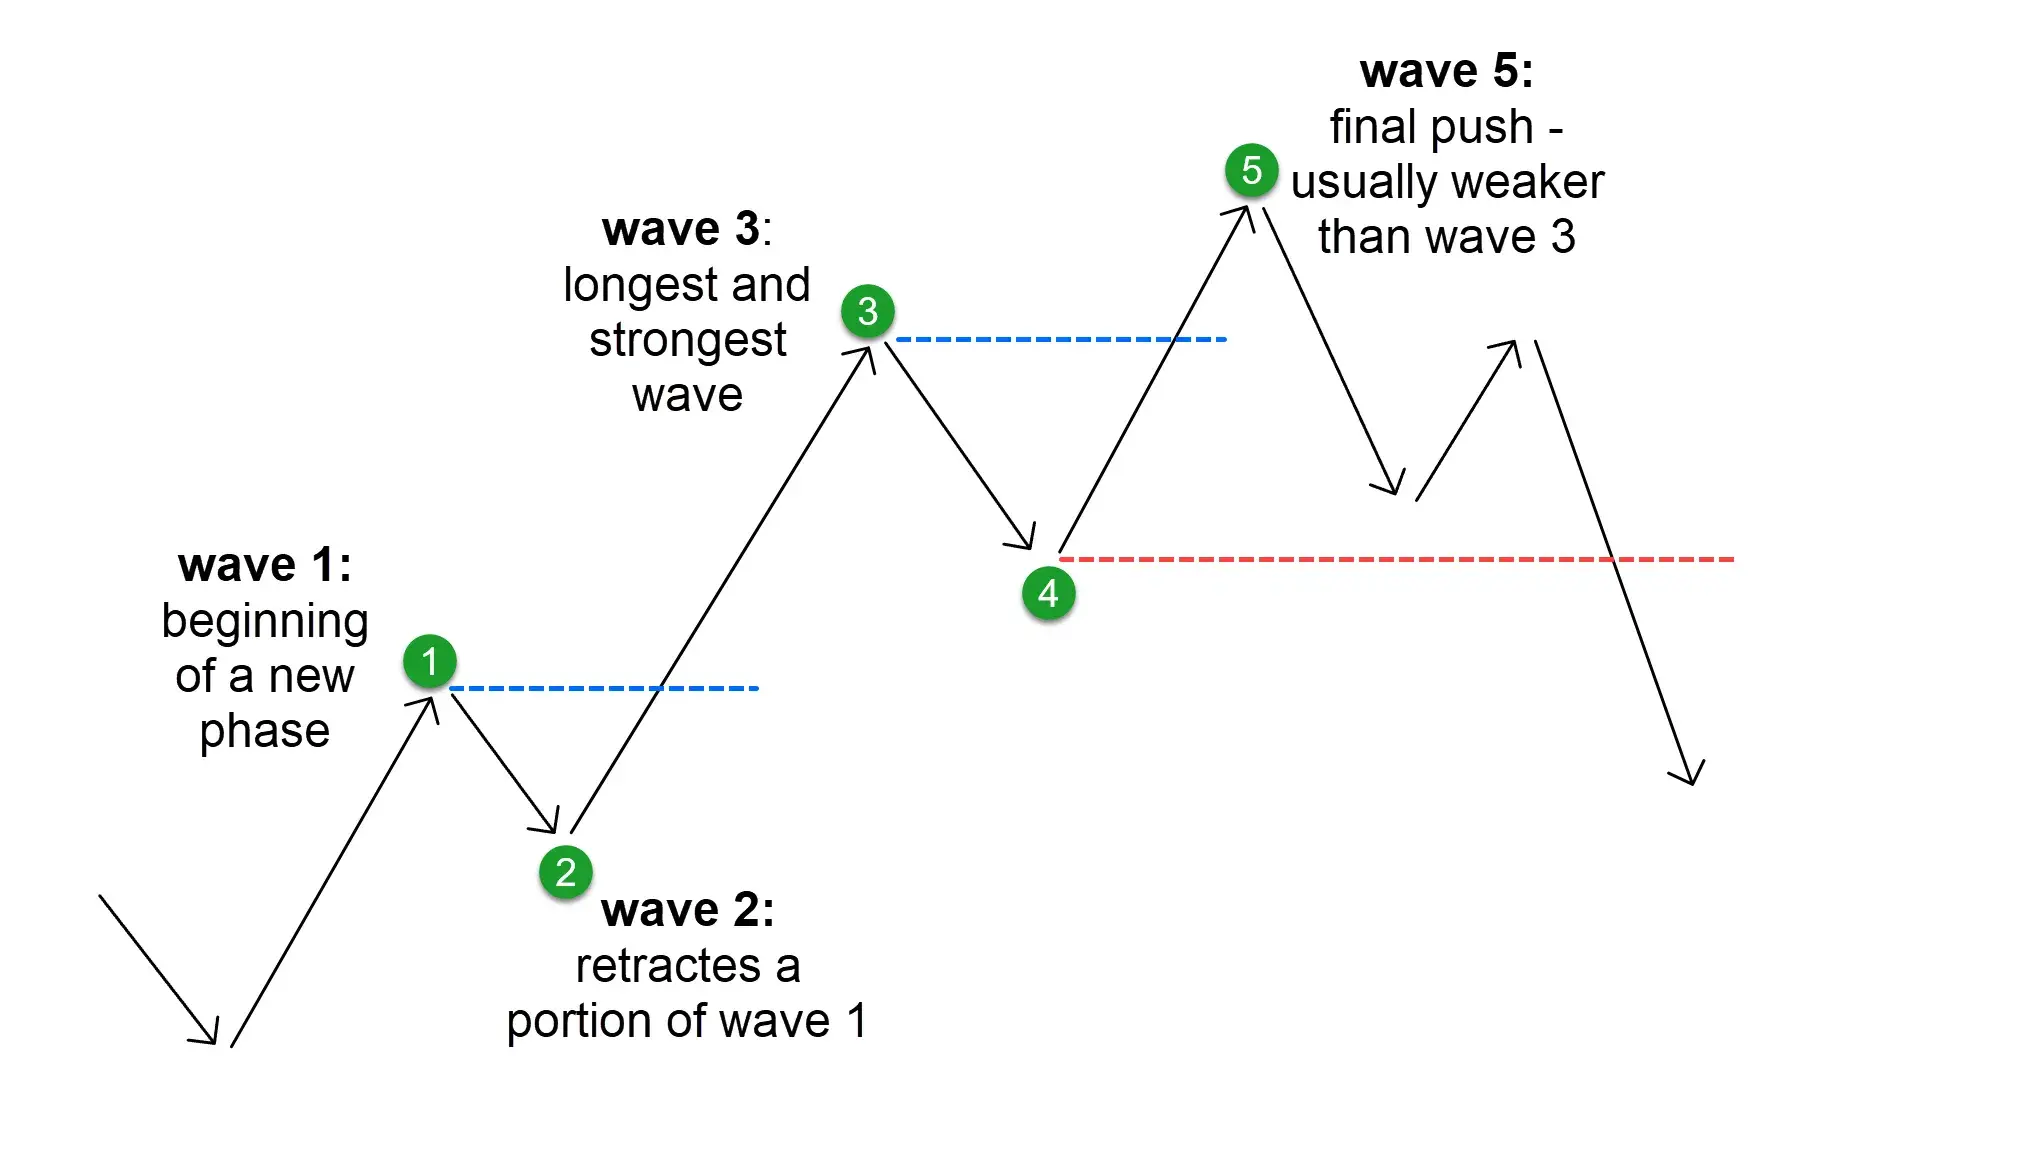
The impulsive phase is the heart of Elliot Wave Theory trading. It reflects the dominant trend in the market and consists of five distinct waves that indicate the progress of the trend:
Wave 1 (impulsive): Often marks the beginning of a new trend, but is not always easy to recognize at first.
Wave 2 (corrective): A corrective wave, typically retracing a portion of Wave 1's movement.
Wave 3 (impulsive): The strongest and most extended wave, often where the bulk of profits are made as the trend gains momentum.
Wave 4 (corrective): Another corrective wave, often shorter and less volatile than Wave 2.
Wave 5 (impulsive): Final push in the direction of the trend, though weaker than Wave 3 as traders begin to take profits.
Each wave within this structure plays a crucial role in identifying the overall market trend. For example, spotting Wave 3 early can offer a prime opportunity for entering a trade in the direction of the prevailing trend.
When a corrective wave breaks the low point of wave 4, a long-term trend reversal is taking place.
Corrective waves help traders understand when the market is poised to reverse or slow down.
Unlike impulsive waves, corrective waves move against the main trend. These waves are more challenging to trade since they represent market consolidations rather than clear trends.
By identifying corrective waves, traders can time trend-following trades at tipping points, when the corrective waves go over into the next impulsive wave.
The most common corrective chart patterns include:
Zigzag: A sharp, straight correction with steep declines.
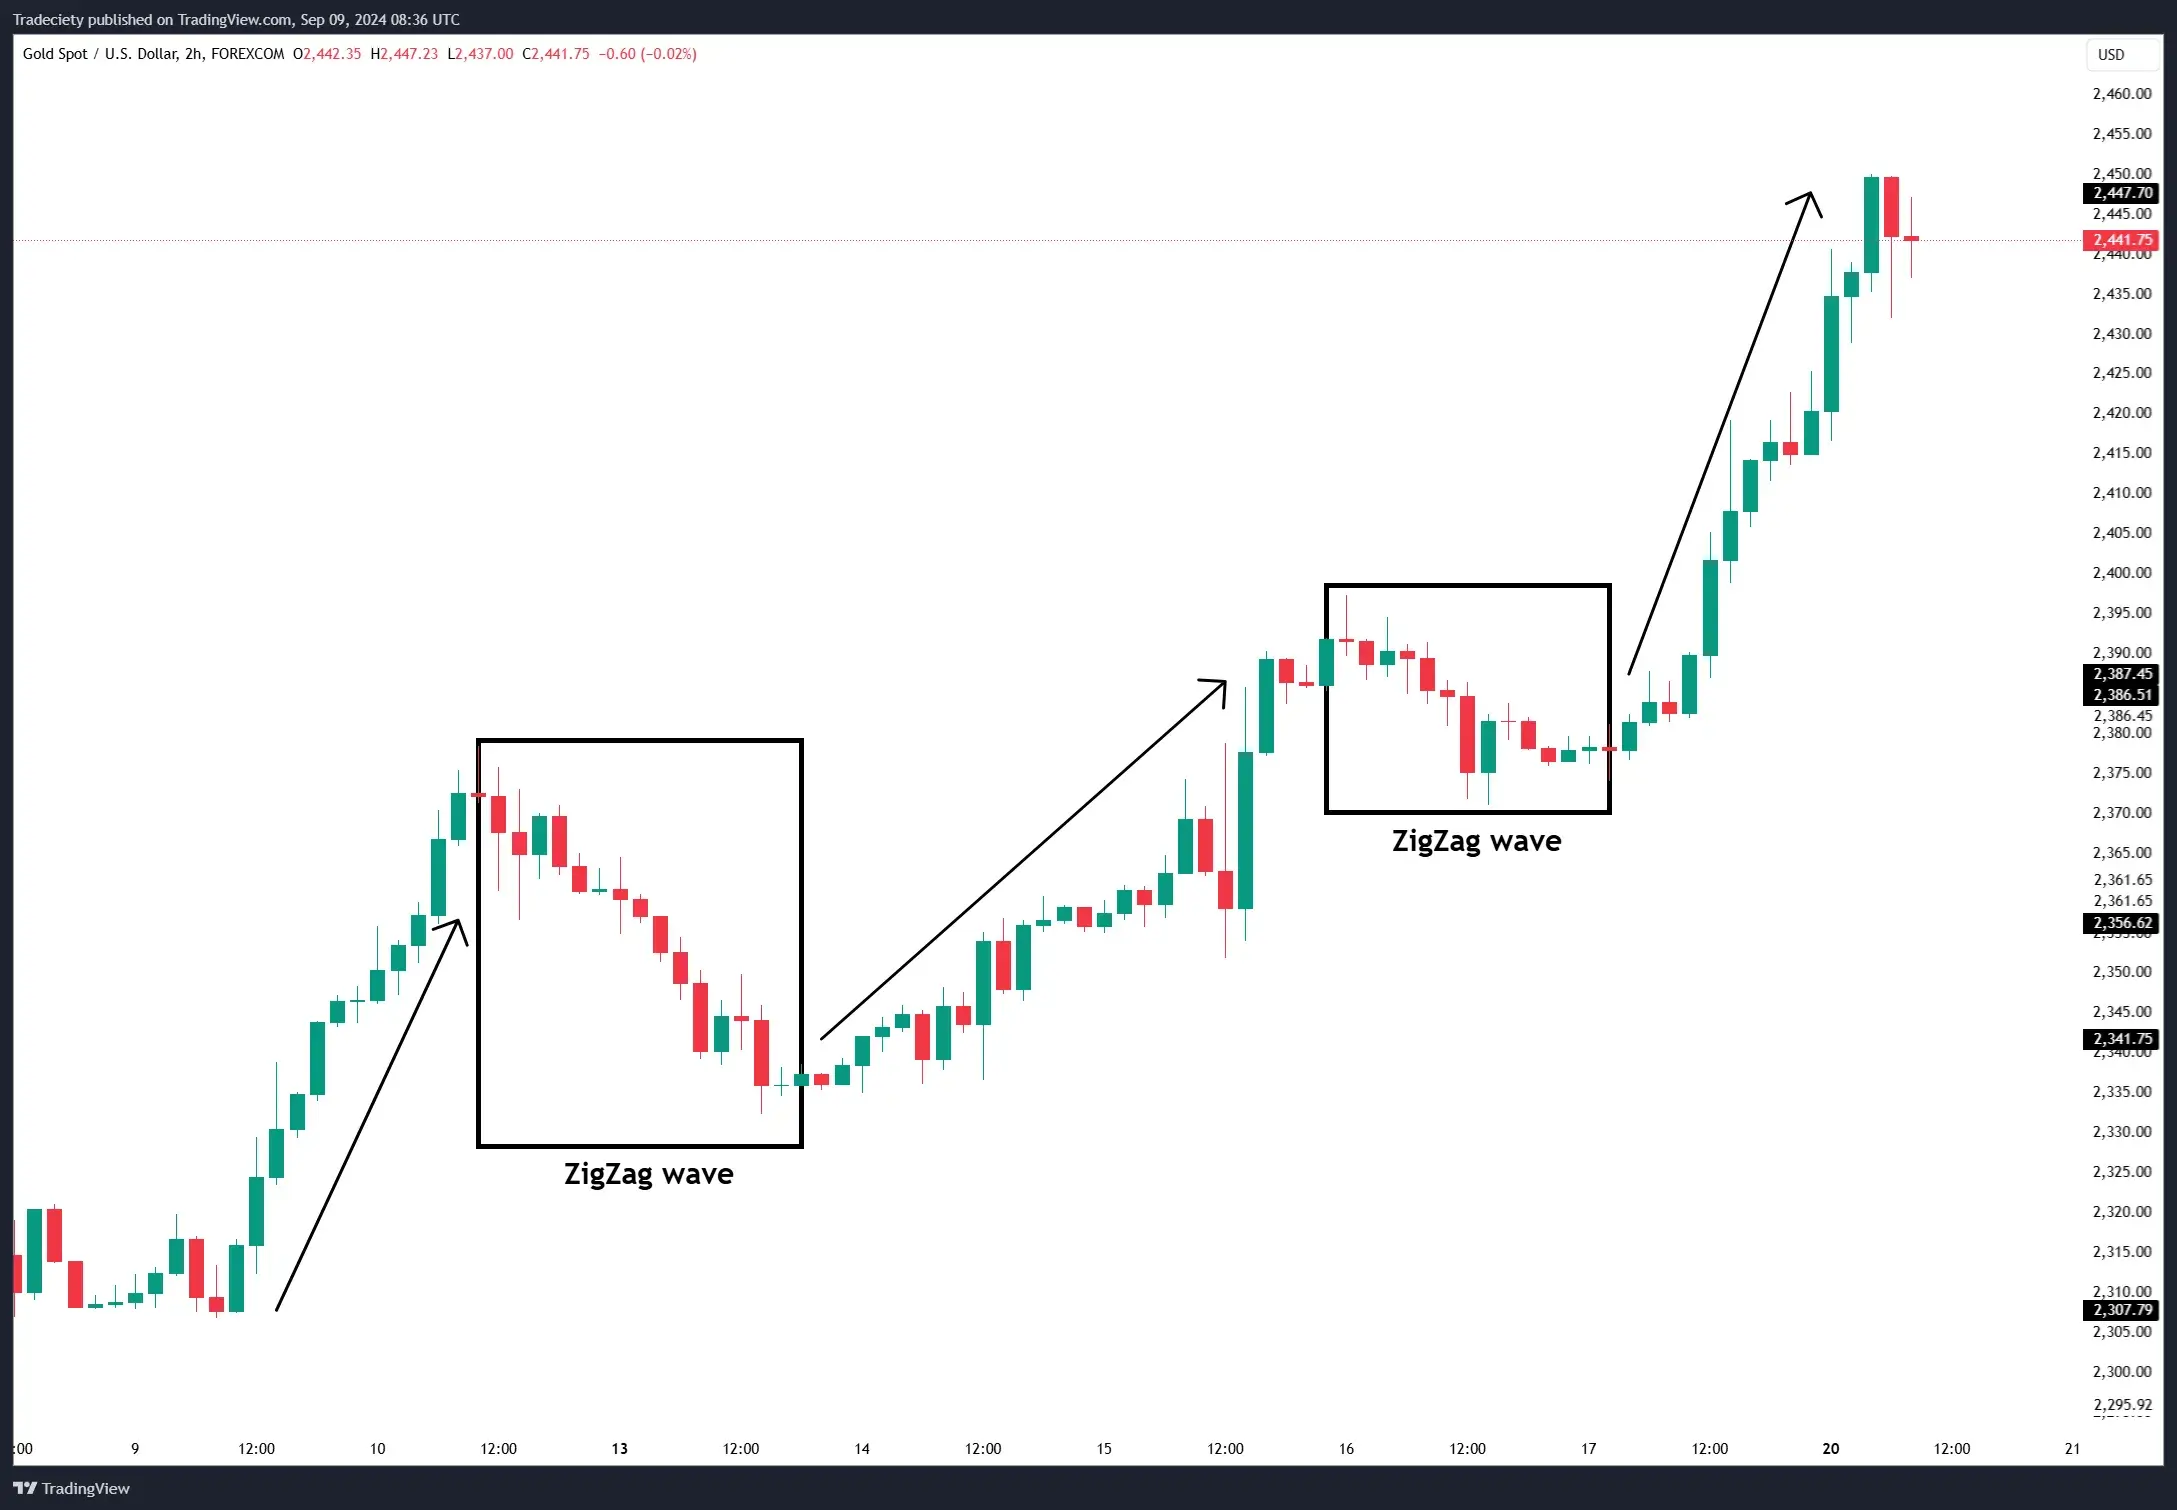
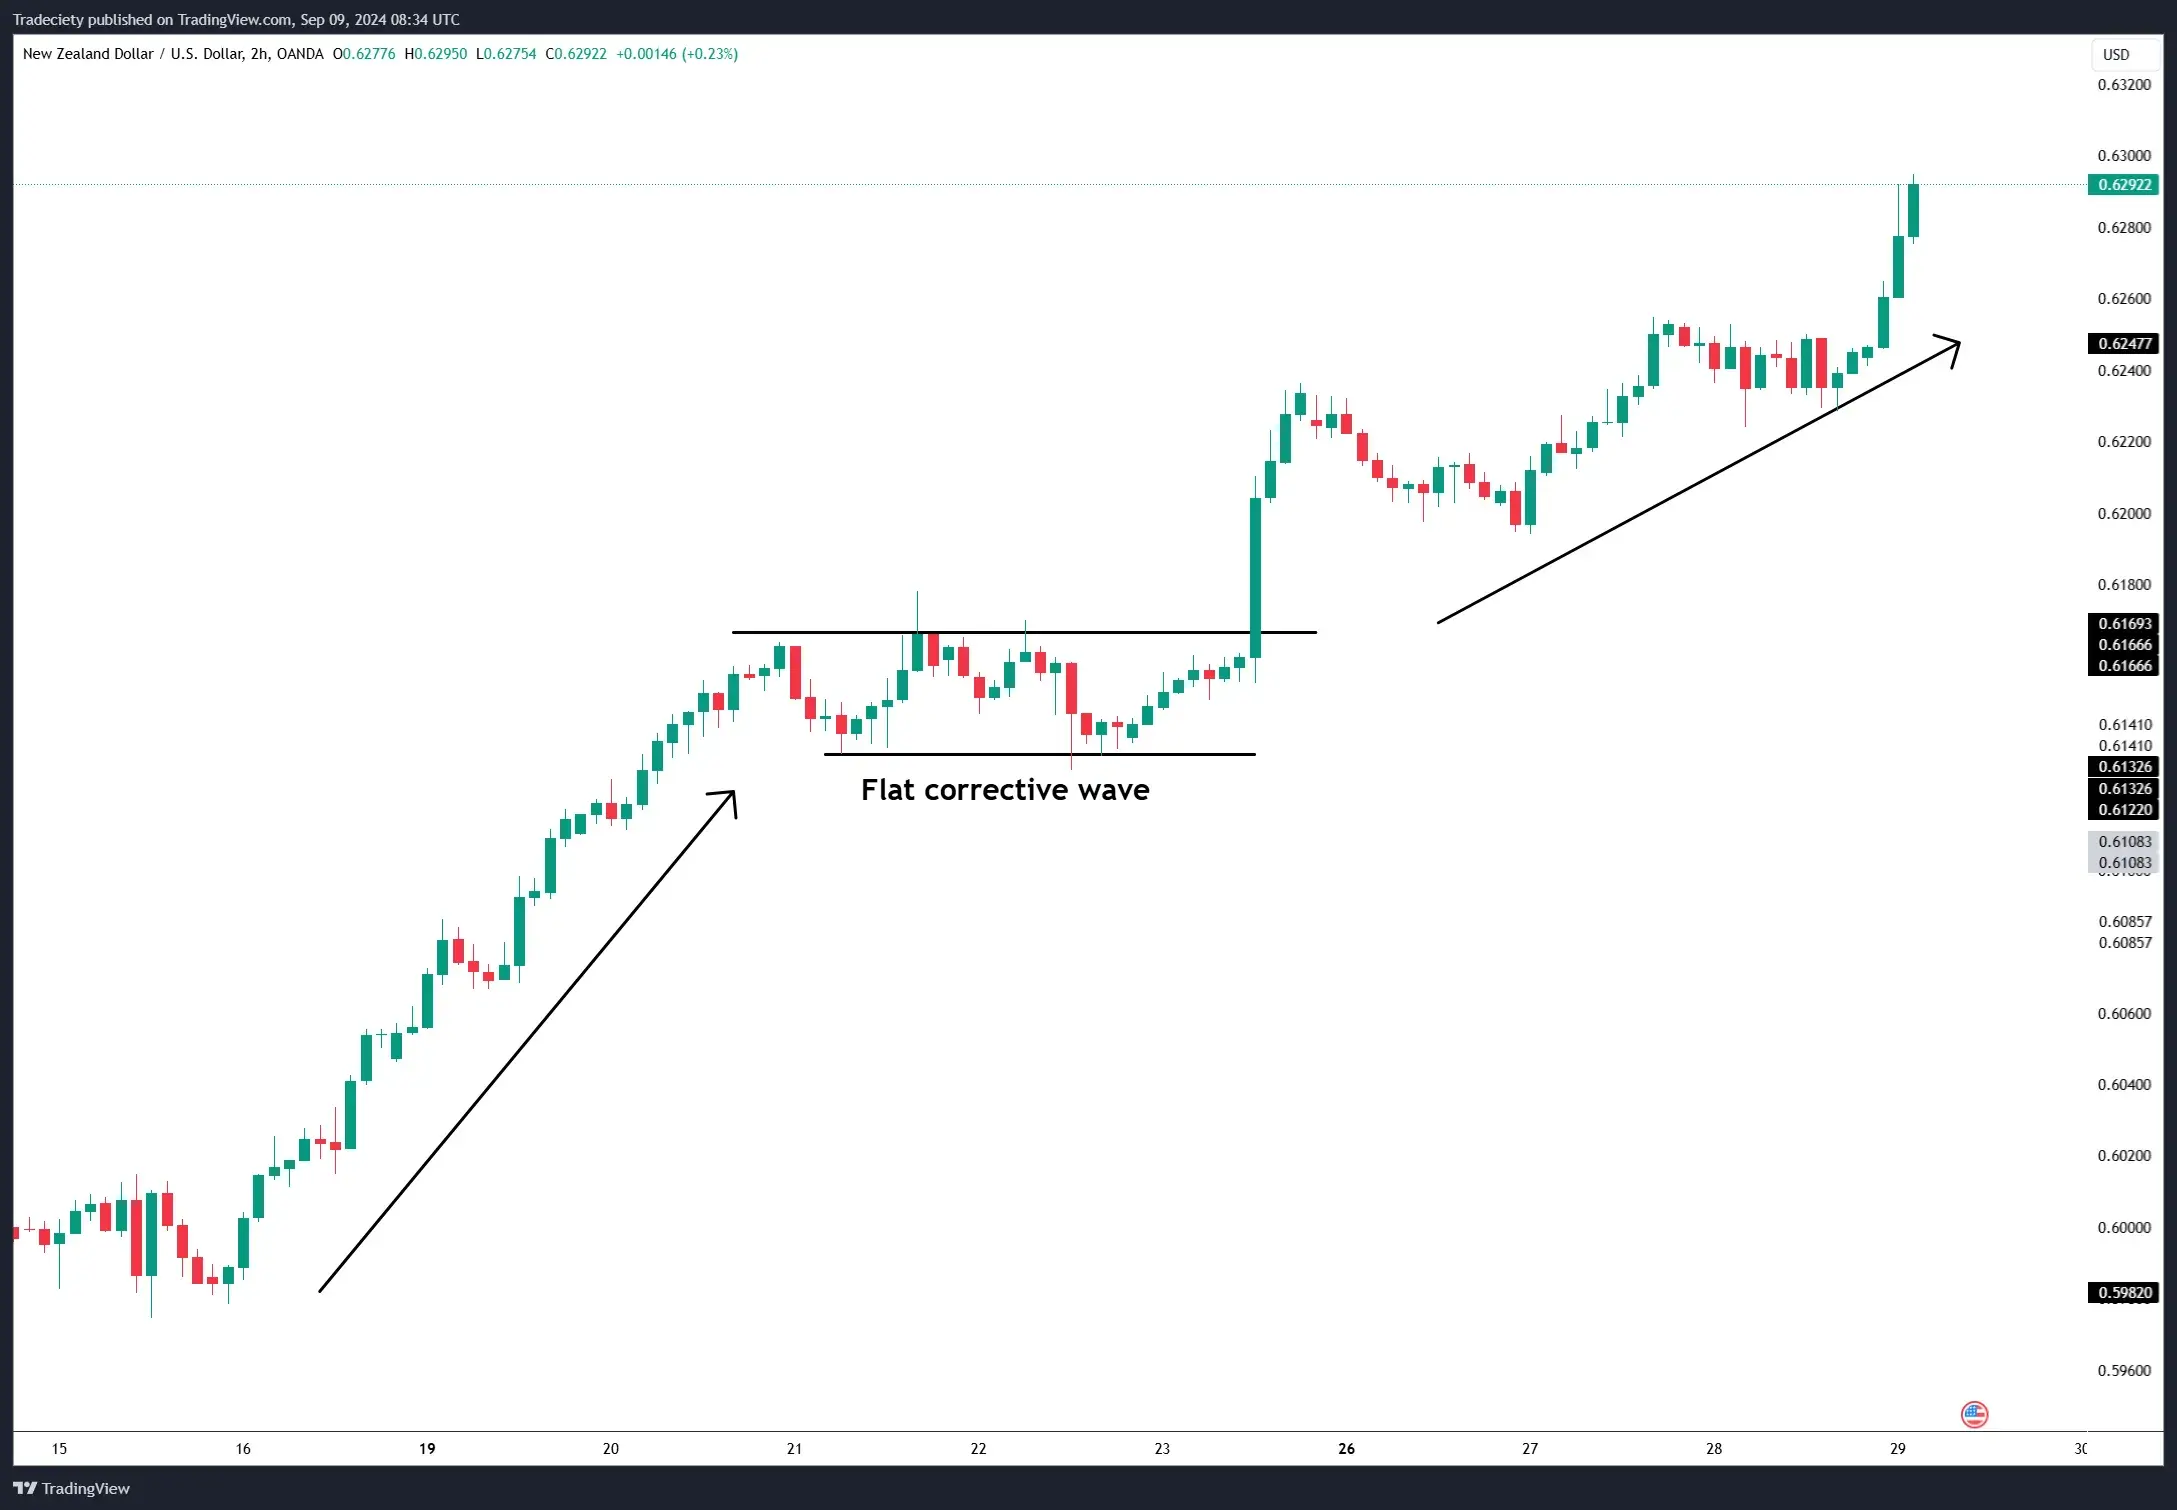
Flat: A sideways correction where the market stays relatively flat and does not move higher a lot.
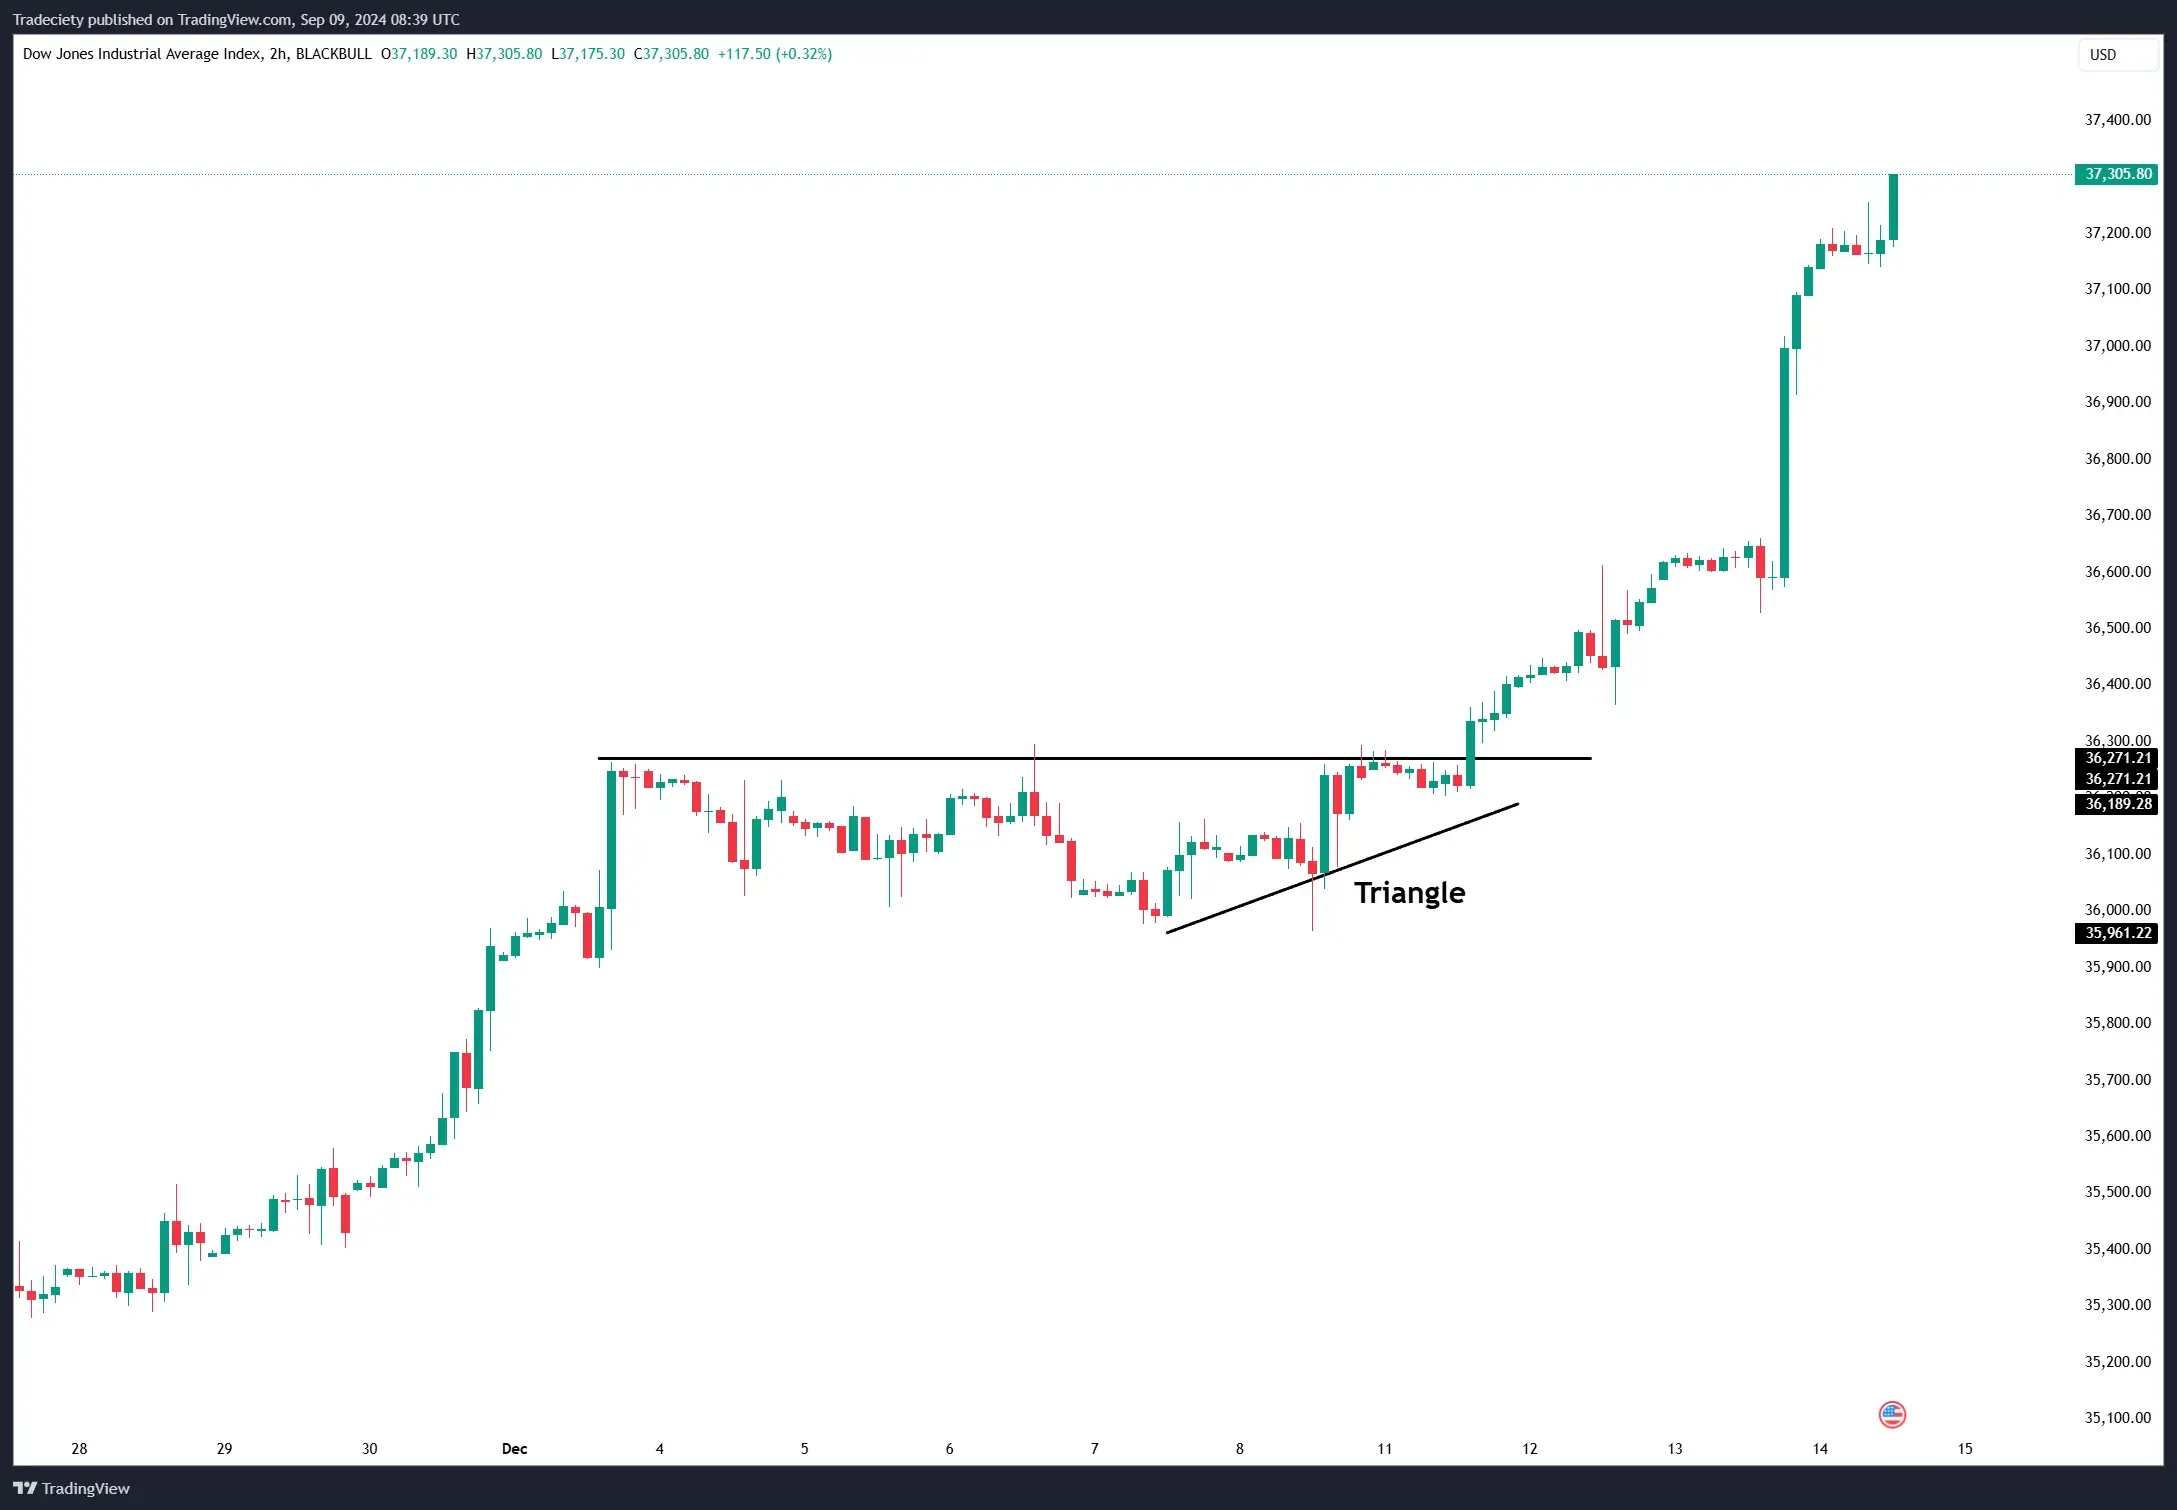
Triangle: A triangle chart pattern is a consolidation pattern where price movement becomes narrower.
Recognizing these corrective patterns enables traders to spot potential reversals and plan for trend changes, which can help in timing exits or repositioning in the market.
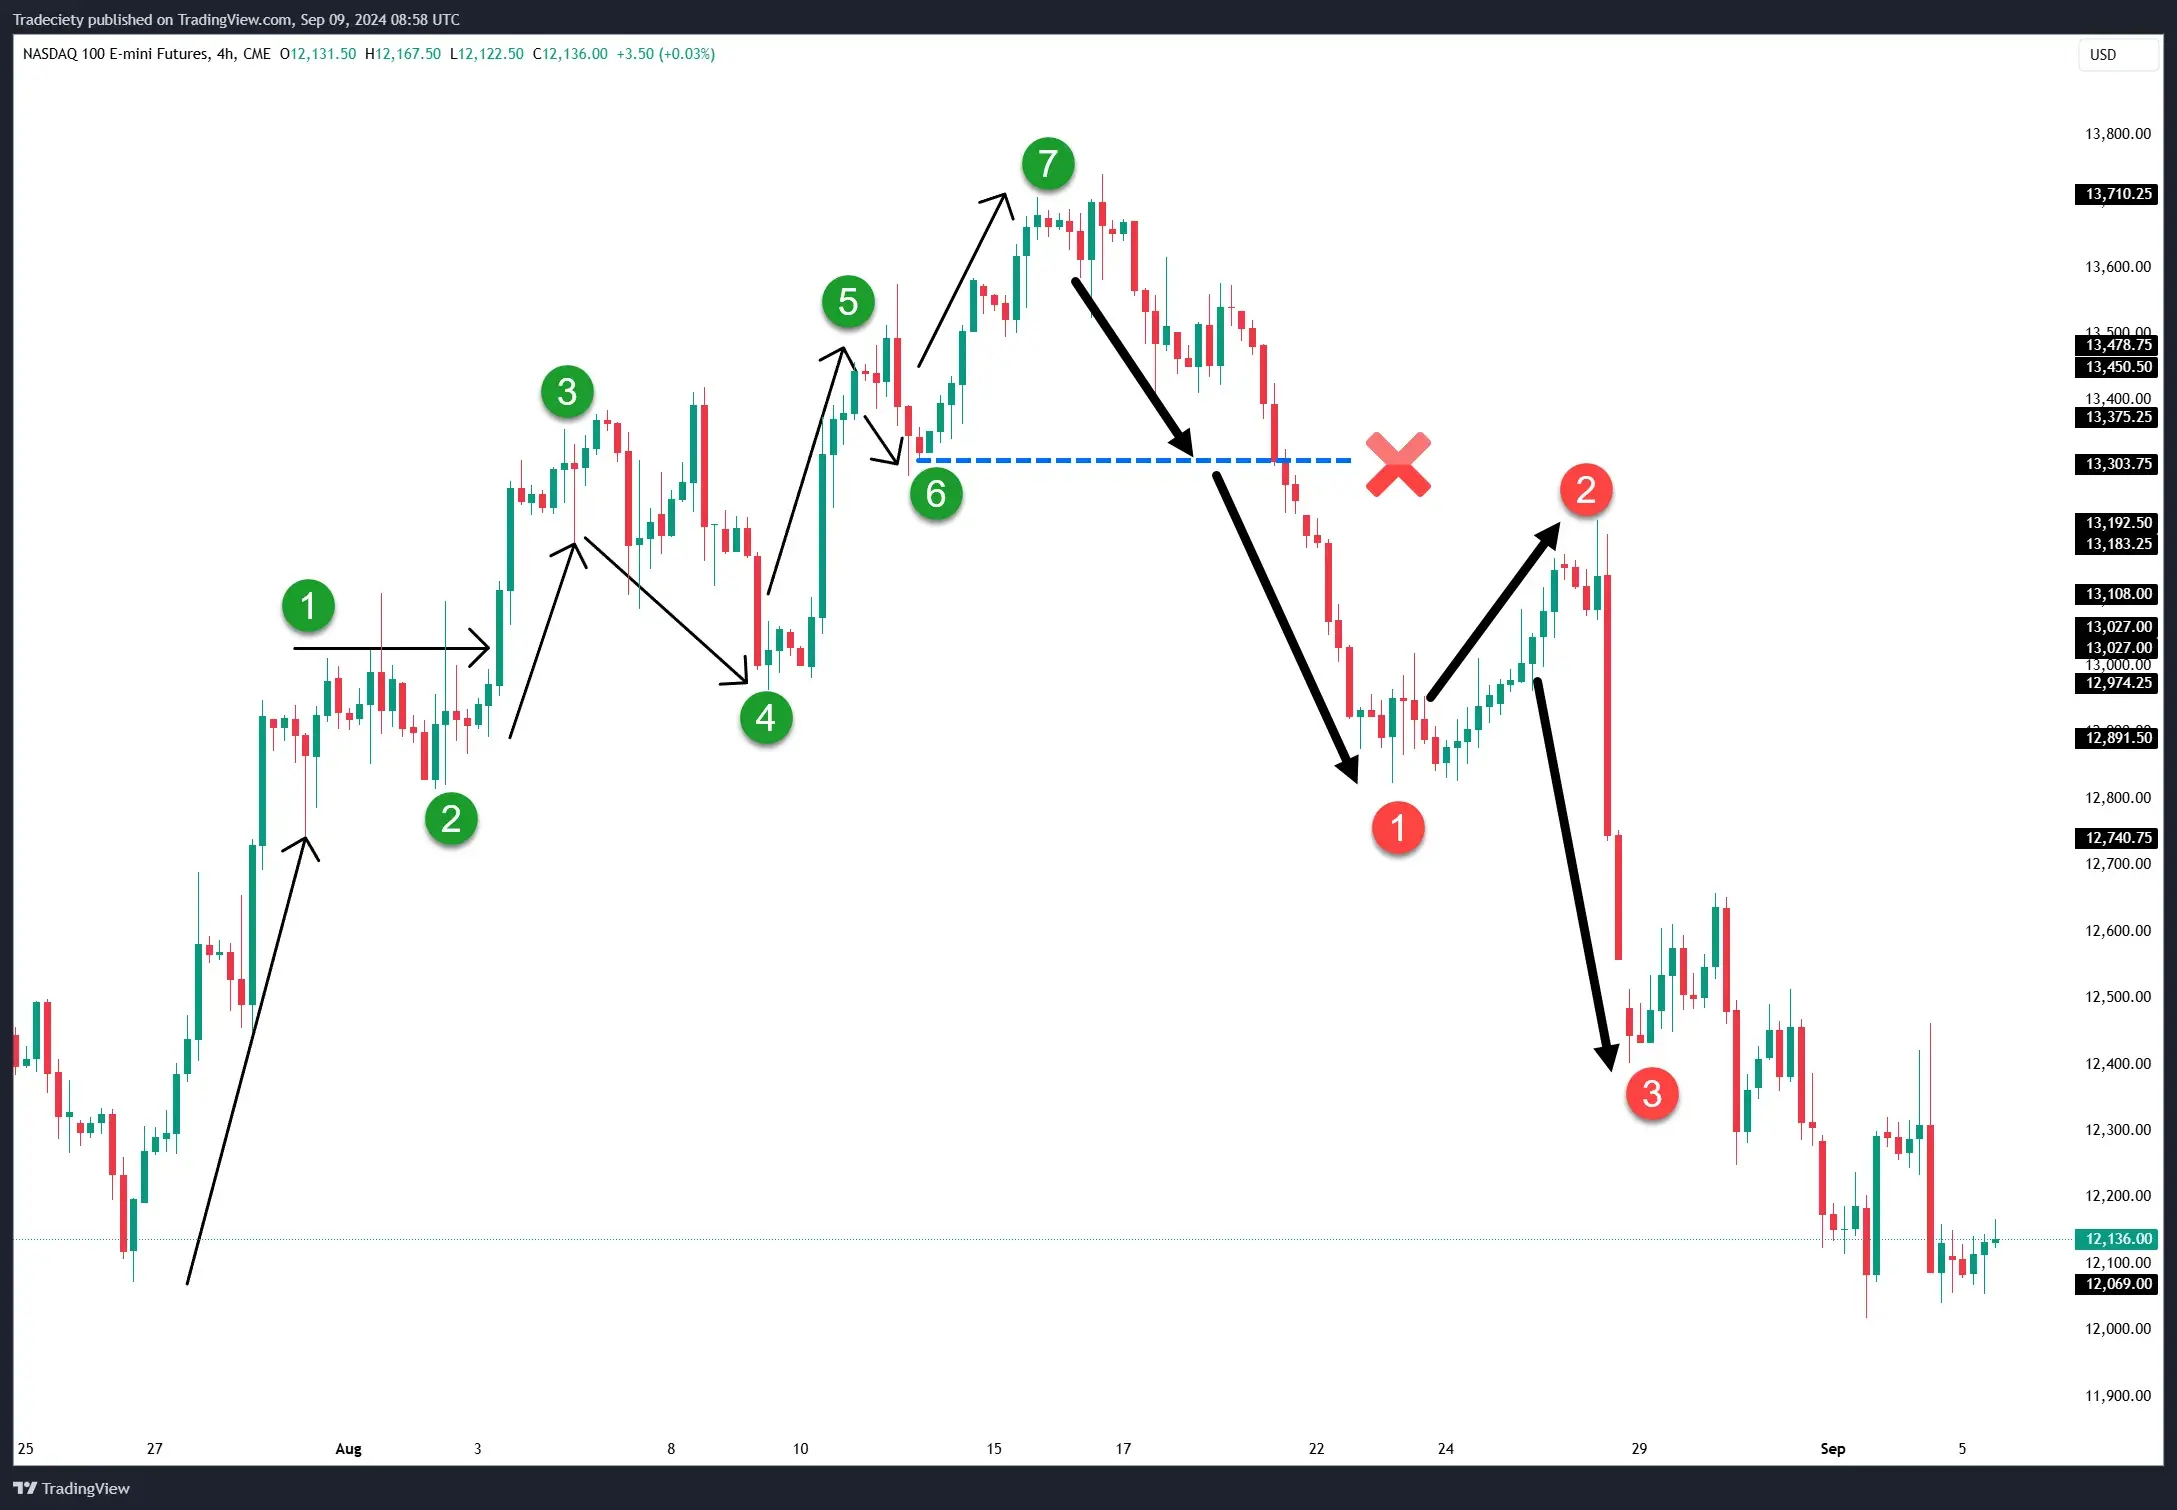
The most important corrective wave signal is present when a corrective wave goes so far that it breaks a previous lowest low point. This typically signals a complete trend reversal.
In the scenario below, after a bullish seven-wave count, the bearish wave breaks below the low of wave 6, signaling that bearish trend waves are now becoming the predominant impulsive waves and initiating a new bearish trend.
Applying Elliot Wave Theory in live trading requires practice and a keen eye for identifying patterns on price charts. Here's how you can integrate EWT into your trading strategy:
Identify Waves on Charts: Start by determining whether the market is in an impulsive or corrective phase. This is best done by identifying the ratio between waves – where do you see longer, or shorter waves.
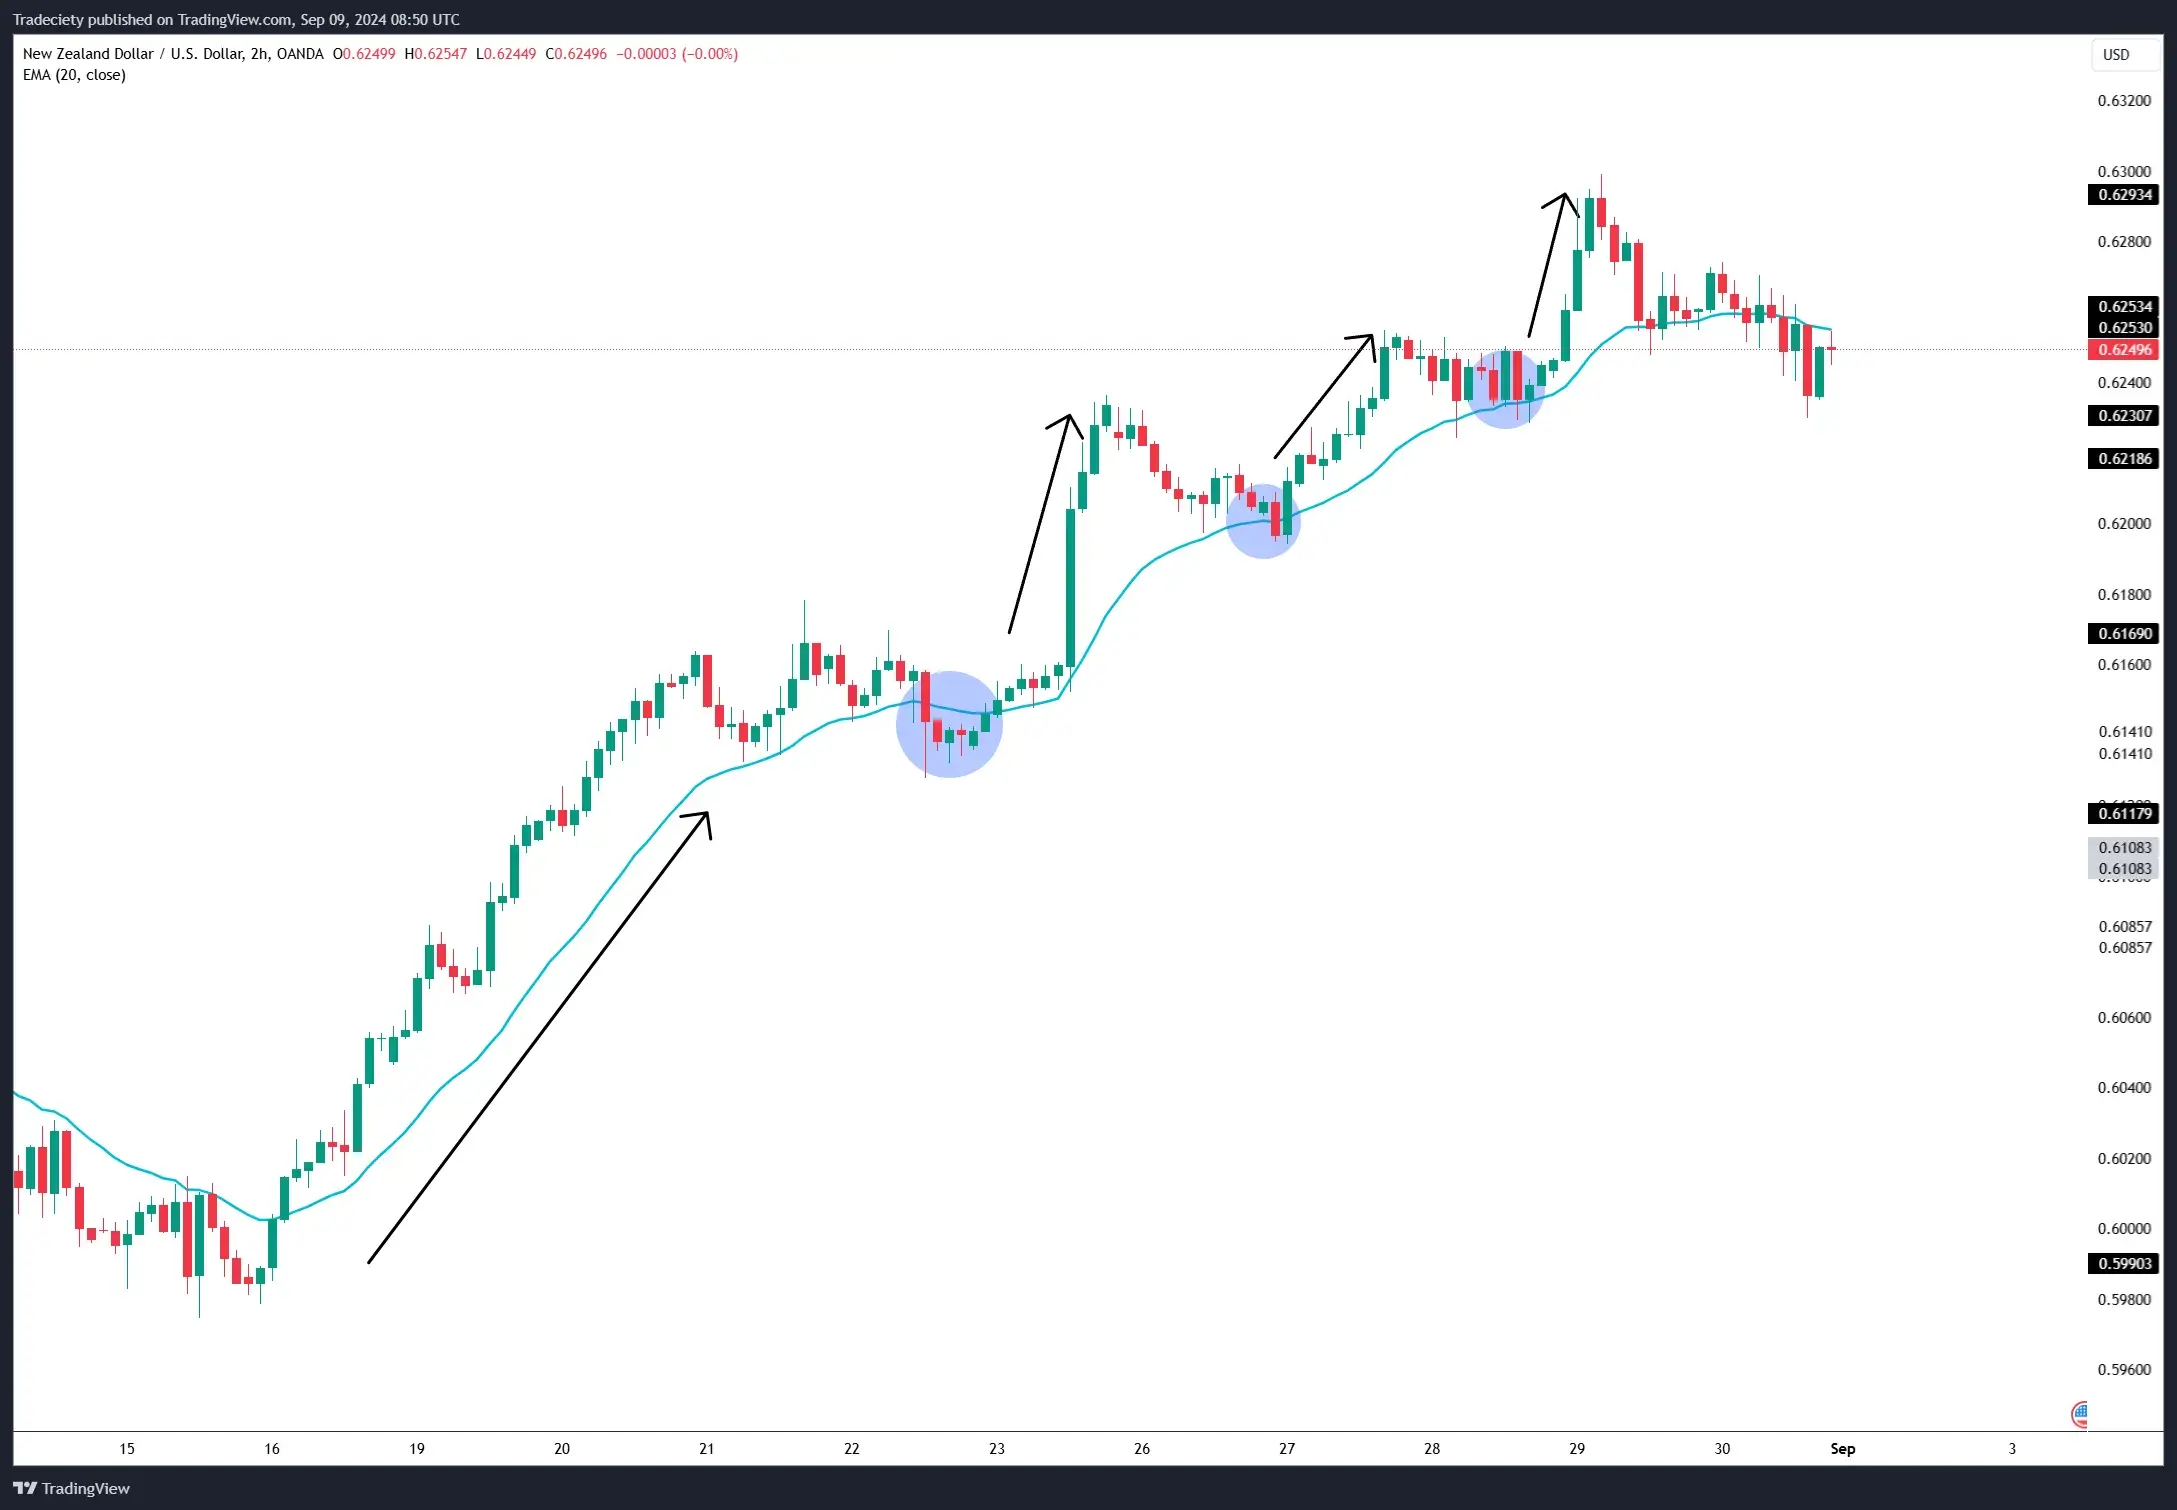
Combine with Other Indicators: While EWT can be powerful, using it alongside other tools like Fibonacci retracements, moving averages, or RSI indicators can provide confirmation for wave counts.
When using a 20-period moving average, the price will usually pull away from the moving average during an impulsive wave and pull back into the moving average during a corrective wave.
Challenges in Practice: Misidentifying waves or ignoring external market factors can lead to incorrect conclusions. Keep in mind that EWT is more of an art than a science, requiring practice and careful observation.
Stay Flexible: In practice, trends often do not follow the exact Elliot Wave count. You will be able to identify plenty of scenarios where a trend will exhibit more than 5 waves during a trending phase. Trends with 7, or even 9, waves are nothing unusual.
One of the most critical components of Elliot Wave trading is the relationship between wave patterns and Fibonacci ratios. The Fibonacci sequence plays a key role in predicting wave retracements and extensions. Common Fibonacci levels used in Elliot Wave Theory include 38.2%, 50%, 61.8%, and 100%.
Fibonacci retracement tools can help traders identify potential support and resistance levels, giving them a better idea of where corrective waves may end and impulsive waves may begin. For example:
- Wave 2/4 often retraces 50-61.8% of Wave 1.
- Wave 3/5 often extends to 161.8% of Wave 1.
By integrating Fibonacci ratios, traders can make more accurate predictions about price movements within the wave structure, enhancing their ability to enter and exit trades at optimal points.
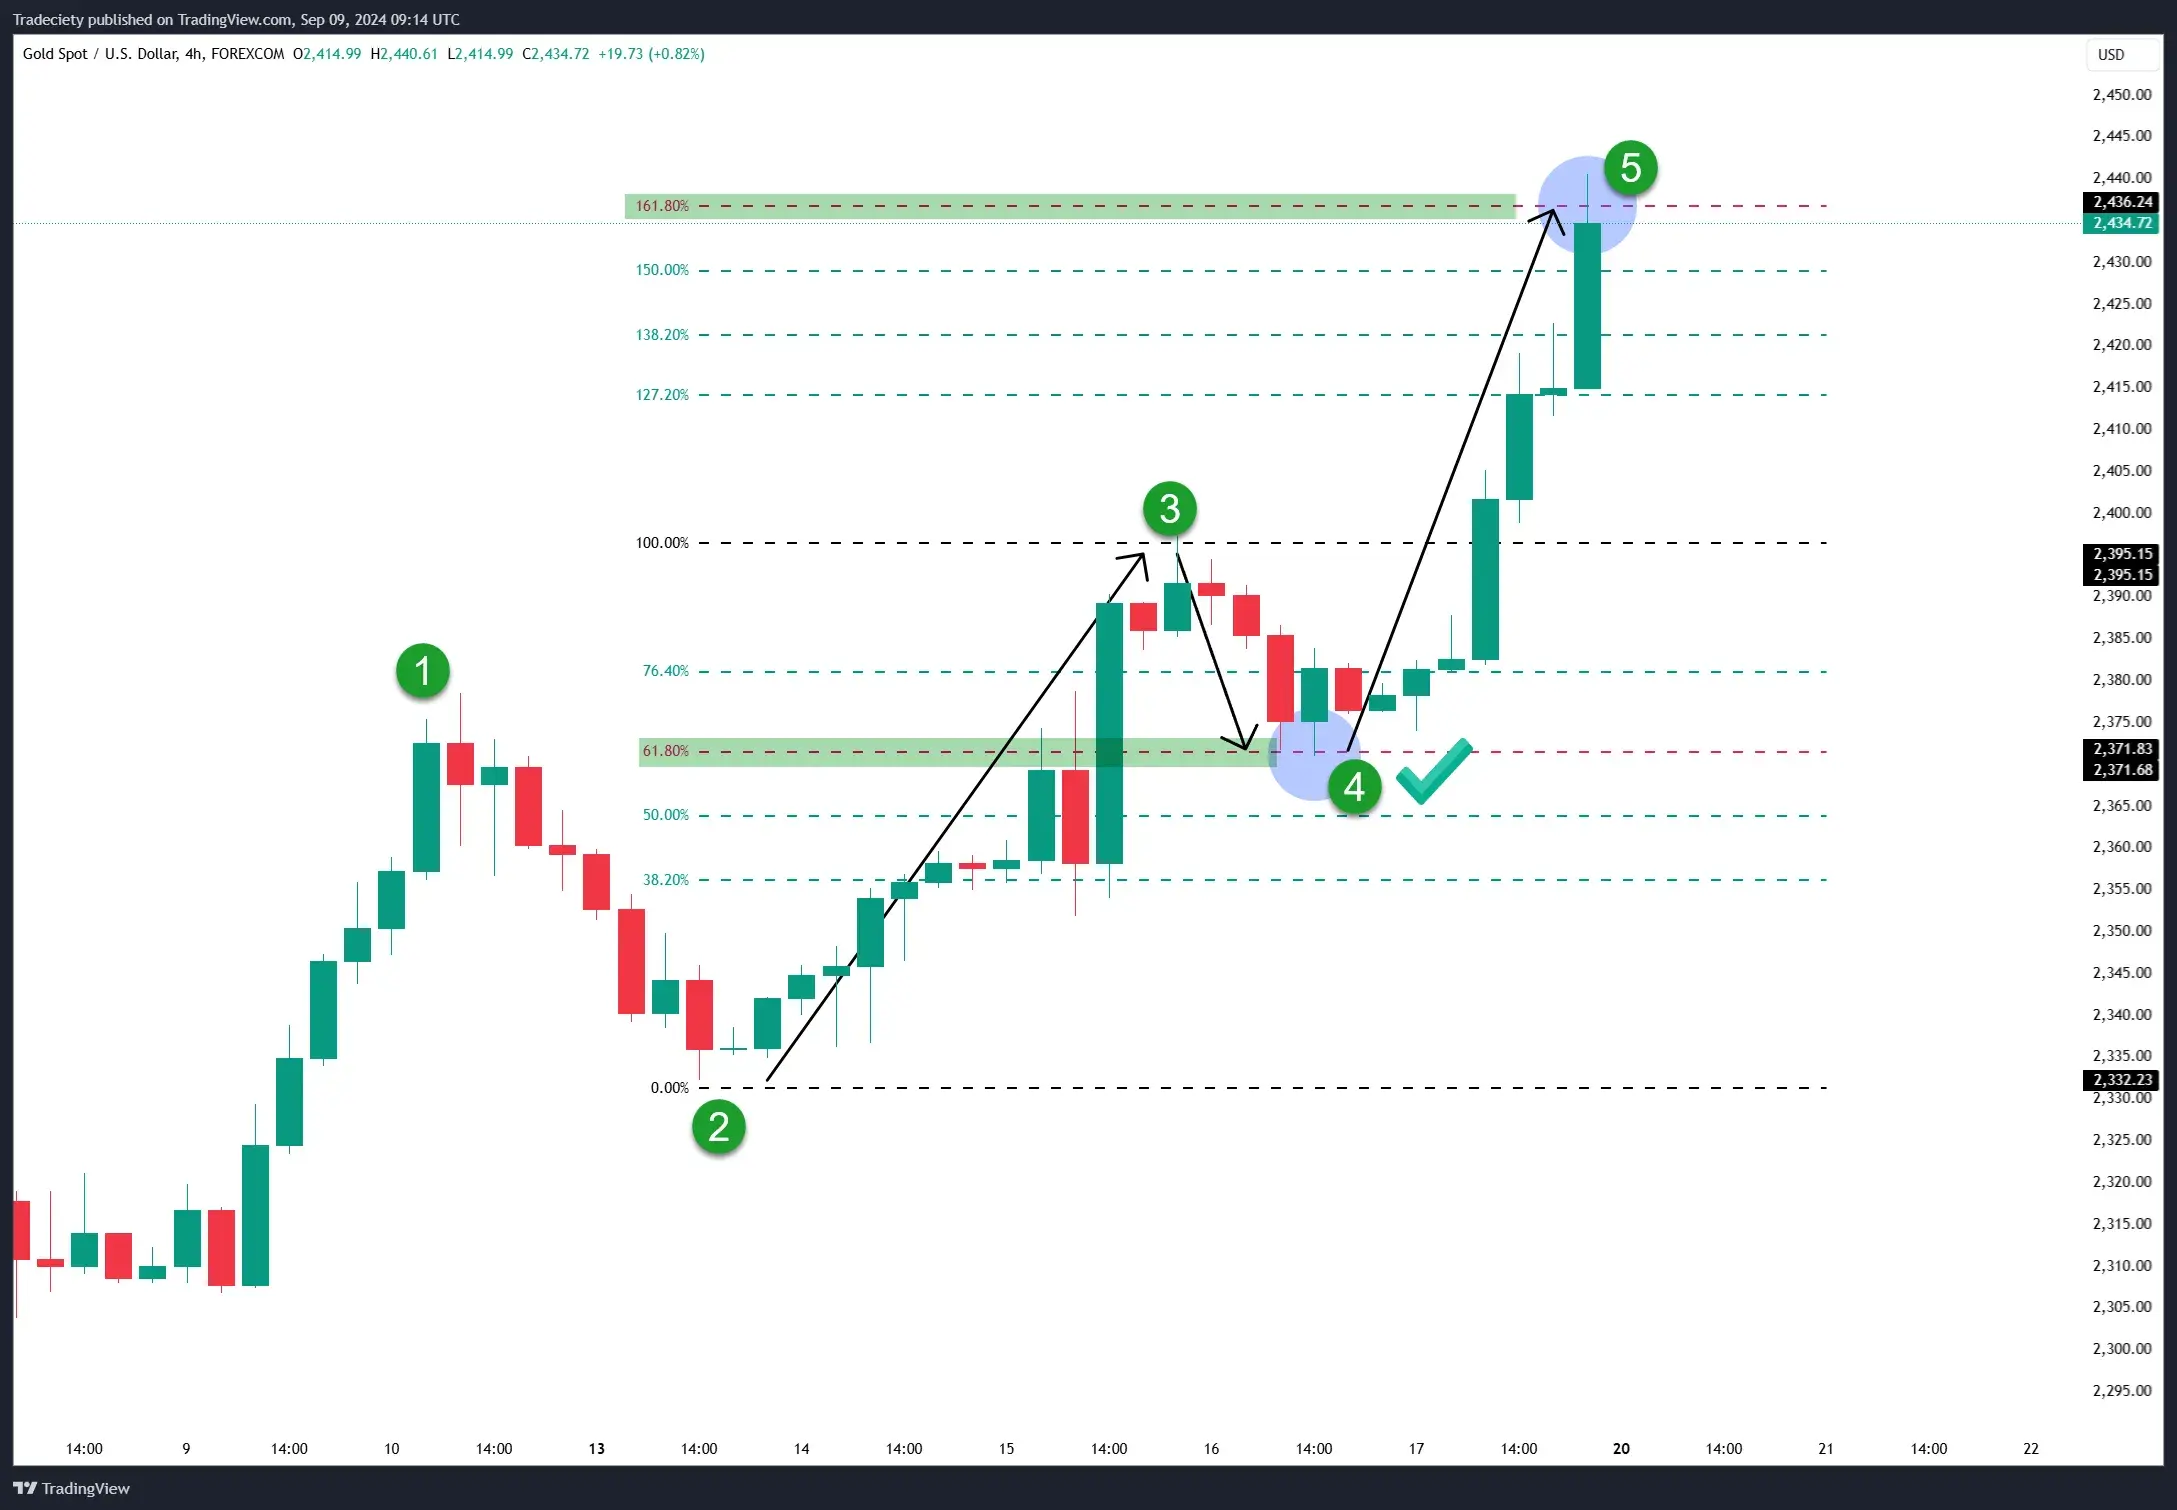
The screenshot below shows a scenario where the corrective wave 4 retraces precisely to the Fibonacci level. The following impulsive wave 5 then hits the Fibonacci extension level 161, providing a great target for trend-following traders.
Elliot Wave trading, while effective, is not without its challenges. Some common mistakes traders make include:
Misinterpreting Waves: It can be easy to confuse impulsive waves with corrective ones, especially in volatile markets.
Solution: Only count Elliot waves when you can identify a clean wave structure. If you cannot identify clear waves, choose a different analysis tool, or do not trade the market until a clear pattern can be observed again.
Overreliance on Wave Counts: While wave counting is important, relying solely on it without considering other technical indicators can lead to poor trade decisions.
Solution: Add other confluence tools to your trading strategy such as a multi-timeframe approach, a moving average, Fibonacci, or other price action concepts.
Psychological Bias: Traders often let emotions interfere with wave analysis, leading to biased interpretations that align with their expectations rather than market reality.
Solution: Zooming out by using a higher timeframe can usually help create a more objective approach where traders recognize the long-term trend structure. Also, during your analysis, create trading plans for both bearish and bullish scenarios, allowing you to stay open to all price movements.
Elliot Wave Theory is just one of many technical analysis methods available to traders. Here's how it compares to other strategies:
- Moving Averages: Useful for identifying trend direction but lacks the predictive power of EWT.
- RSI/MACD: These indicators can provide additional confirmation of trend strength and momentum but don’t give insights into the structure of market trends like EWT.
- Price Action: Some traders prefer pure price action strategies, which rely on chart patterns and ignore wave counting. EWT provides an additional layer of confluence, by understanding the current trending context.
While EWT offers a detailed roadmap of market movements, combining it with other methods, such as moving averages or momentum indicators, can enhance accuracy and help traders avoid false signals.
As you gain more experience with Elliot Wave Theory, you’ll encounter advanced wave patterns such as extensions, truncations, and complex corrective structures like double zigzags. Here are a few key concepts:
- Wave Extensions: Sometimes, waves—especially impulsive Wave 3—extend far beyond their usual range, creating a longer wave structure.
- Wave Truncations: In rare cases, Wave 5 does not surpass Wave 3, indicating a weak final push.
- Complex Corrective Waves: Double or triple zigzags occur when the market undergoes multiple corrective phases.
Recognizing these advanced patterns requires practice and a deep understanding of market behavior. However, once mastered, these techniques can significantly improve your trading success.
Mastering Elliot Wave Theory trading takes time and practice, but the rewards can be substantial. Understanding the 5-3 wave structure, applying Fibonacci ratios, and identifying corrective patterns are all key to improving your market predictions.
With consistent application and refinement, Elliot Wave Theory can become an essential tool in your trading arsenal, helping you navigate market trends with greater precision and confidence. By combining it with other technical indicators, price action and avoiding common mistakes, you'll be better positioned for long-term trading success.
external link:


We have been trading supply and demand strategies for over ten years, and they have stood the test of time remarkably well. Supply and demand is...

3 min read
Choosing the right trading journal is essential for traders wanting to analyze performance, refine strategies, and improve consistency. In this...

3 min read
“95% of all traders fail” is the most commonly used trading related statistic around the internet. But no research paper exists that proves this...