Supply and Demand Trading in 2026
We have been trading supply and demand strategies for over ten years, and they have stood the test of time remarkably well. Supply and demand is...

Markets spend a great amount of time ranging and going sideways. As traders, we call those periods consolidations. It pays off to know how to interpret and trade consolidations because they happen so frequently.
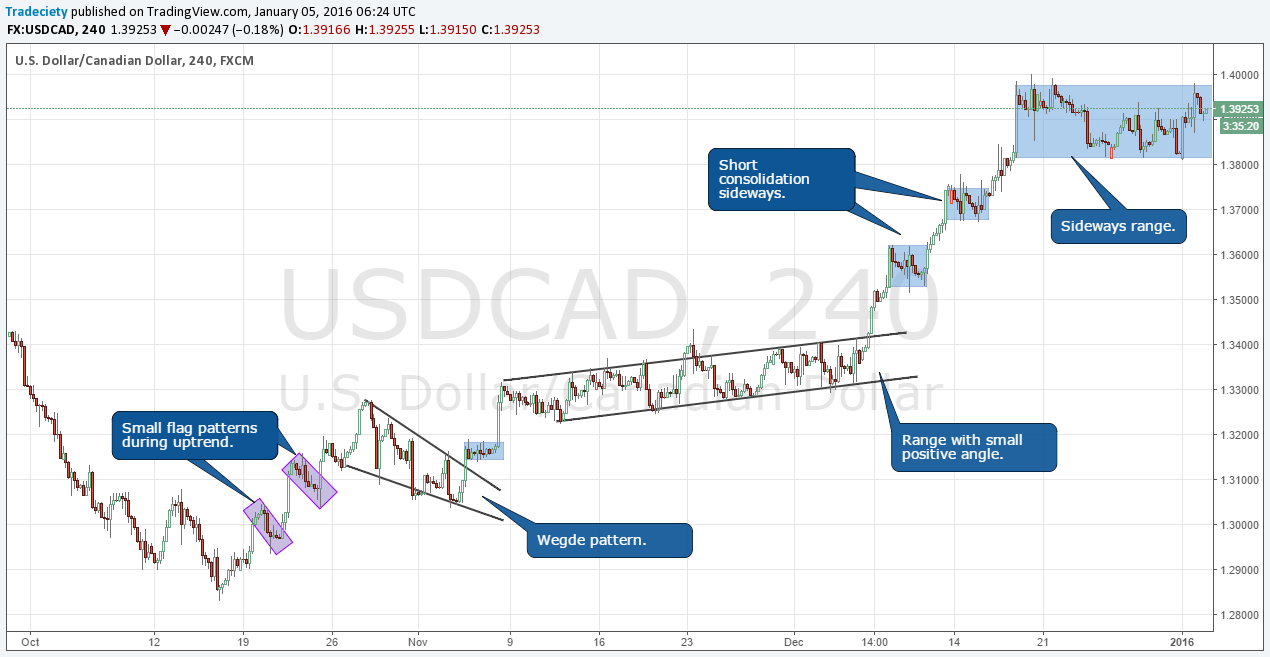
Consolidations happen either during trending market phases or before a new trend. There are different consolidation patterns as we will see later: sideways ranges, wedges, double/triple tops or triangle shaped consolidations, just to name a few.
All consolidations represent a period in which the markets pause, where indecision about the next price move exist and where traders position themselves for the next move. Consolidation periods are necessary for accumulation and distribution as well because the “big” players use those to get into their larger positions
We distinguish between three consolidation patterns: sideways ranges, downward or upward sloping ranges (also called flags), or triangular consolidations (triangles, wedges and pennants). We will take a brief look at each pattern before exploring how to trade consolidation patterns.
A range is defined by highs and lows which can be connected using horizontal lines. Price spends a lot of time ranging and knowing how to trade consolidations can be an important skill for traders.
To shake off amateur traders, you can frequently see false breakouts and breakdowns during horizontal ranges. Below you see that the market moved sideways at the top and the price had fake breakouts to the bottom and the top as well. It is, thus, very important to wait for a confirmed breakout where the price actually closed outside of the range.
Flags are consolidation patterns that form during trends and they can be found between two trend waves. Whereas amateurs often mistake flag patterns for a reversal, the professionals wait for the successful breakout and the trend continuation.
Flag patterns are typically more reliable when the trend wave prior to the flag has been strong; it makes a trend continuation likely. Again, a trend without proper consolidations often leads to boom-and-bust behavior and then a trend becomes unsustainable.
The most important factor when analyzing triangle patterns is the sequence of highs and lows and how the trendlines of the upper and lower boundary relate to each other.
We wrote a complete guide on how to trade triangles, which explains all the nuances in depth.
When it comes to trading consolidations, there are three concepts traders need to be aware of which make trading more profitable and less risky. The hardest part of trading consolidations is to avoid getting caught in false breakouts. The following three concepts help you identify high probability breakouts during consolidations.
The clues given by volume analysis are typically subtle but they can tell you a lot about what is happening in that consolidation and what is likely to happen next. During a range, the volume is usually low and flat. But when price moves towards one end of the consolidation and volume picks up, it can foreshadow a potential breakout.
The screenshot below shows that each time price broke out, or was about to break up, volume showed an uptick. At the same time, whenever we saw a fake or failed breakout, volume was either low or declining.
A consolidation is often referred to as a pot where the pressure slowly builds up while somebody is holding down the lit. The longer a consolidation period and the narrower the boundaries of the consolidation, the stronger the subsequent breakout.
However, the longer the range, the more traders will start paying attention to it and; long ranges will often have more false breakouts as the professionals try to shake off the amateurs. During long ranges, waiting for a confirmed breakout and not entering prematurely – predicting a breakout – is the key to successful trading.
Whereas volume analysis is helpful for stocks traders, the principle of retest-confirmation is especially valuable for Forex trading. Equities often show a runaway behavior after a breakout, but currencies often come back to the origin of the consolidation and “retest” the consolidation boundaries.
The USD/JPY chart below shows a lot of large consolidation areas and each time price broke out of such an area, it came back to retest the upper or lower boundary of that range. Thus, a trader can either choose to trade the initial breakout – and run into false breakouts frequently – or wait for the retest while fighting the urge to trade and chase the initial breakout. There is no “better” or “worse” – it comes down to the personal preferences of the trader and which style feels more natural to him.
Further reading: Trading supply and demand zones
Consolidations happen frequently and they are a natural and necessary market structure during long periods of trends or before the existence of a new trend. Volume analysis, the length and width of the consolidation, shaking off amateur traders before breakouts, or failed breakout are all clues which help the attentive trader to connect the dots and enable him to make sophisticated decisions about the sentiment within that range.

We have been trading supply and demand strategies for over ten years, and they have stood the test of time remarkably well. Supply and demand is...

3 min read
Choosing the right trading journal is essential for traders wanting to analyze performance, refine strategies, and improve consistency. In this...

3 min read
“95% of all traders fail” is the most commonly used trading related statistic around the internet. But no research paper exists that proves this...