Supply and Demand Trading in 2026
We have been trading supply and demand strategies for over ten years, and they have stood the test of time remarkably well. Supply and demand is...

I have never looked too much into volume because in Forex it wasn’t of much use when I started trading. Now in Stocks that is obviously a whole different story. Here, volume is actually a very useful indicator. I apply volume to classic chart pattern breakout trades on a daily basis and it has been working very well. What we want to see is simply an irregularity in volume on the day of the breakout or one of the following days, i.e. a day which is trading with much more volume than the average.
We can define “irregularity” visually (huge bar, or by looking at a moving average applied to the volume indicator), quantitatively (compare volume to average volume), or technically by drawing trend lines on our volume histogram.
I prefer drawing trend lines or simply doing it visually by comparing the volume bar to the previous volume bars, it’s that simple really. But let’s take a look at a few chart examples. Who doesn’t love examples?
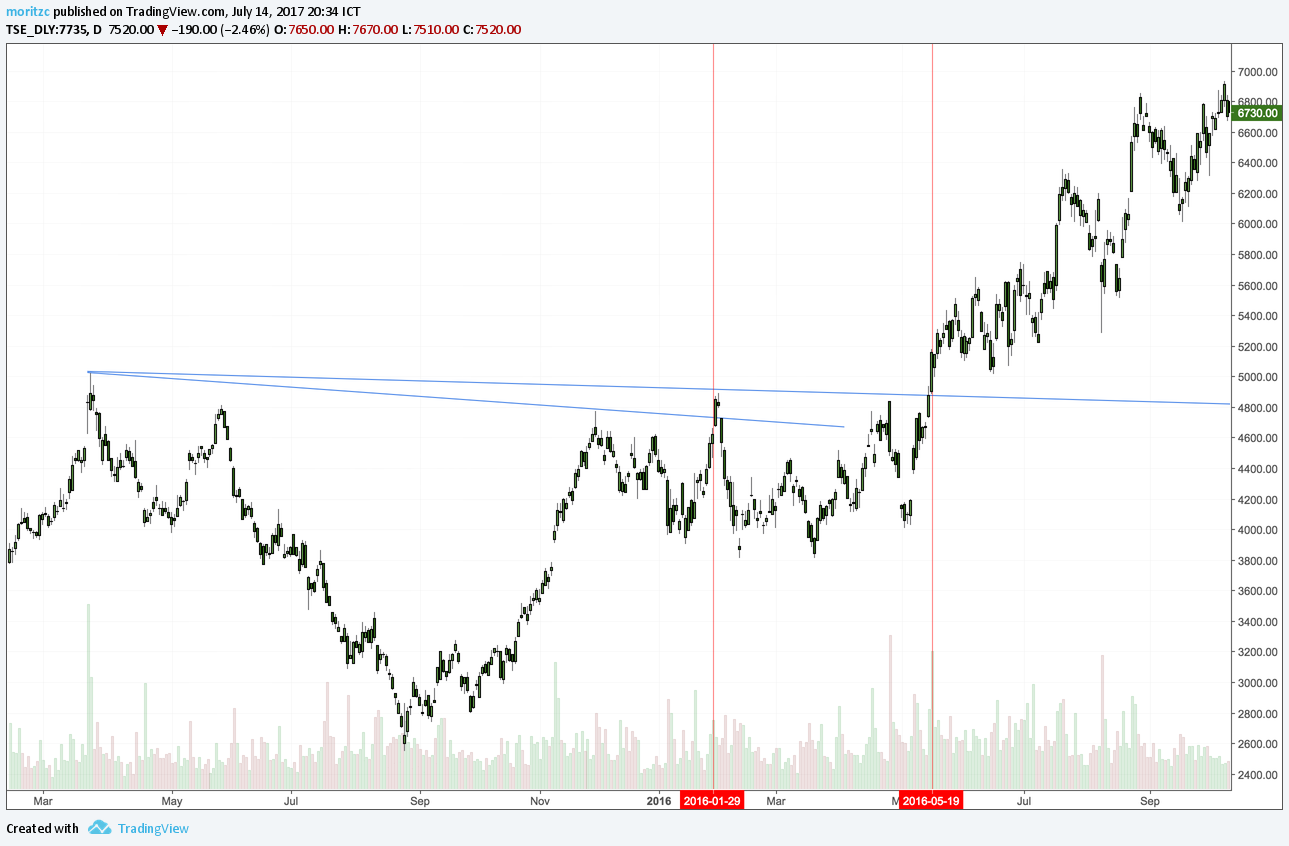
On the first vertical red line, we had an initial breakout of the Head&Shoulders continuation formation which was not confirmed by volume even though we had a strong bullish close and consequently failed. On the second vertical red line, the breakout was confirmed by a huge volume bar and a strong bullish close. The volume bar was far larger than the average and engulfed the last 15 days. We then went into a range before proceeding to the target. The trade would have resulted in a break-even result but nevertheless utilizing the volume histogram kept us out of a loss.
What we can see here is a so-called launching pattern which can act as catalysts right before breakouts of bigger structures and/or S/R. Here, price pushed into the resistance level and then retraced and started to range, creating our launching pattern. After it matured for several weeks, we broke out of it and then gapped into the resistance level with a day of strong volume. The volume was indeed so strong that it was higher than any volume of the past 45 days and we also broke the trend line I drew onto the histogram. We then started to range before exploding into our target. Our stop was never challenged.
Once more a successful breakout confirmed by a breakout on the volume histogram as well. Important here is that we not only broke out of the structure but also closed above the failed breakout bar to the left. Volume was higher than the last 45 days once more and we quickly reached the target.
A successful breakout of a symmetrical triangle that was denied by volume but nevertheless reached the target. This is trading, you will have to get used to it. Sometimes we will miss trades that are denied by volume, sometimes we will lose trades that are confirmed by volume. We are merely stacking the odds in our favor and statistically speaking volume will keep us out of a lot more bad trades than it will make us miss good trades.
Here we had a beautiful structure, a wonderful breakout bar and an incredibly strong bullish close, but immediately failed and price went back into the structure. Obviously, we would not have considered taking this trade as there was absolutely nothing indicating interest in a breakout on the volume histogram. Good job.
As anything else in trading, volume is just a tool. I have only scratched the surface here about how I utilize volume because it can also help me grade a structure when I look at how the volume profile behaved during the swings that created a classical chart pattern – especially for Head&Shoulders structures. But utilizing volume in this way will help you a lot when it comes to filtering out bad trades, especially when you are new to trading breakouts. Increased volume means increased interest and when this increased interest coincides with a breakout of an obvious structure, we stack the odds for a follow-through in our favor.

We have been trading supply and demand strategies for over ten years, and they have stood the test of time remarkably well. Supply and demand is...

3 min read
Choosing the right trading journal is essential for traders wanting to analyze performance, refine strategies, and improve consistency. In this...

3 min read
“95% of all traders fail” is the most commonly used trading related statistic around the internet. But no research paper exists that proves this...