3 min read
Scientist Discovered Why Most Traders Lose Money – 24 Surprising Statistics
“95% of all traders fail” is the most commonly used trading related statistic around the internet. But no research paper exists that proves this...

(00:00):
After my last video, there was a lot of interest in the engulfing pin bar trading strategy. So, let’s take a look at a few examples and let me explain in-depth how to use the engulfing pin bars strategy.
(00:25):
So, as I said in the last video, probably most traders know to engulfing candle, which means that you have a very large candle that completely engulfs the previous one.
Many traders will know the pin bar, which means that you’re looking at a candlestick with a very long wick.
But we can combine those two candlesticks to generate a more powerful and more robust trading approach. So, we are looking for pinbar-engulfing bars. And you can see here in this example we have a pin bar here, we have a pin bar here. But it wasn’t really until we had this engulfing pin bar that the market really took off. You can see we have the components of the pin bar with a long wick and a close into the opposite direction away from the candlestick wick. And we have the component of the engulfing bar, which means you have a very, very long candle with a strong body that completely engulfs the previous price action.
(01:25):
You have both signals and both information factors in one candlestick so you have a much, much more powerful approach. And then you can see the market afterward really took off at this nude price and this new trend was started after the engulfing pin bar.
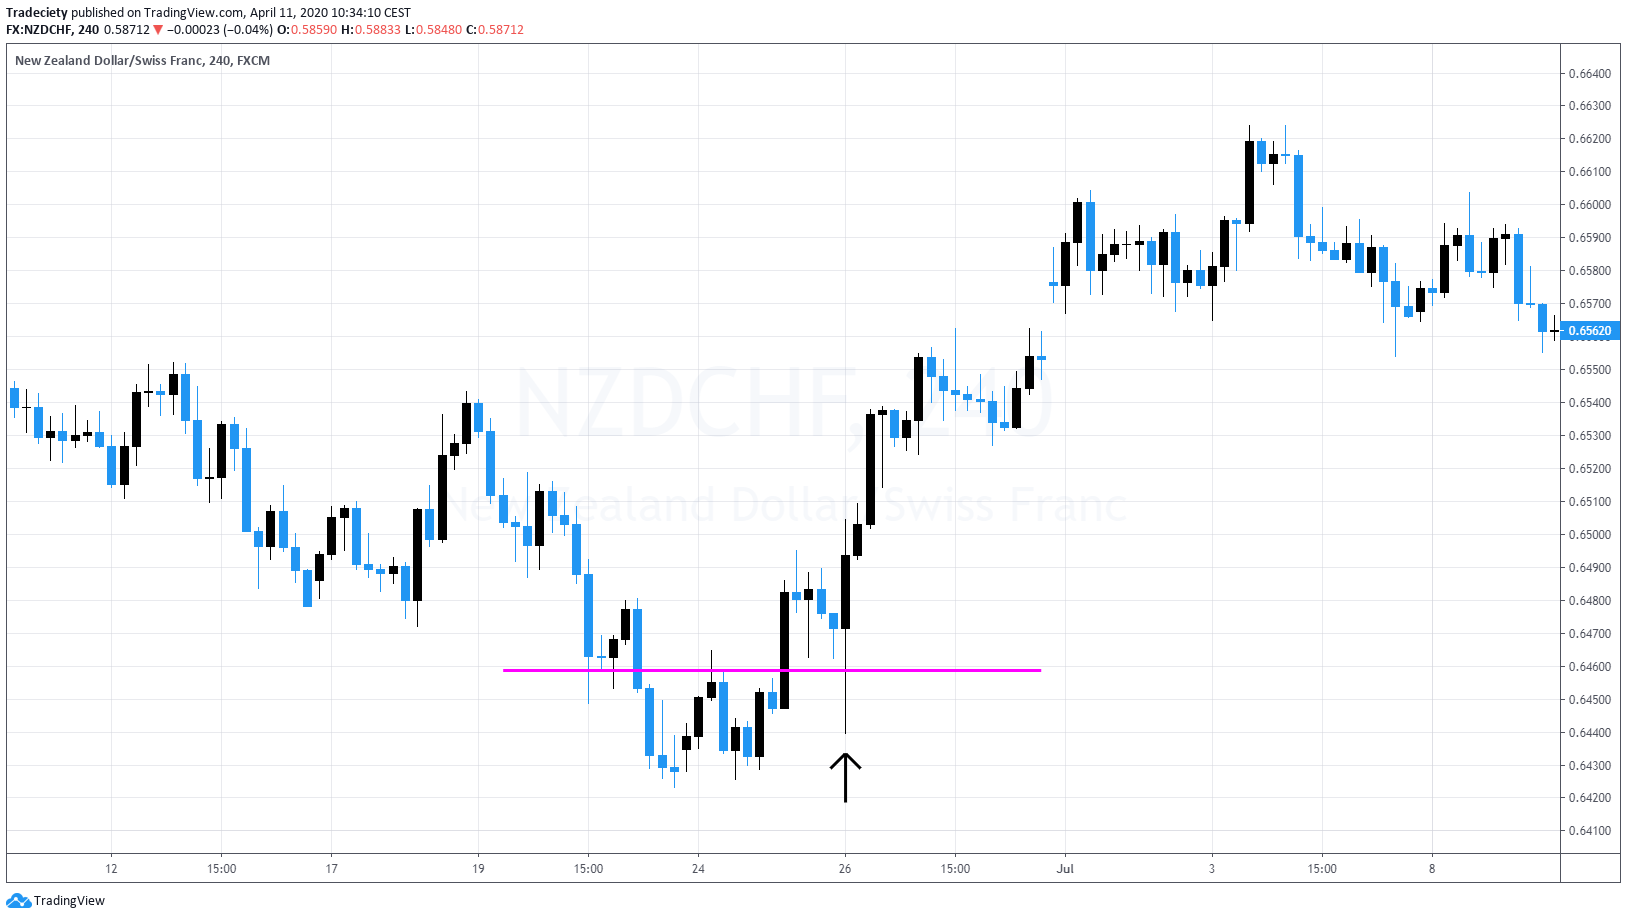
Here as well we are looking at this support and resistance flips on the market had this double bottom, it broke out and then here we had a pullback and the pullback happened with an engulfing pin bar. We have a long candlestick wick here with this candle that retest the previous support area that turned into a resistance and then back into support. And we have a very strong close closing above the previous highs completing engulfed in the past four candlesticks. A very, very strong signal that shows us we have rejected the lows here and that shows that the momentum is kicking in and the price is really shooting higher.
(02:22):
And then you can see afterward the market really rallied off of that.
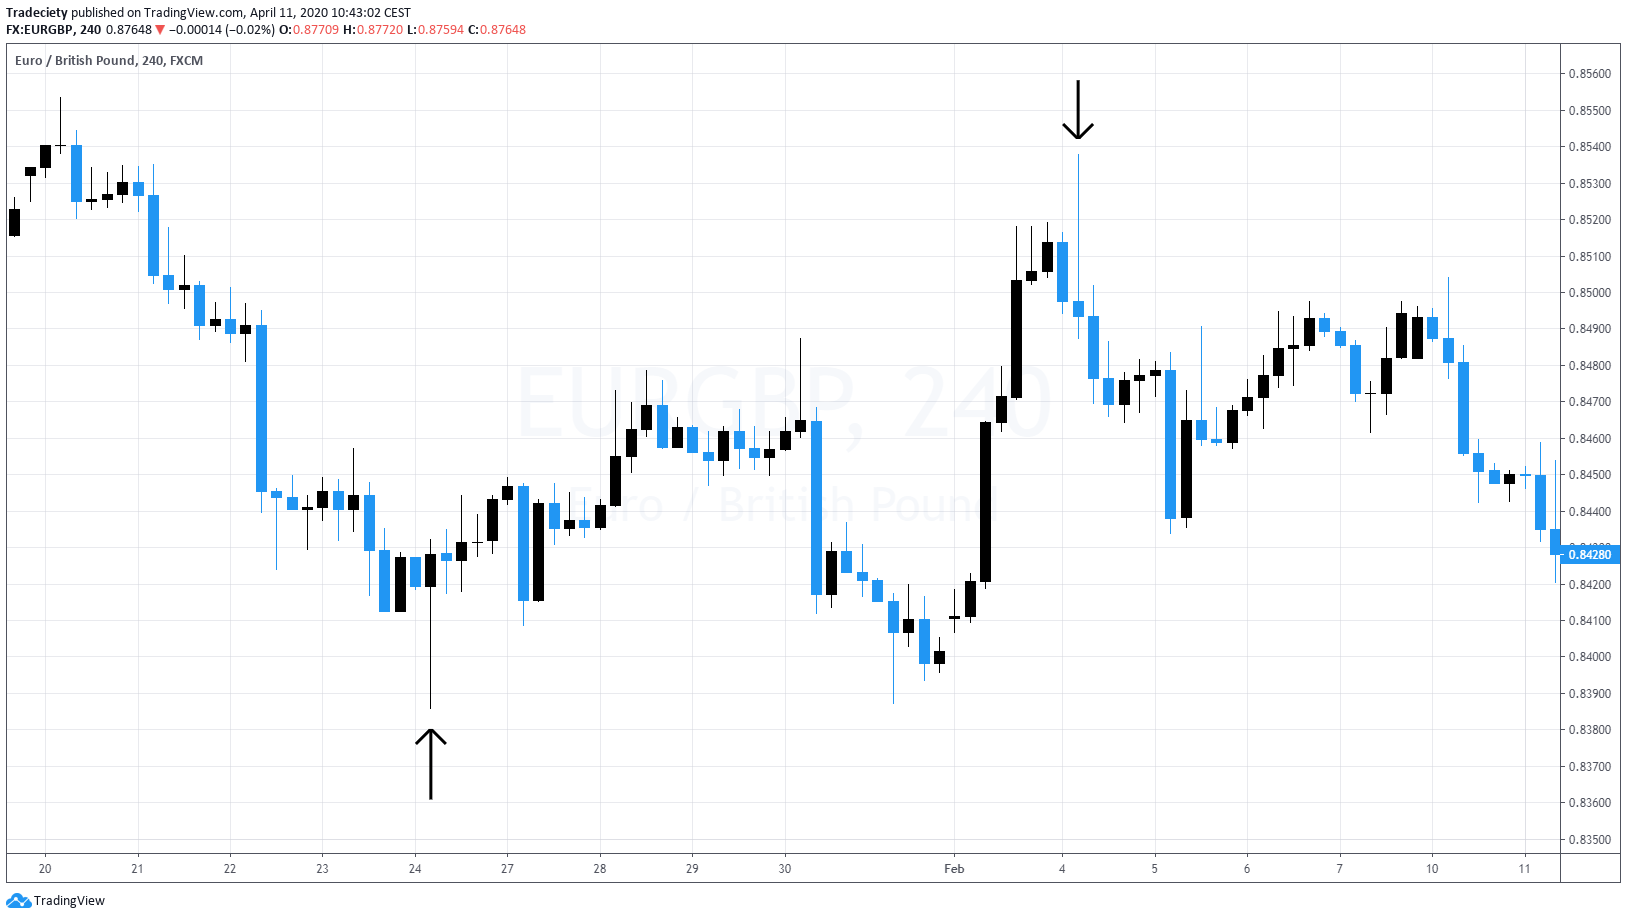
Here we have two more examples and here the signal is not as strong in both cases so we have the pin bar and we also have technically we’re looking at an engulfing candle but the body is much, much weaker than compared to the last examples where the body was really exceptionally strong and you can see in the first example eventually the market did rally a little bit but not really strong. Here as well the market did signal or did start a new downtrend but eventually, the market faded back into a sideways phase so you can see that although this may lead to a somewhat successful trade, not always obvious, but looking for really strong candles with a very, very strong body with a very strong close is and may improve the chances of finding successful trading opportunities.
(03:20):
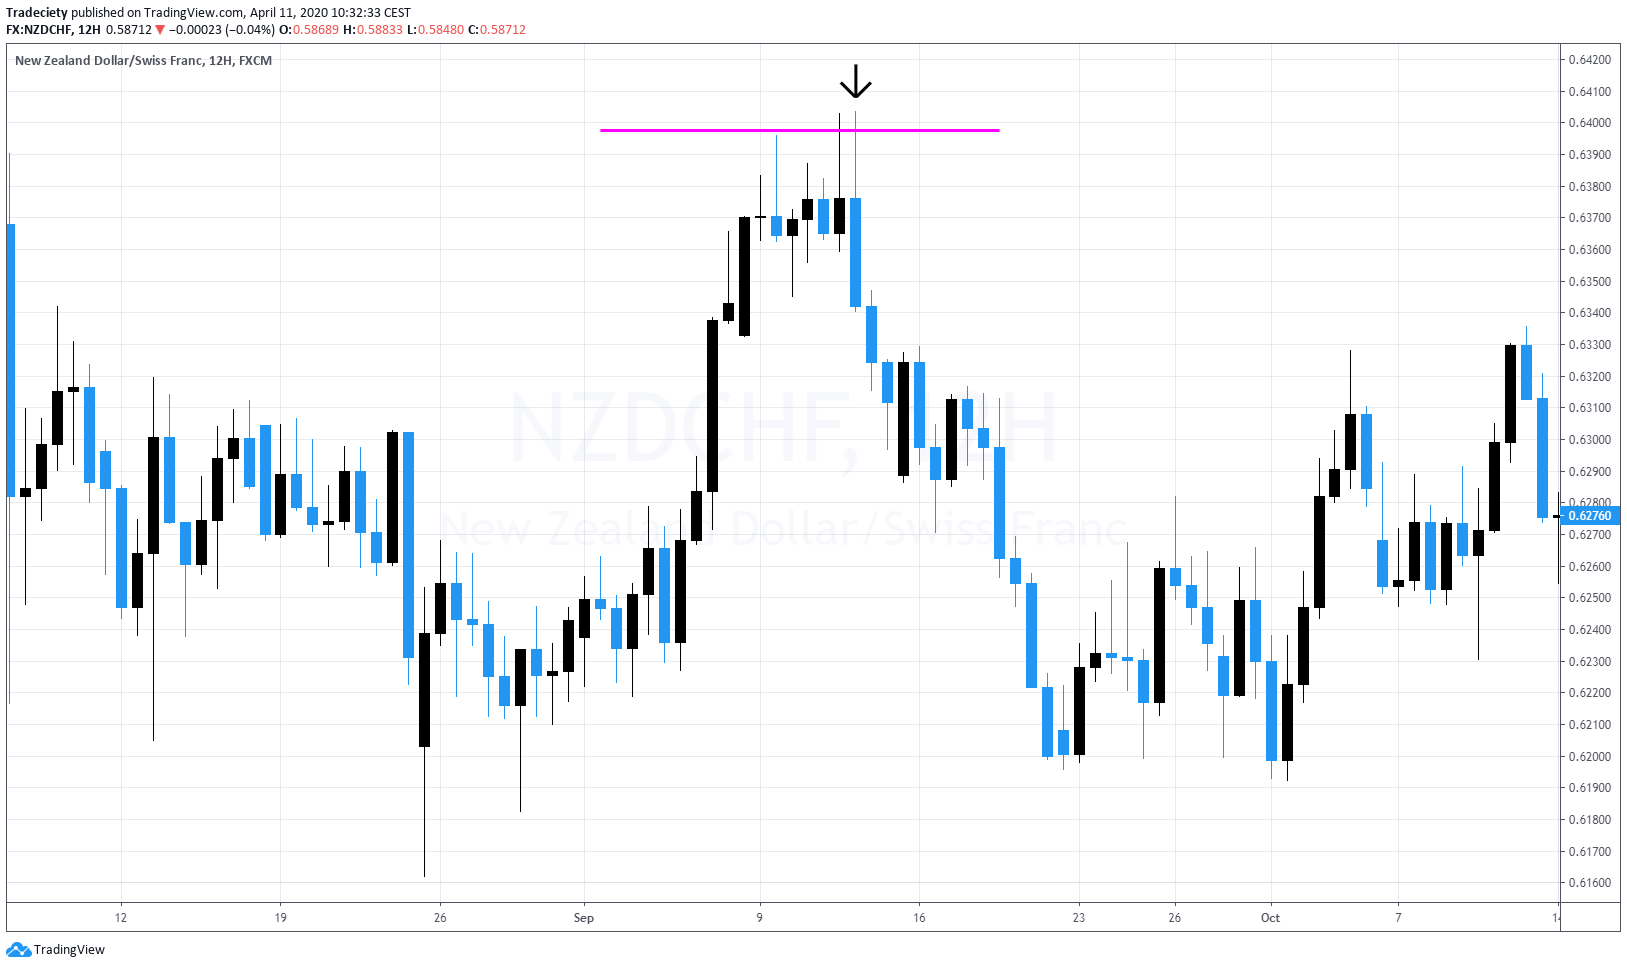
Here we are looking at very nice pin bar engulfing candles. Again, first of all you have this long wick that really takes out the previous highs in both examples. In the second example, you can see the nicer we have here, this multi candle high with a lot of wicks which already probably caught or told to some traders that the market is running out of steam. But it wasn’t until we had this final push, the final takeout, probably something like a stop squeeze and a bad trap or bull trap as well that the market and really sold off. And you can see strong close, strong body completely engulfing the last seven-eight candles and then a strong sell of afterward. Here again and it’s really interesting to see and really interesting to follow those engulfing pin bars when they happen at important key support and resistance levels.
(04:14):
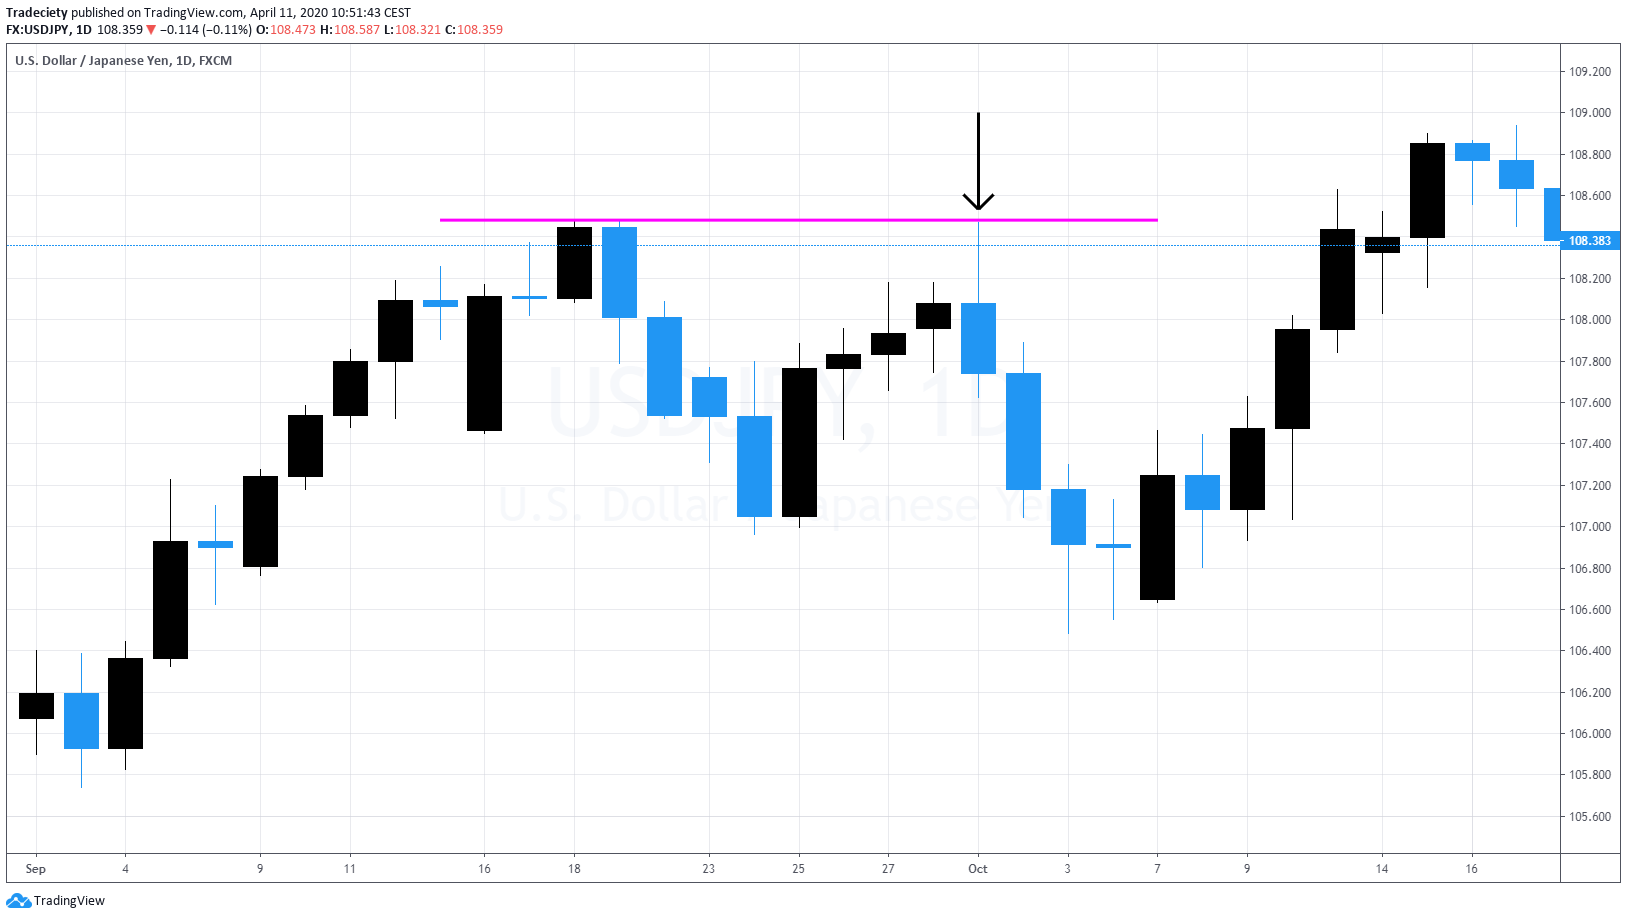
Here you can see this engulfing pin bar is taking out what is moving into the previous resistance once again. Many traders will use those highs to place their stop loss. And the engulfing pin bar often when it happens at such a level is also giving you the signal of a bad trap or boiled trap and just in general squeezed signals. You can see the market moves into the area, takes out the stops, shoots into the other side and really closes with a very weak close. And this is the daily chart and you could also use this for multi time frame approach. Once I’ve identified your engulfing pin bar on a daily chart, you go to a lower timeframe to four hours to one hour. And then you look for traits into the direction of this engulfing pin bar to establish a multi time frame approach.
(05:07):
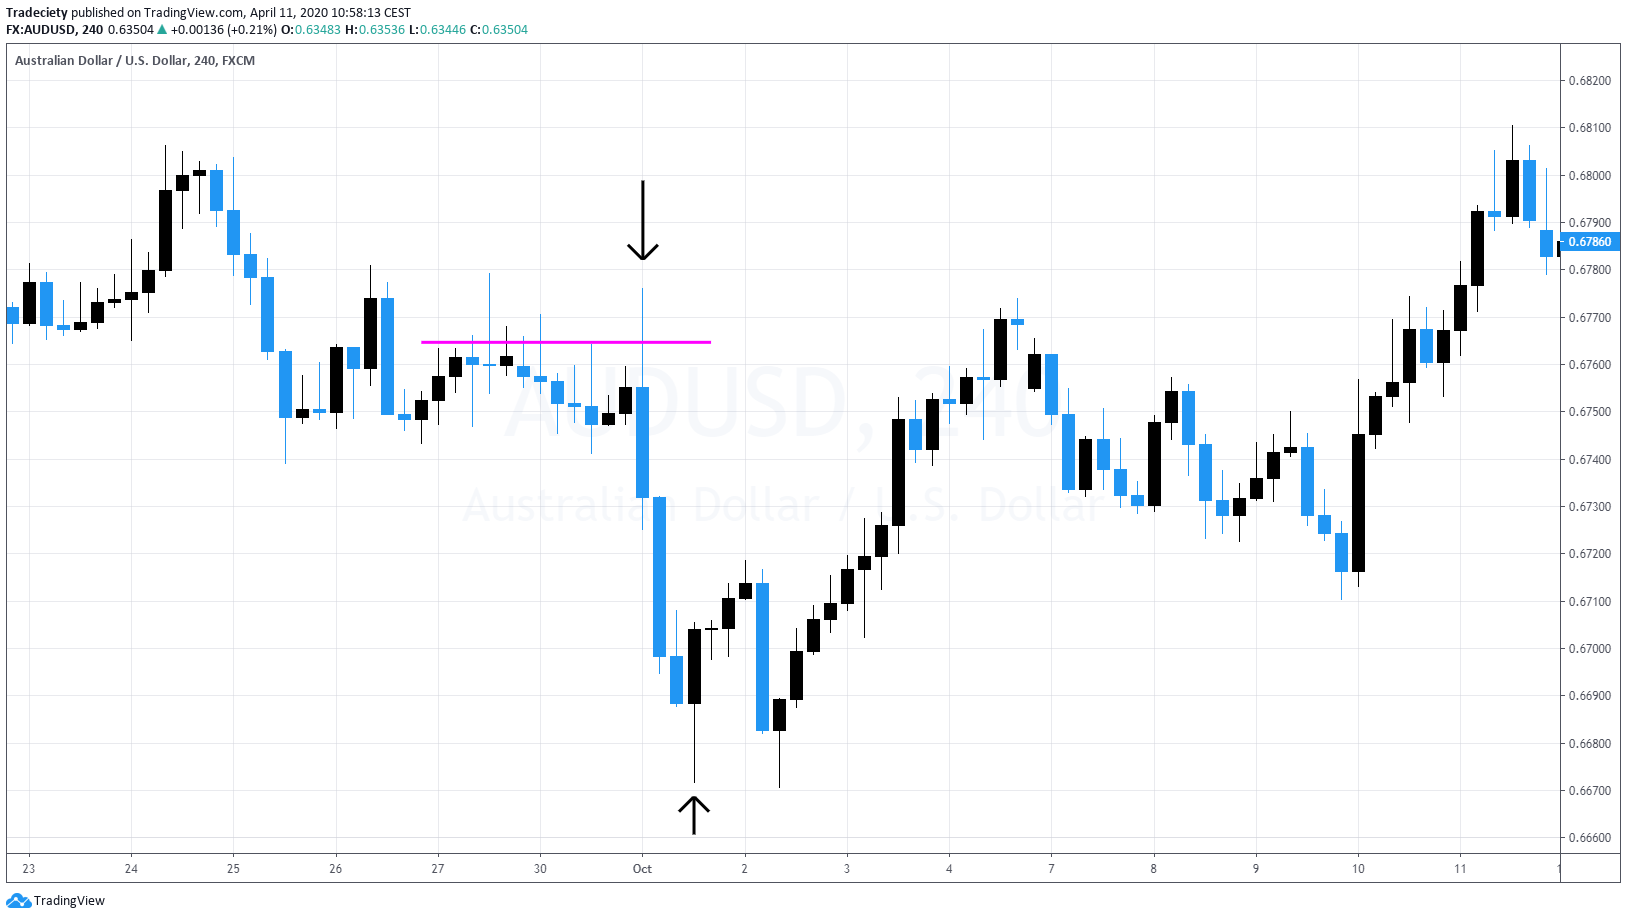
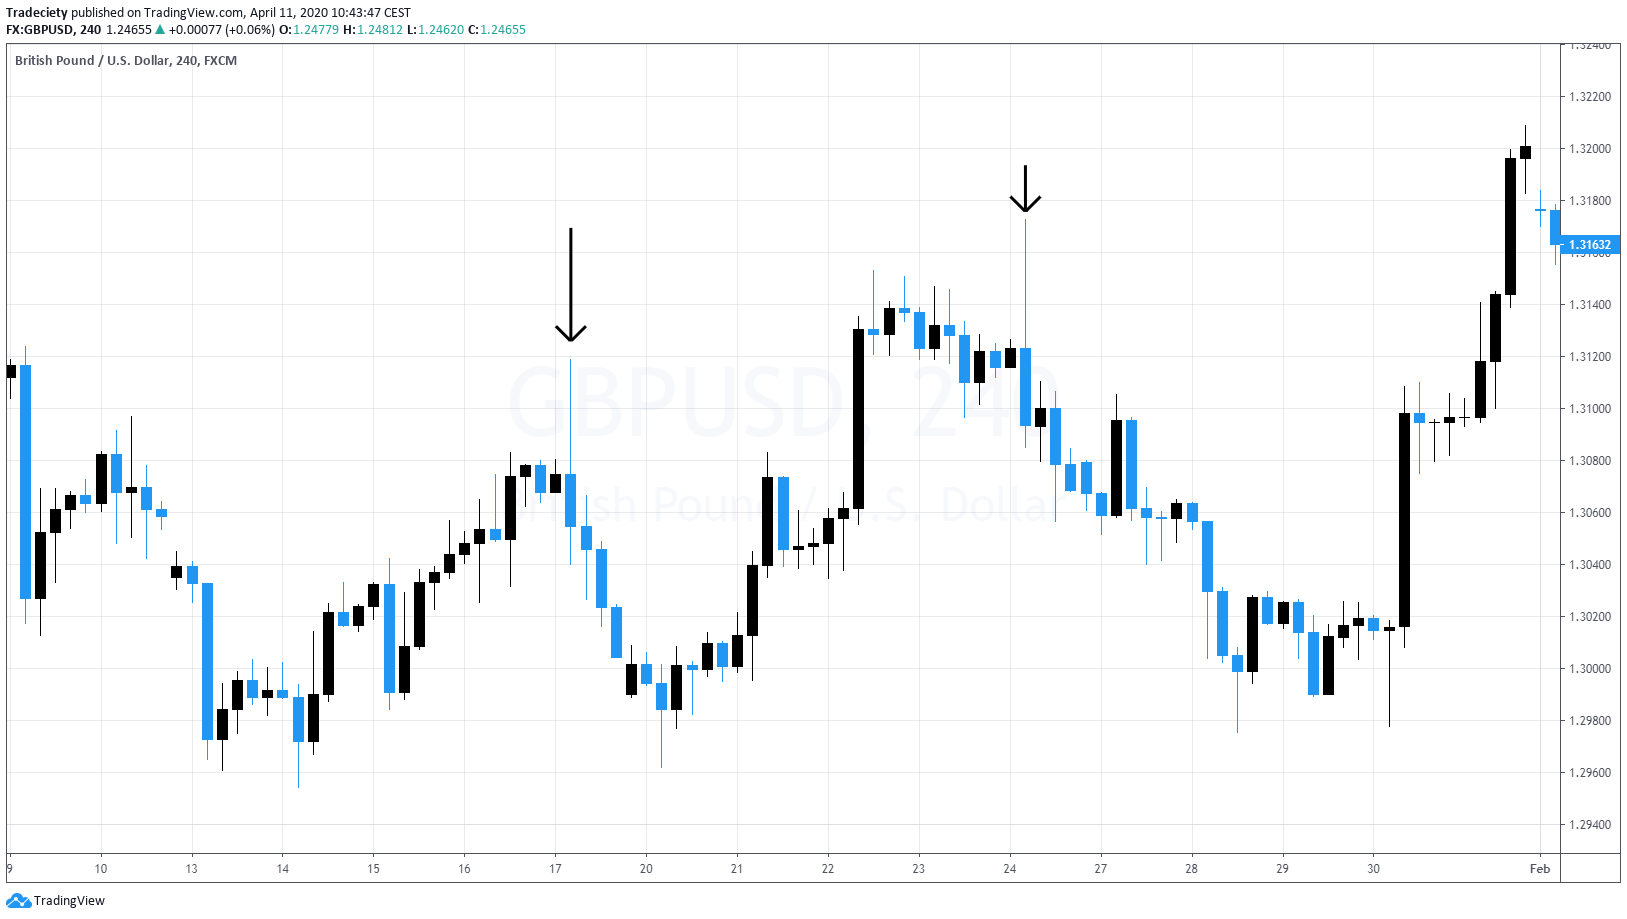
Here, another example, the market was in a sideways phase. And then here we have a significant engulfing pin bar. Very, very strong and long body and the highest taking out the previous highs as well. So the wick is really giving you here to squeeze signal. And then once this engulfing pin bar closed, the next candle was exceptionally weak. Very, very strong move away from the level. And then here again we have after this downtrend finished, we have another engulfing pin bar completely engulfs the previous bar, not really completely, although, so we have a weaker close here. It’s not completely taking out the previous highs and you can see it as example. The pin bar would have failed. So it is again really recommended to not stretch the rules, really stay within the framework of this engulfing pin bar approach. Although this is a great candlestick here, although you can see that the body is taking out a previous body, it’s not completely engulfing this candlestick here, this wouldn’t have and shouldn’t have led to a trading opportunity.
(06:11):
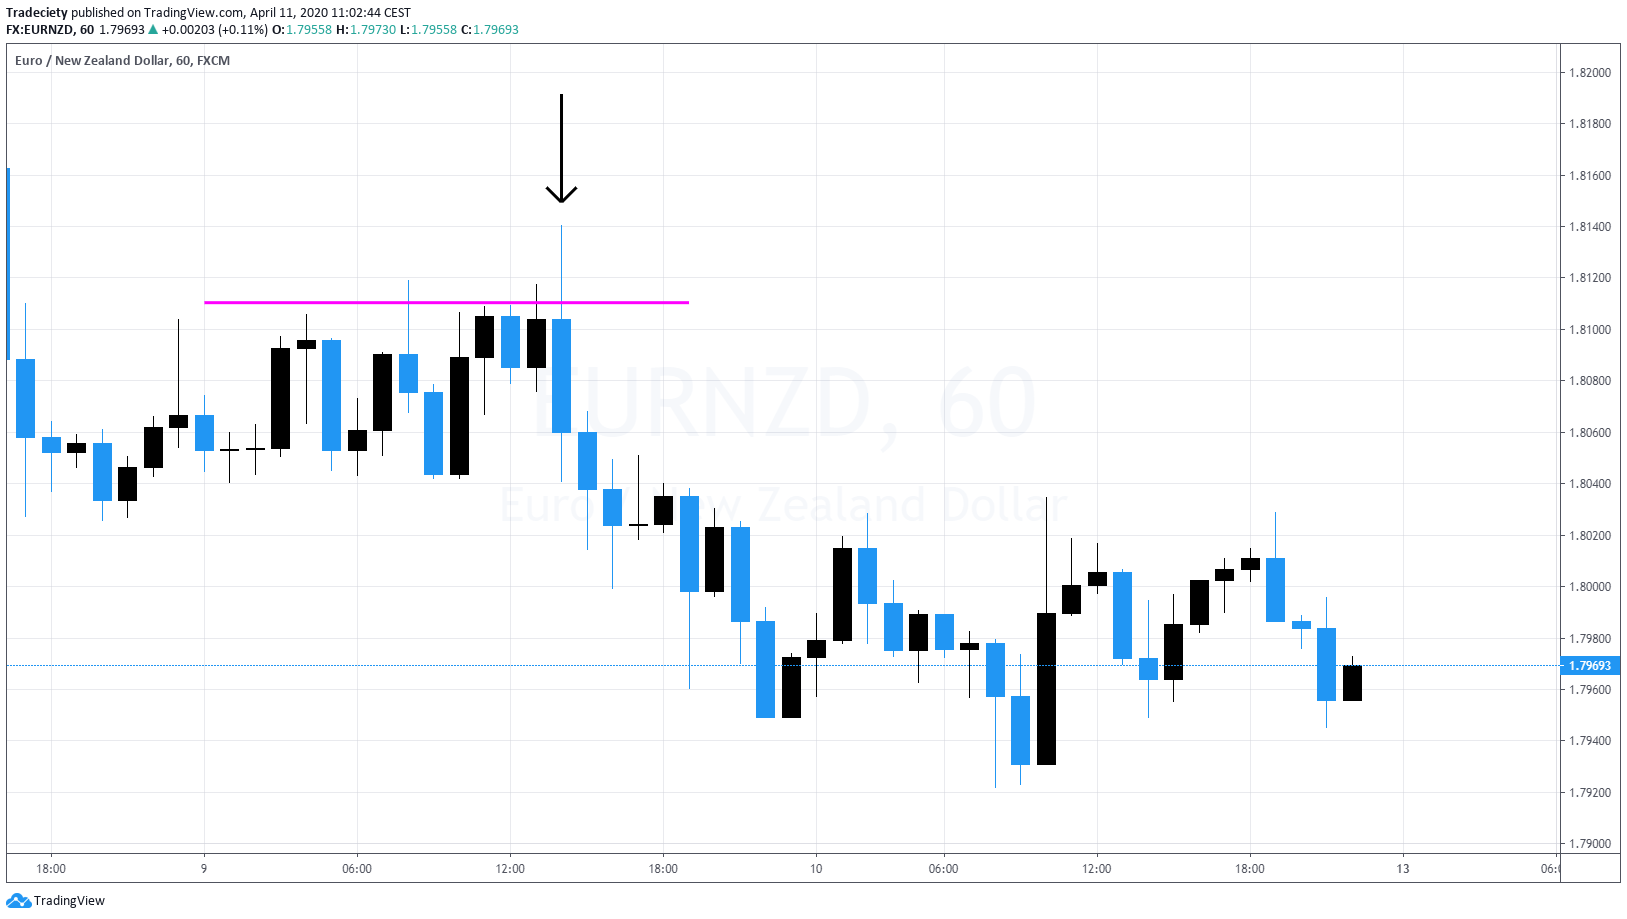
You really need to stick to your rules and not bend your rules, it’s very, very important. Very different here you can see you’re looking at a sideways range, very long and very tight sideways range of multiple candles. And this is something that happens very often. You see an initial quick move up and this will make some breakout traders to jump on long traits way too early. So many people will try to buy this initial breakout here when they don’t wait for the candle to close. And then they run into this trap where the market not only closes below the previous highs but it gives you even the opposite signal that now you have an engulfing pin bar with a very strong close here to downside and you can see afterward the market did move into new laws. Very, very strong signal here again, and it’s really important that you understand that looking at previous highs and lows and looking at where breakout traders will get in, how people placed a stop loss, how this will also impact your decision making.
(07:14):
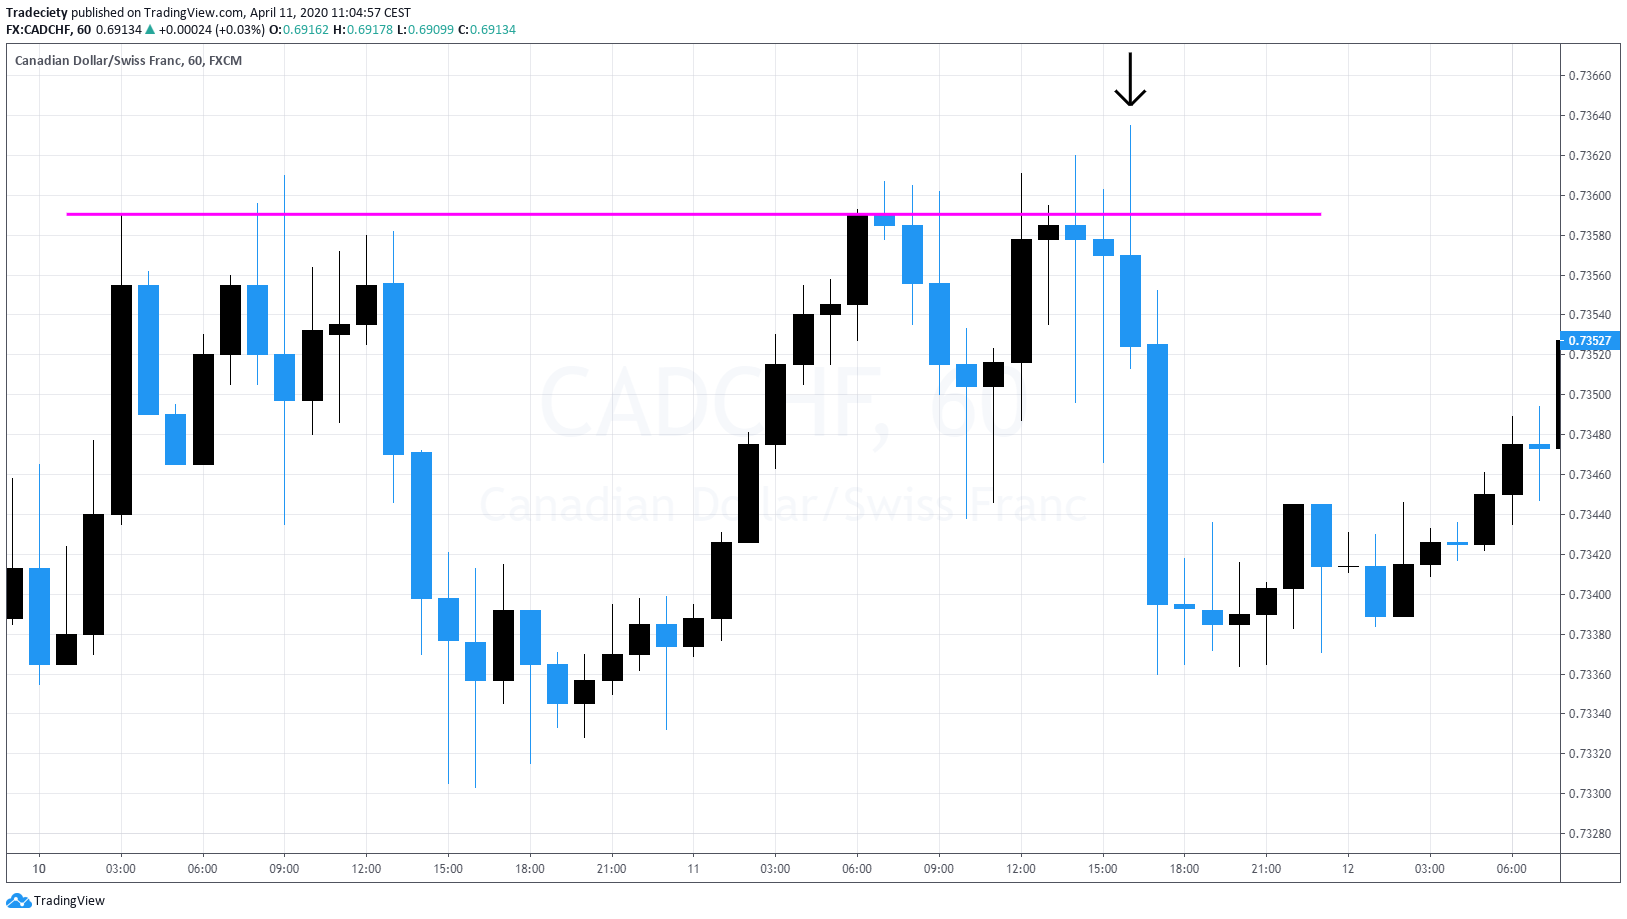
Final example, and once again the market moves here we have a resistance level on the left, the market moves slower a little bit and comes back into the previous highs. Many traders will use this area to place their stop loss order and you can see the market goes into the stop loss and goes for stop loss multiple times. But it wasn’t until we had this engulfing pin bar here that the market really sold off and you can see very, very strong close afterwards. I hope you enjoyed this video about engulfing pin bar. If you have any questions, make sure to leave a comment below and make sure to leave a thumbs up, share with your trading friends and I look forward to seeing you and to hearing from you in the next video.


external link:


3 min read
“95% of all traders fail” is the most commonly used trading related statistic around the internet. But no research paper exists that proves this...

3 min read
Trendlines can be great trading tools if used correctly and in this post, I am going to share three powerful trendline strategies with you.

3 min read
Choosing the right trading journal is essential for traders wanting to analyze performance, refine strategies, and improve consistency. In this...