Supply and Demand Trading in 2026
We have been trading supply and demand strategies for over ten years, and they have stood the test of time remarkably well. Supply and demand is...
When it comes to indicators, we can divide them into three classes:
Knowing which one belongs to which category, and how to combine the best indicators in a meaningful way can help you make much better trading decisions. On the other hand, combining indicators in a wrong way can lead to a lot of confusion, wrong price interpretation and, subsequently, to wrong trading decisions. Not good!
Indicator redundancy means that a trader uses different indicators which belong to the same indicator class and then show the same information on a trader’s charts.
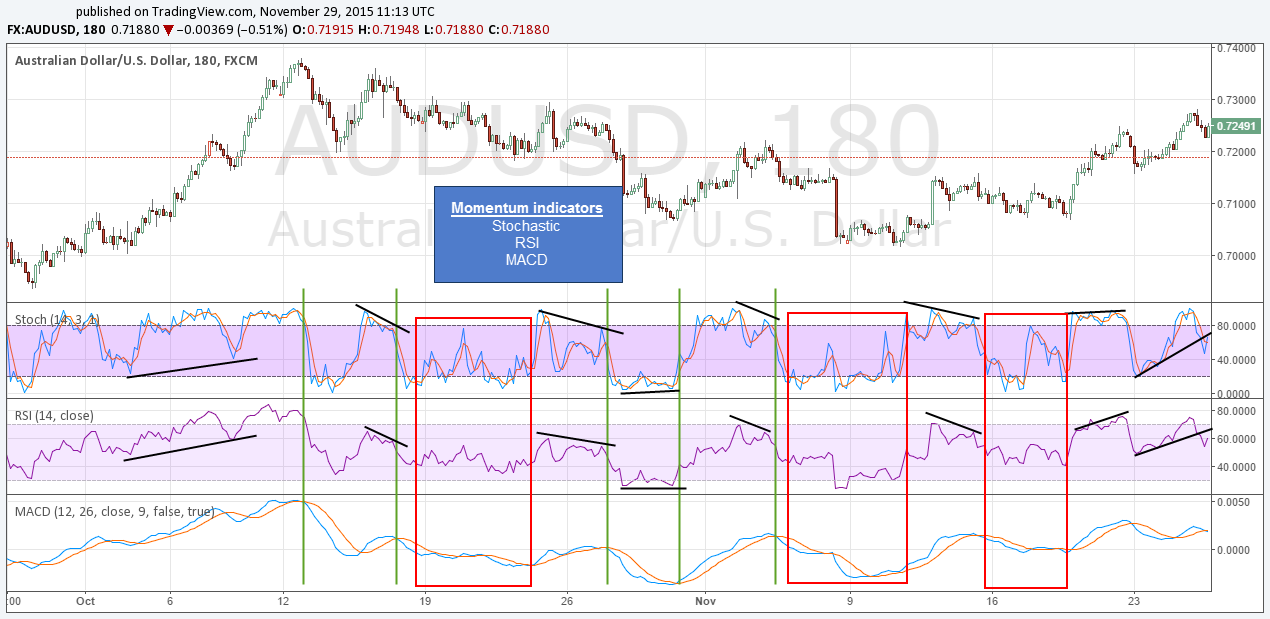
The screenshot below shows a chart with 3 momentum indicators (MACD, RSI and the Stochastic). Essentially, all 3 indicators provide the same information because they examine momentum in price behavior.
You can see that all indicators rise and fall simultaneously, turn together and also are flat during no-momentum periods (red boxes).
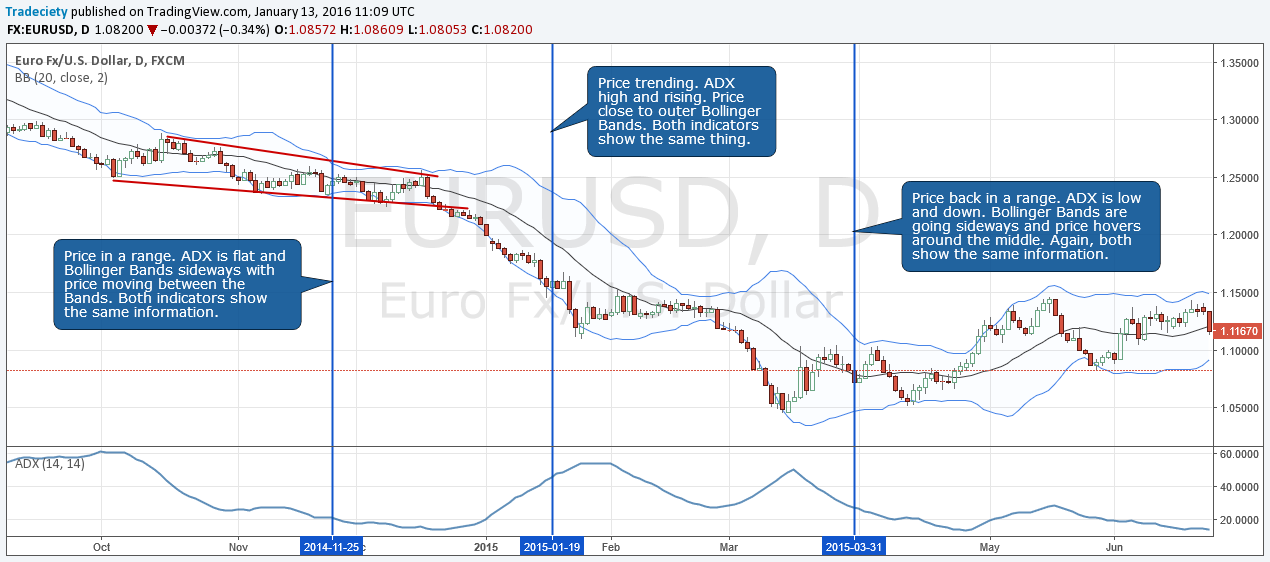
The next screenshot shows a chart with 2 trend indicators (the ADX and the Bollinger Bands). Again, the purpose of both indicators is the same: identifying trend strength.
You can see that during a trend, the Bollinger Bands move down and price moves close to the outer Bands. At the same time, the ADX is high and rising which also confirms a trend.
During a range, the Bollinger Bands narrow and move sideways and price just hovers around the center. The ADX is flat or going down during ranges giving the same signal.
The problem with indicator redundancy is that when a trader picks multiple indicators that show the same information, he ends up giving too much weight to the information provided by the indicators and he can easily miss other things.
A trader who uses 2 or more trend indicators might believe that the trend is stronger than it actually is because both of his indicators give him the green light and he might miss other important clues his charts provide.
The following table arranges the most commonly used indicators by categories. Now, you can avoid using indicators that are from the same category and combine indicators from different categories that complement each other.
Momentum |
Trend |
Volatility |
Chart studies |
| Stochastic | ADX | Bollinger Bands | Horizontal lines – range trading and breakouts |
|
RSI |
Moving averages | Standard deviation | Fibonaccis – retracements and pullbacks |
| CCI | ATR | Fib extensions – trend following targets | |
| Williams % | MACD | Keltner Channel | Trendlines – trend following and breakout |
| MACD | Parabolic SAR | Envelopes | |
| Bollinger Bands | |||
| Ichimoku Cloud | |||
Now comes the interesting part.
The screenshot below shows a chart with three different indicators that support and complement each other. The RSI measures and identifies momentum plays, the ADX finds trends and the Bollinger Bands measure volatility. Note here that we do not use the Bollinger Bands as a trend indicator but just for volatility.
We will go through points 1 to 5 together to see how the indicators complement each other and how choosing an indicator for each category helps you understand the price much better.
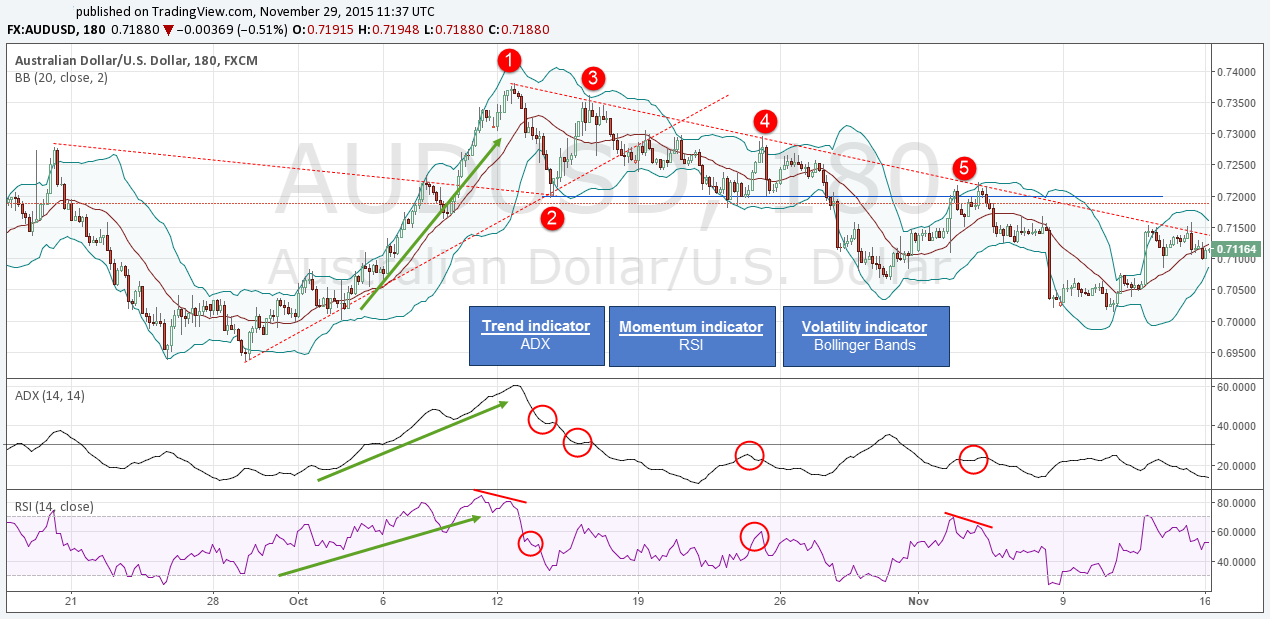
Point 1: Prior to point 1, the ADX shows an ongoing trend and the RSI confirms the rising momentum. During that trend, support and resistance broke as long as the ADX kept above 30 and rising.
Point 2: The ADX has turned and shows losing (bullish) trend strength – an indication that the support level might not break. Price did not make it past the Bollinger Bands and bounced off the outer Band.
Point 3: At point 3, price is in a range and the ADX loses its validity – an ADX below 30 confirms range-environment. In a range, the RSI indicator can help identify turning points together with the Bollinger Bands.
Point 4: The same holds true for point 4 – the ADX is still below 30. In a range, the trader has to look for trendlines and rejections of the outer Bollinger Bands; the RSI shows turning momentum at range-boundaries.
Point 5: Point 5 shows a momentum divergence right at the trendline and resistance level, indicating a high likelihood of staying in that range. Again, price could not get outside the Bollinger Bands and the ADX is flat.
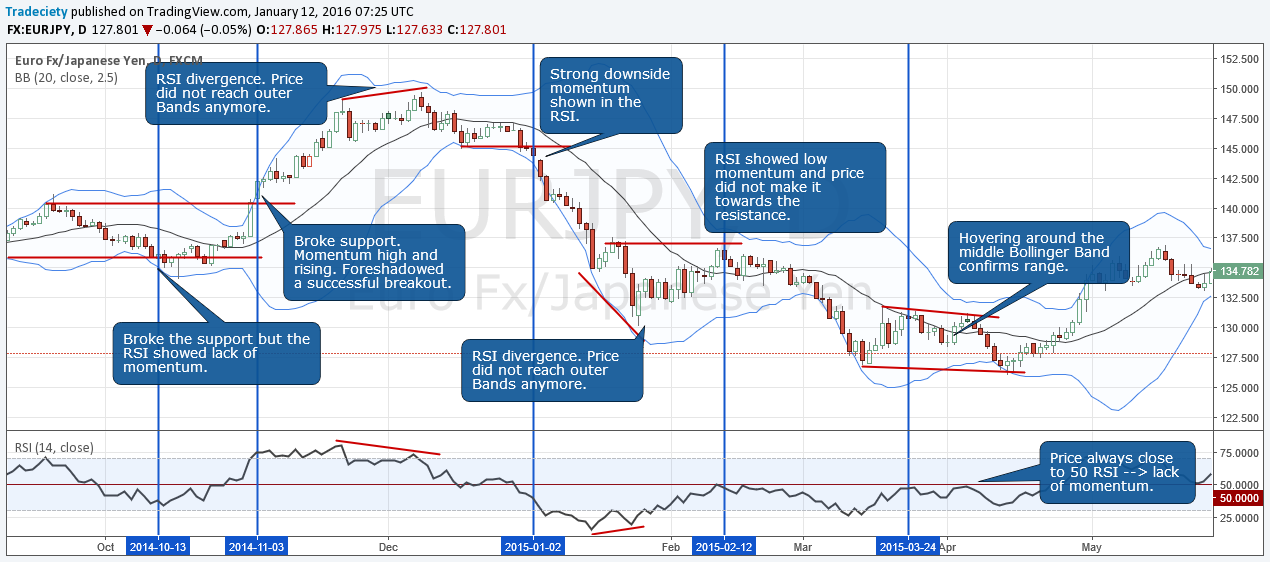
The next chart shows that by combining a RSI with Bollinger Bands, you can get complimentary information as well.
The RSI provides momentum information: a low and falling RSI shows increasing downside momentum; an RSI around 50 signals a lack of momentum; a high and rising RSI shows strong bullish momentum.
The Bollinger Bands not only provide volatility information, but they also provide trend information: price between the middle and outer Bands shows a trending phase; price breaking the middle Band shows a potential reversal; and when price doesn’t reach the outer Band anymore, it shows fading trend support.

The perfect combination of indicators is not the one that always points in the same direction, but the one that shows complimentary information. Knowing which indicator to use under which circumstances is a very important part of trading.
Combining indicators that calculate different measurements based on the same price action, and then combining that information with your chart studies will very quickly have a positive effect on your trading.
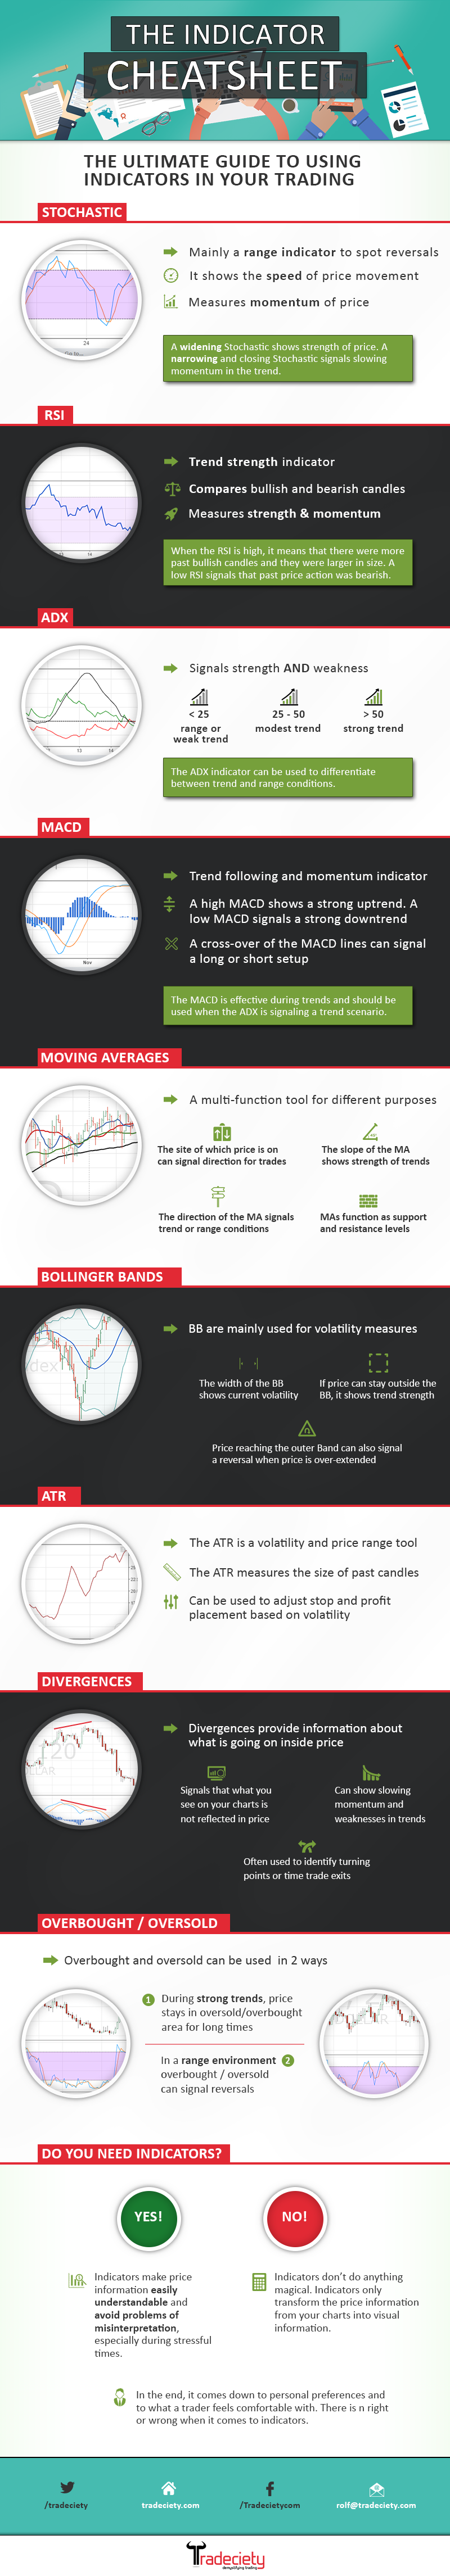
Further reading: Indicator cheat sheet
external link:


We have been trading supply and demand strategies for over ten years, and they have stood the test of time remarkably well. Supply and demand is...

3 min read
Choosing the right trading journal is essential for traders wanting to analyze performance, refine strategies, and improve consistency. In this...

3 min read
“95% of all traders fail” is the most commonly used trading related statistic around the internet. But no research paper exists that proves this...