Supply and Demand Trading in 2026
We have been trading supply and demand strategies for over ten years, and they have stood the test of time remarkably well. Supply and demand is...
Among the many available indicators, the VWAP indicator—or Volume Weighted Average Price—is particularly popular for day trading. By analyzing price movements, volume, and market trends, the VWAP can offer valuable insights into when to buy or sell. It’s a key tool that blends both price and volume, giving traders a clearer picture of an asset's average trading price throughout the day.
In this guide, we'll explore what the VWAP indicator is, how it works, and how you can leverage it effectively in your trading strategies.
The VWAP indicator (Volume Weighted Average Price) is a popular trading tool used to measure the average price of an asset, factoring in both price and volume over a specific time frame, usually intraday. It differs from regular moving averages because it emphasizes the volume at each price level, offering a more nuanced view of the price action.
In Tradingview, you find the built-in VWAP when you search under indicators.

The VWAP resets every session (every day) on midnight, making it a great indicator for day traders looking to analyze intraday price movements. For the purposes of this article, we deactivated the "bands" on the indicator and we focus purely on the acutal VWAP.

To calculate VWAP, you take the total dollar amount of trades (price times volume) and divide it by the total volume. Essentially, it gives you the average price paid per share, adjusted for how many shares were traded at each price point.
VWAP = (Price x Volume) / Total Volume
The VWAP indicator helps traders identify the average price of a stock or other asset over a specific period, taking both price and volume into account. This makes it a highly effective tool for identifying value, particularly in intraday trading. It’s a reliable way for traders to see if they are buying or selling at favorable prices compared to the market’s average.
The VWAP indicator in trading integrates two critical elements: price and volume. By weighing the price by volume, it offers a more detailed picture of market sentiment. Here's a key principle to remember:
When the price is above VWAP, it’s considered bullish, indicating that the market is trending upwards and traders are willing to pay above the average price.
When the price is below VWAP, it's viewed as bearish, showing that the asset is trading below its average price, and the market may be in a downward trend.
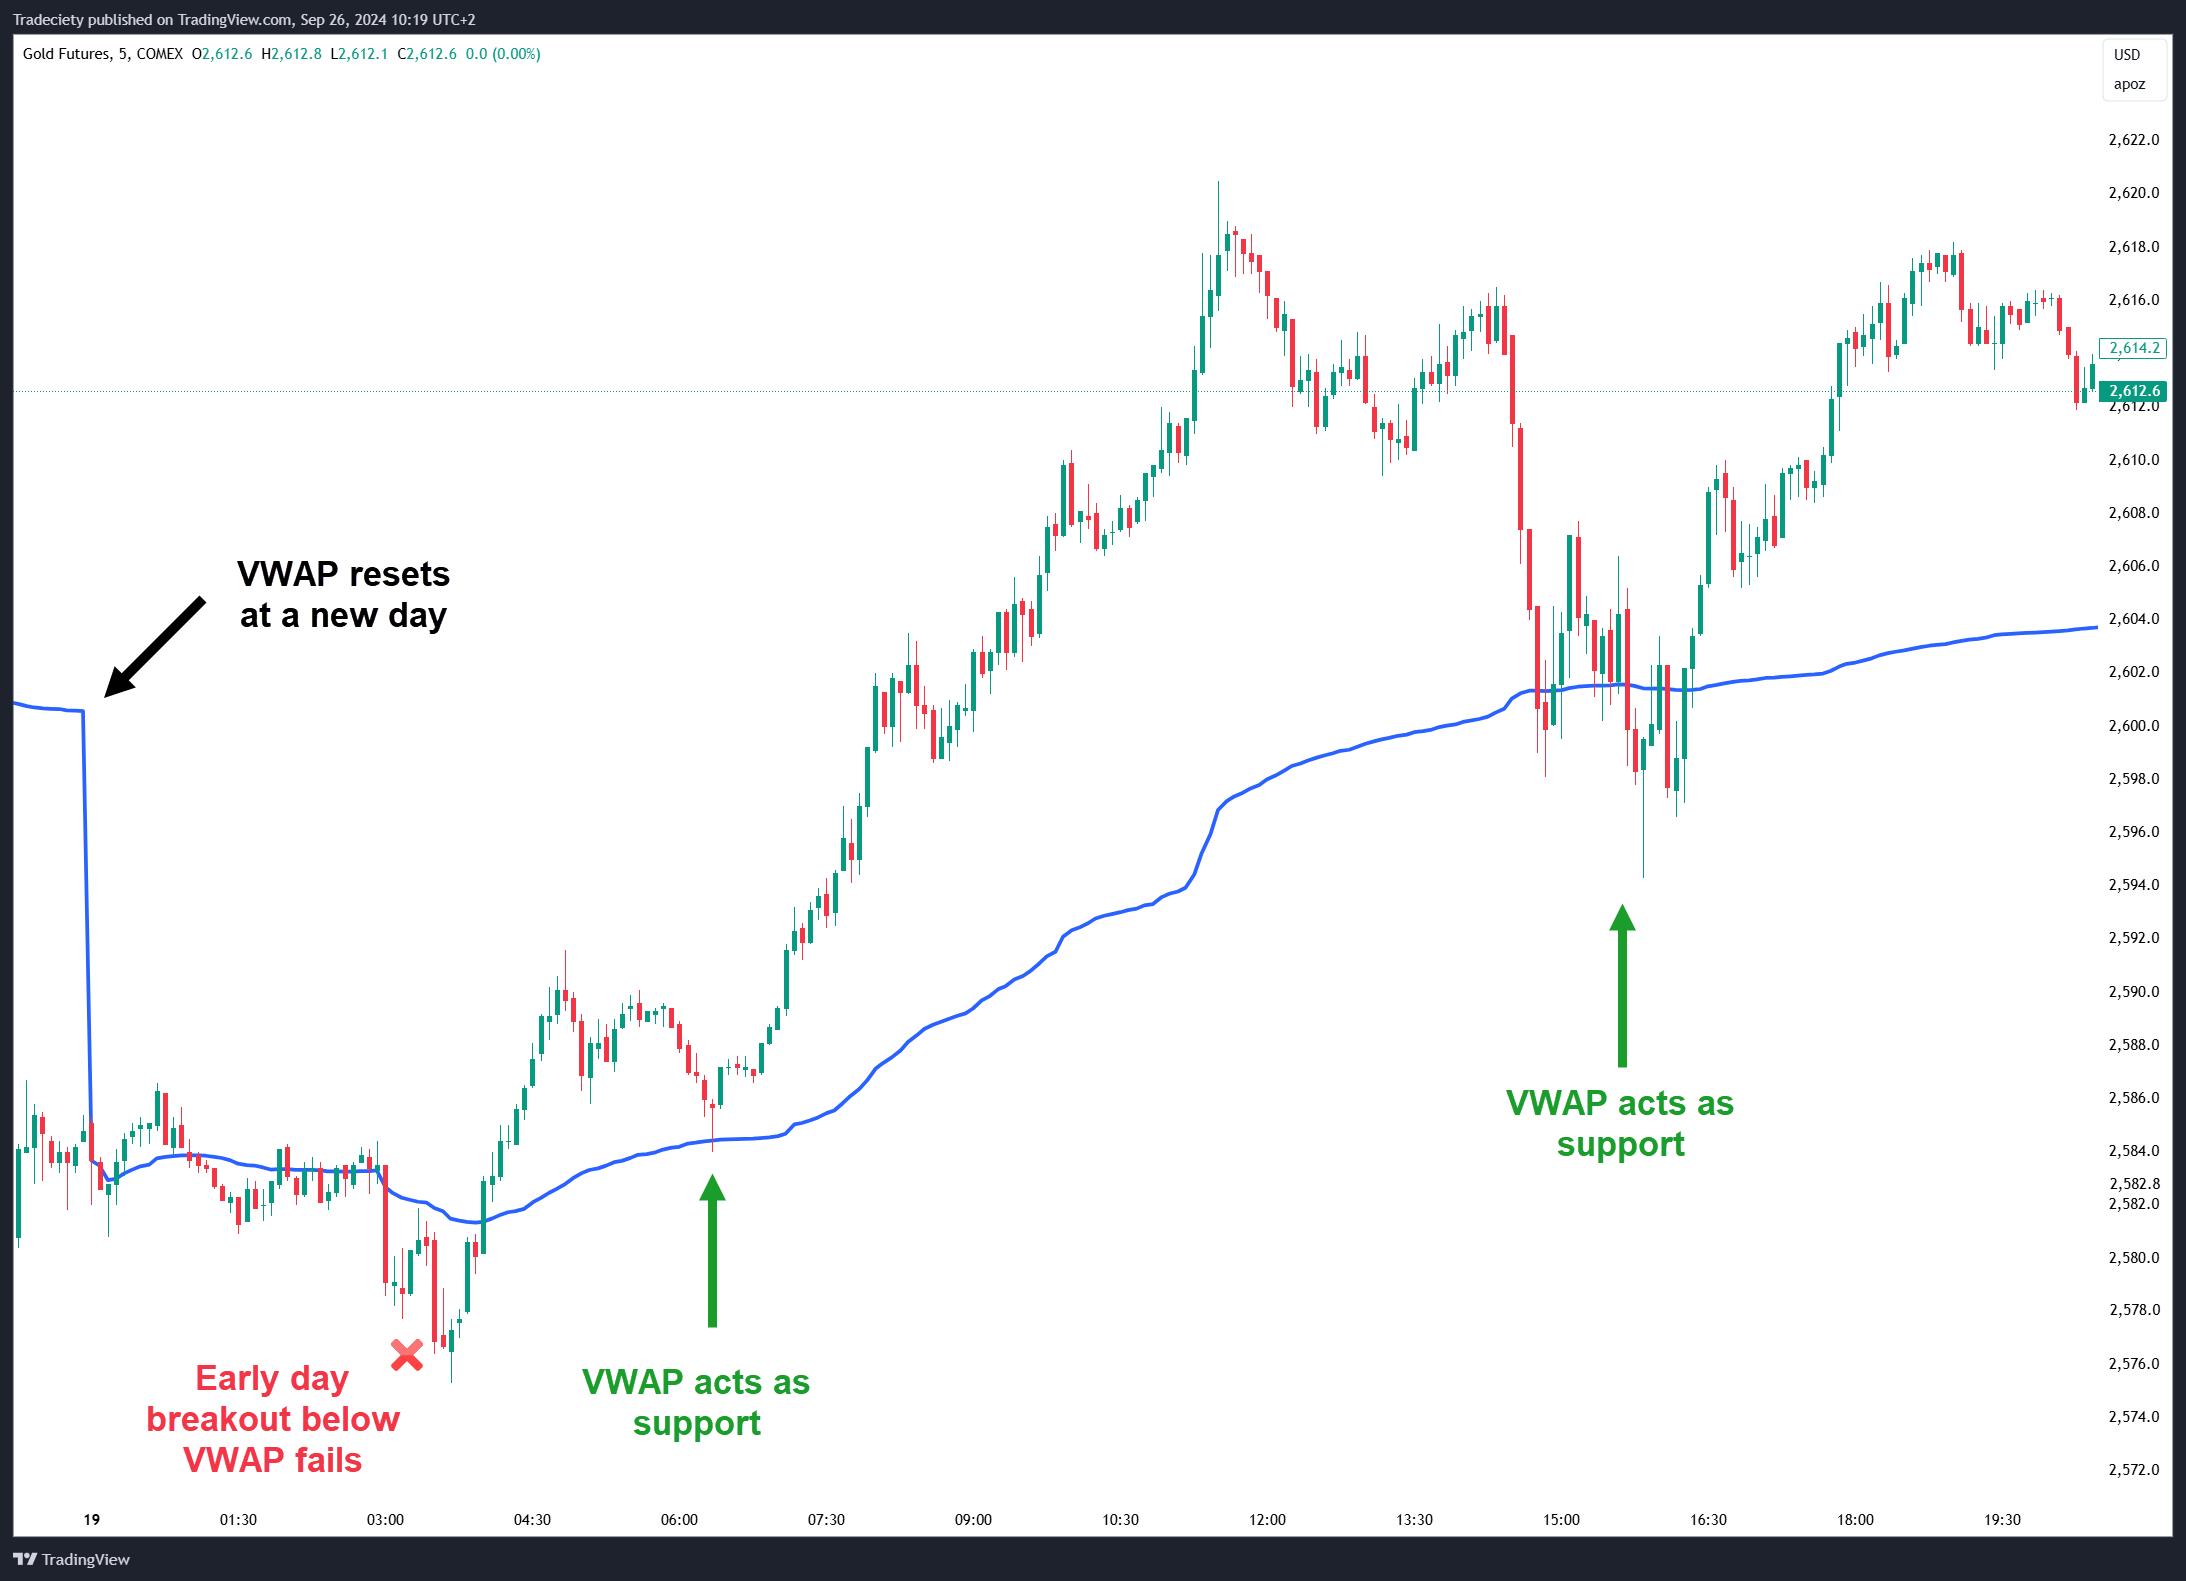
At the beginning of a new day (midnight) the VWAP resets. Early in the day, you see that the price is trading around VWAP. An early day breakaway from the VWAP is common and it is important to analyze if the breakaway succeeds or fails. In the example below, the initial breakaway lower fails which puts the odds in the favor of a bull market.
Going forward, VWAP pullbacks and retests can then be used to identify entry signals.
While both VWAP and moving averages (like SMA and EMA) are used to analyze price trends, they have significant differences.
Simple Moving Averages (SMA) and Exponential Moving Averages (EMA) are calculated purely based on price and are commonly used to smooth price data over a set period. However, they do not account for volume, which can be a key driver of price action.
The VWAP indicator is especially valuable for intraday traders since it resets daily and incorporates volume, making it a more accurate reflection of market sentiment within that day. On the other hand, moving averages are more useful for identifying longer-term trends.
Use VWAP for short-term, intraday strategies to find the average price adjusted for volume.
Use moving averages for trend analysis over longer periods, where volume data is less critical.
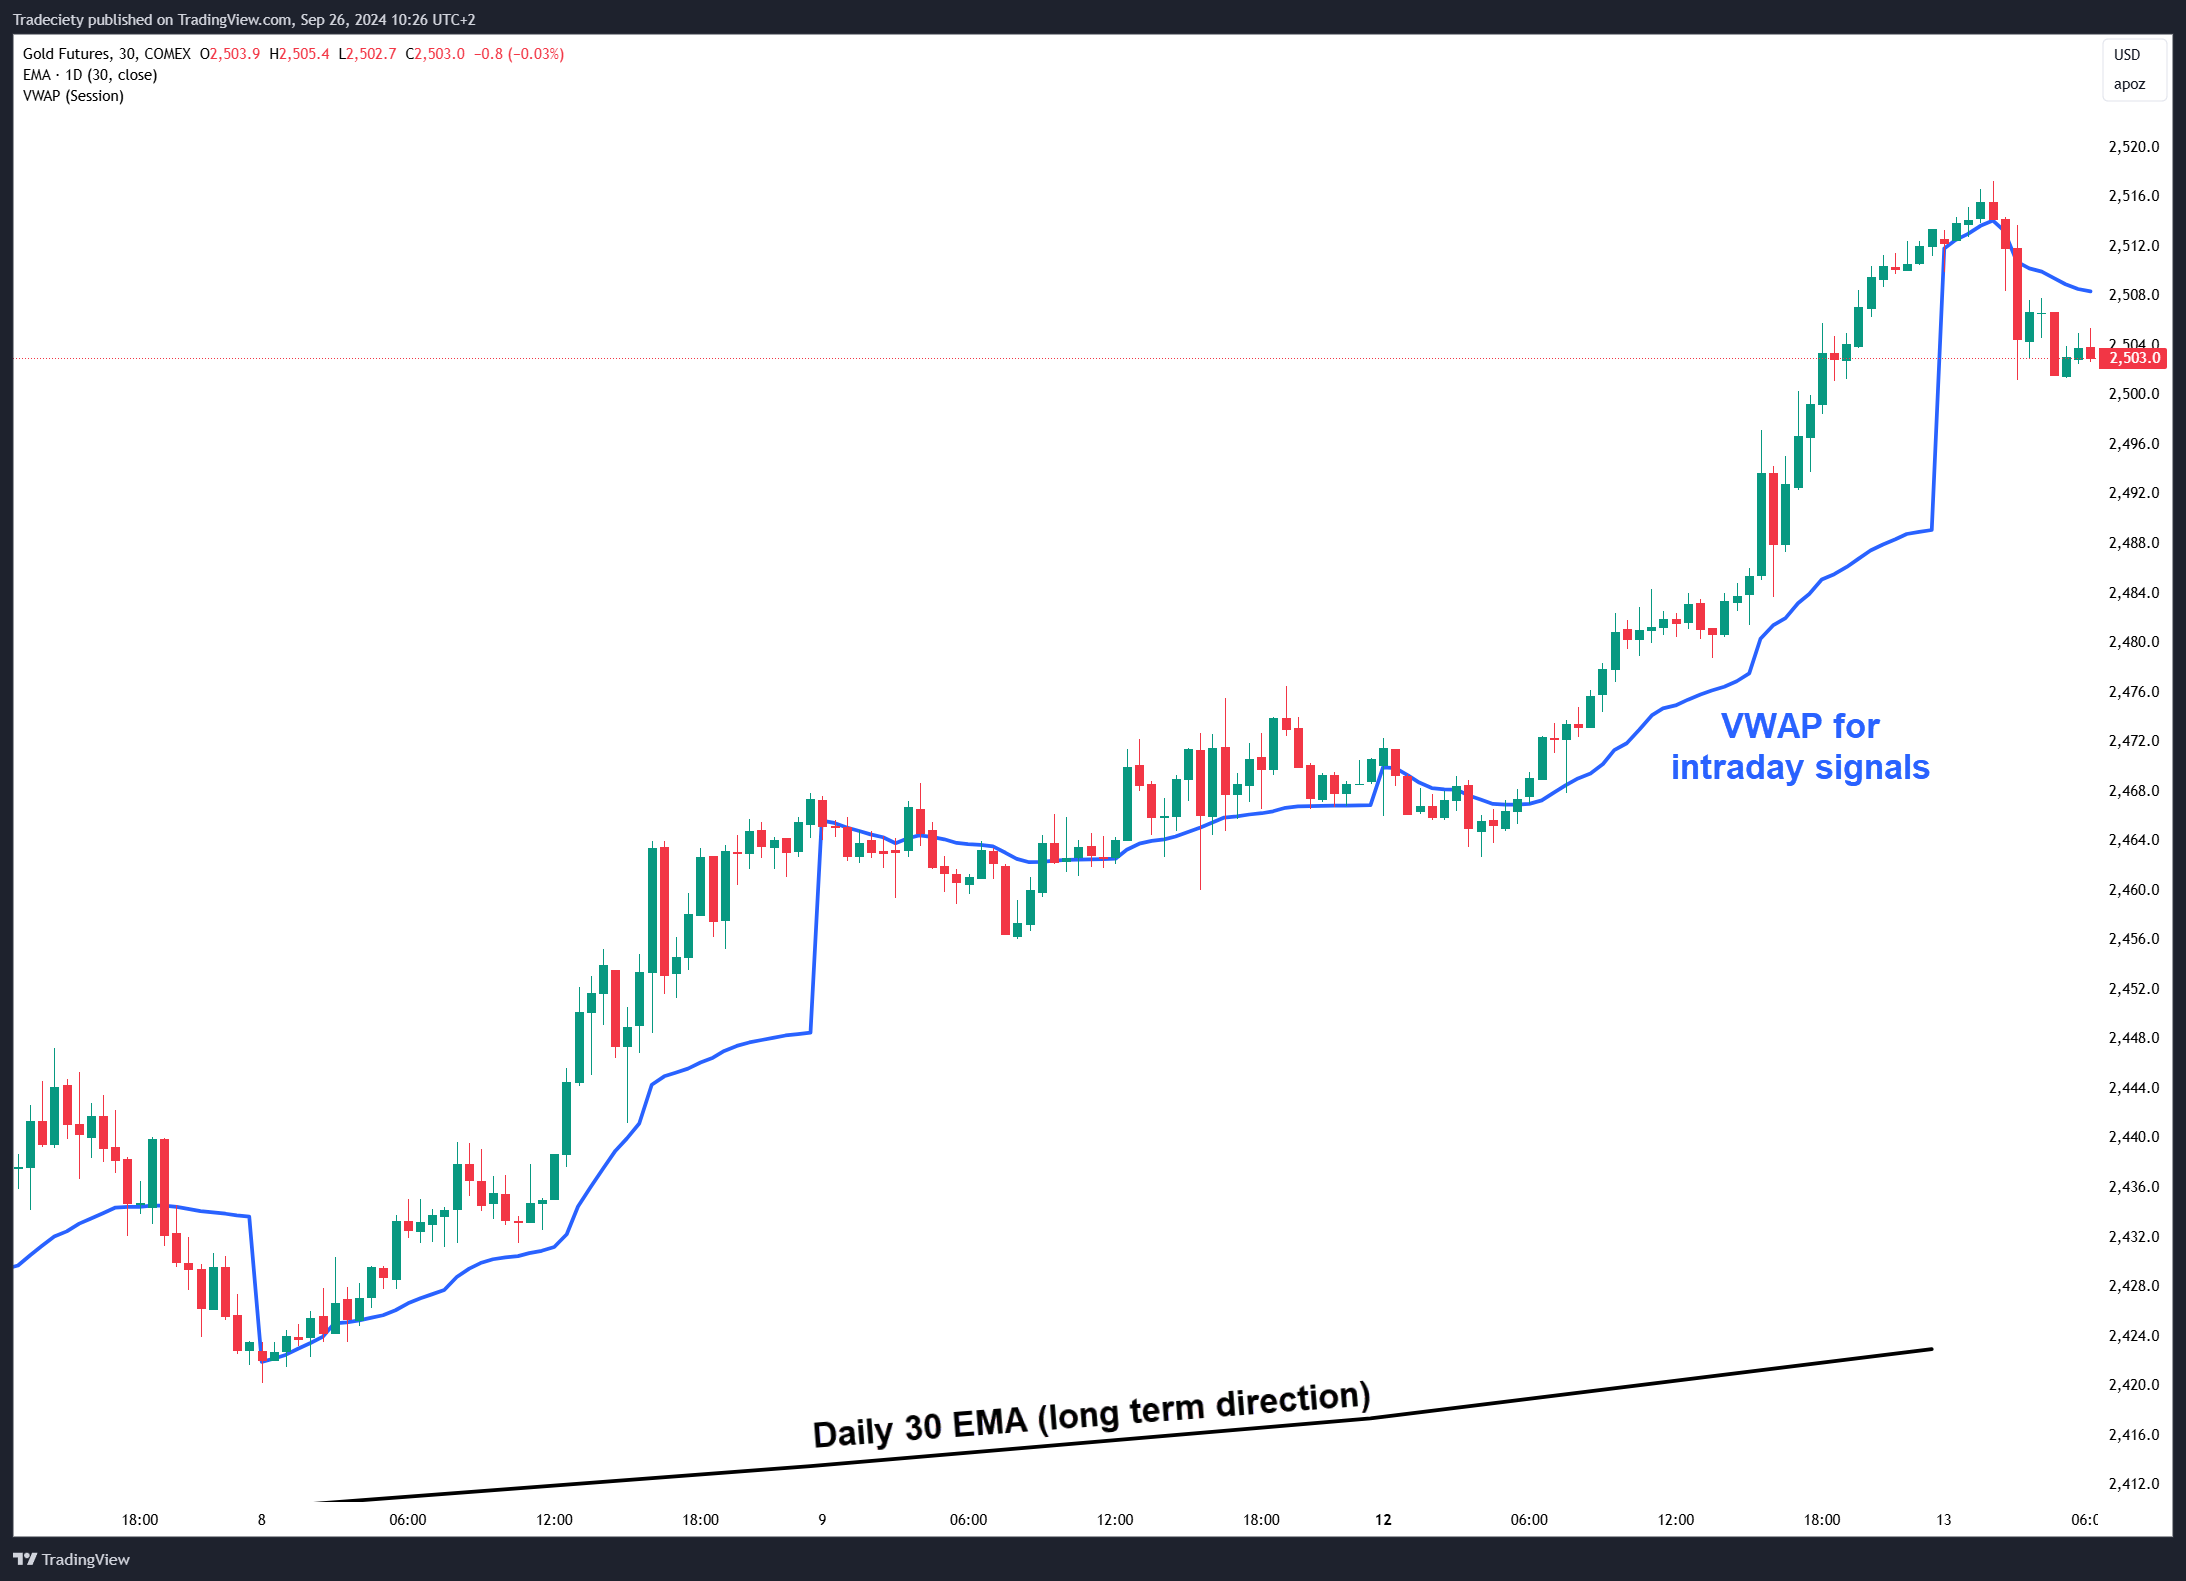
In the scenario below, the daily 30 EMA (black line) provides the long-term trend direction. And because the price is trading above the daily 30 EMA, traders only look for long signals and ignore all short signals.
The VWAP can then be used to find long intraday signals into the long-term trend direction. All bearish VWAP signals below the VWAP are ignored.
Professional traders frequently rely on VWAP to assess whether they are executing trades at a favorable price compared to the rest of the market. It serves as a price benchmark that ensures large trades do not significantly influence market prices.
Retail traders can use VWAP similarly to monitor market activity and gain a sense of whether they are buying or selling at a favorable price relative to institutional activity.
There are several popular VWAP trading strategies that traders can implement to take advantage of price trends.
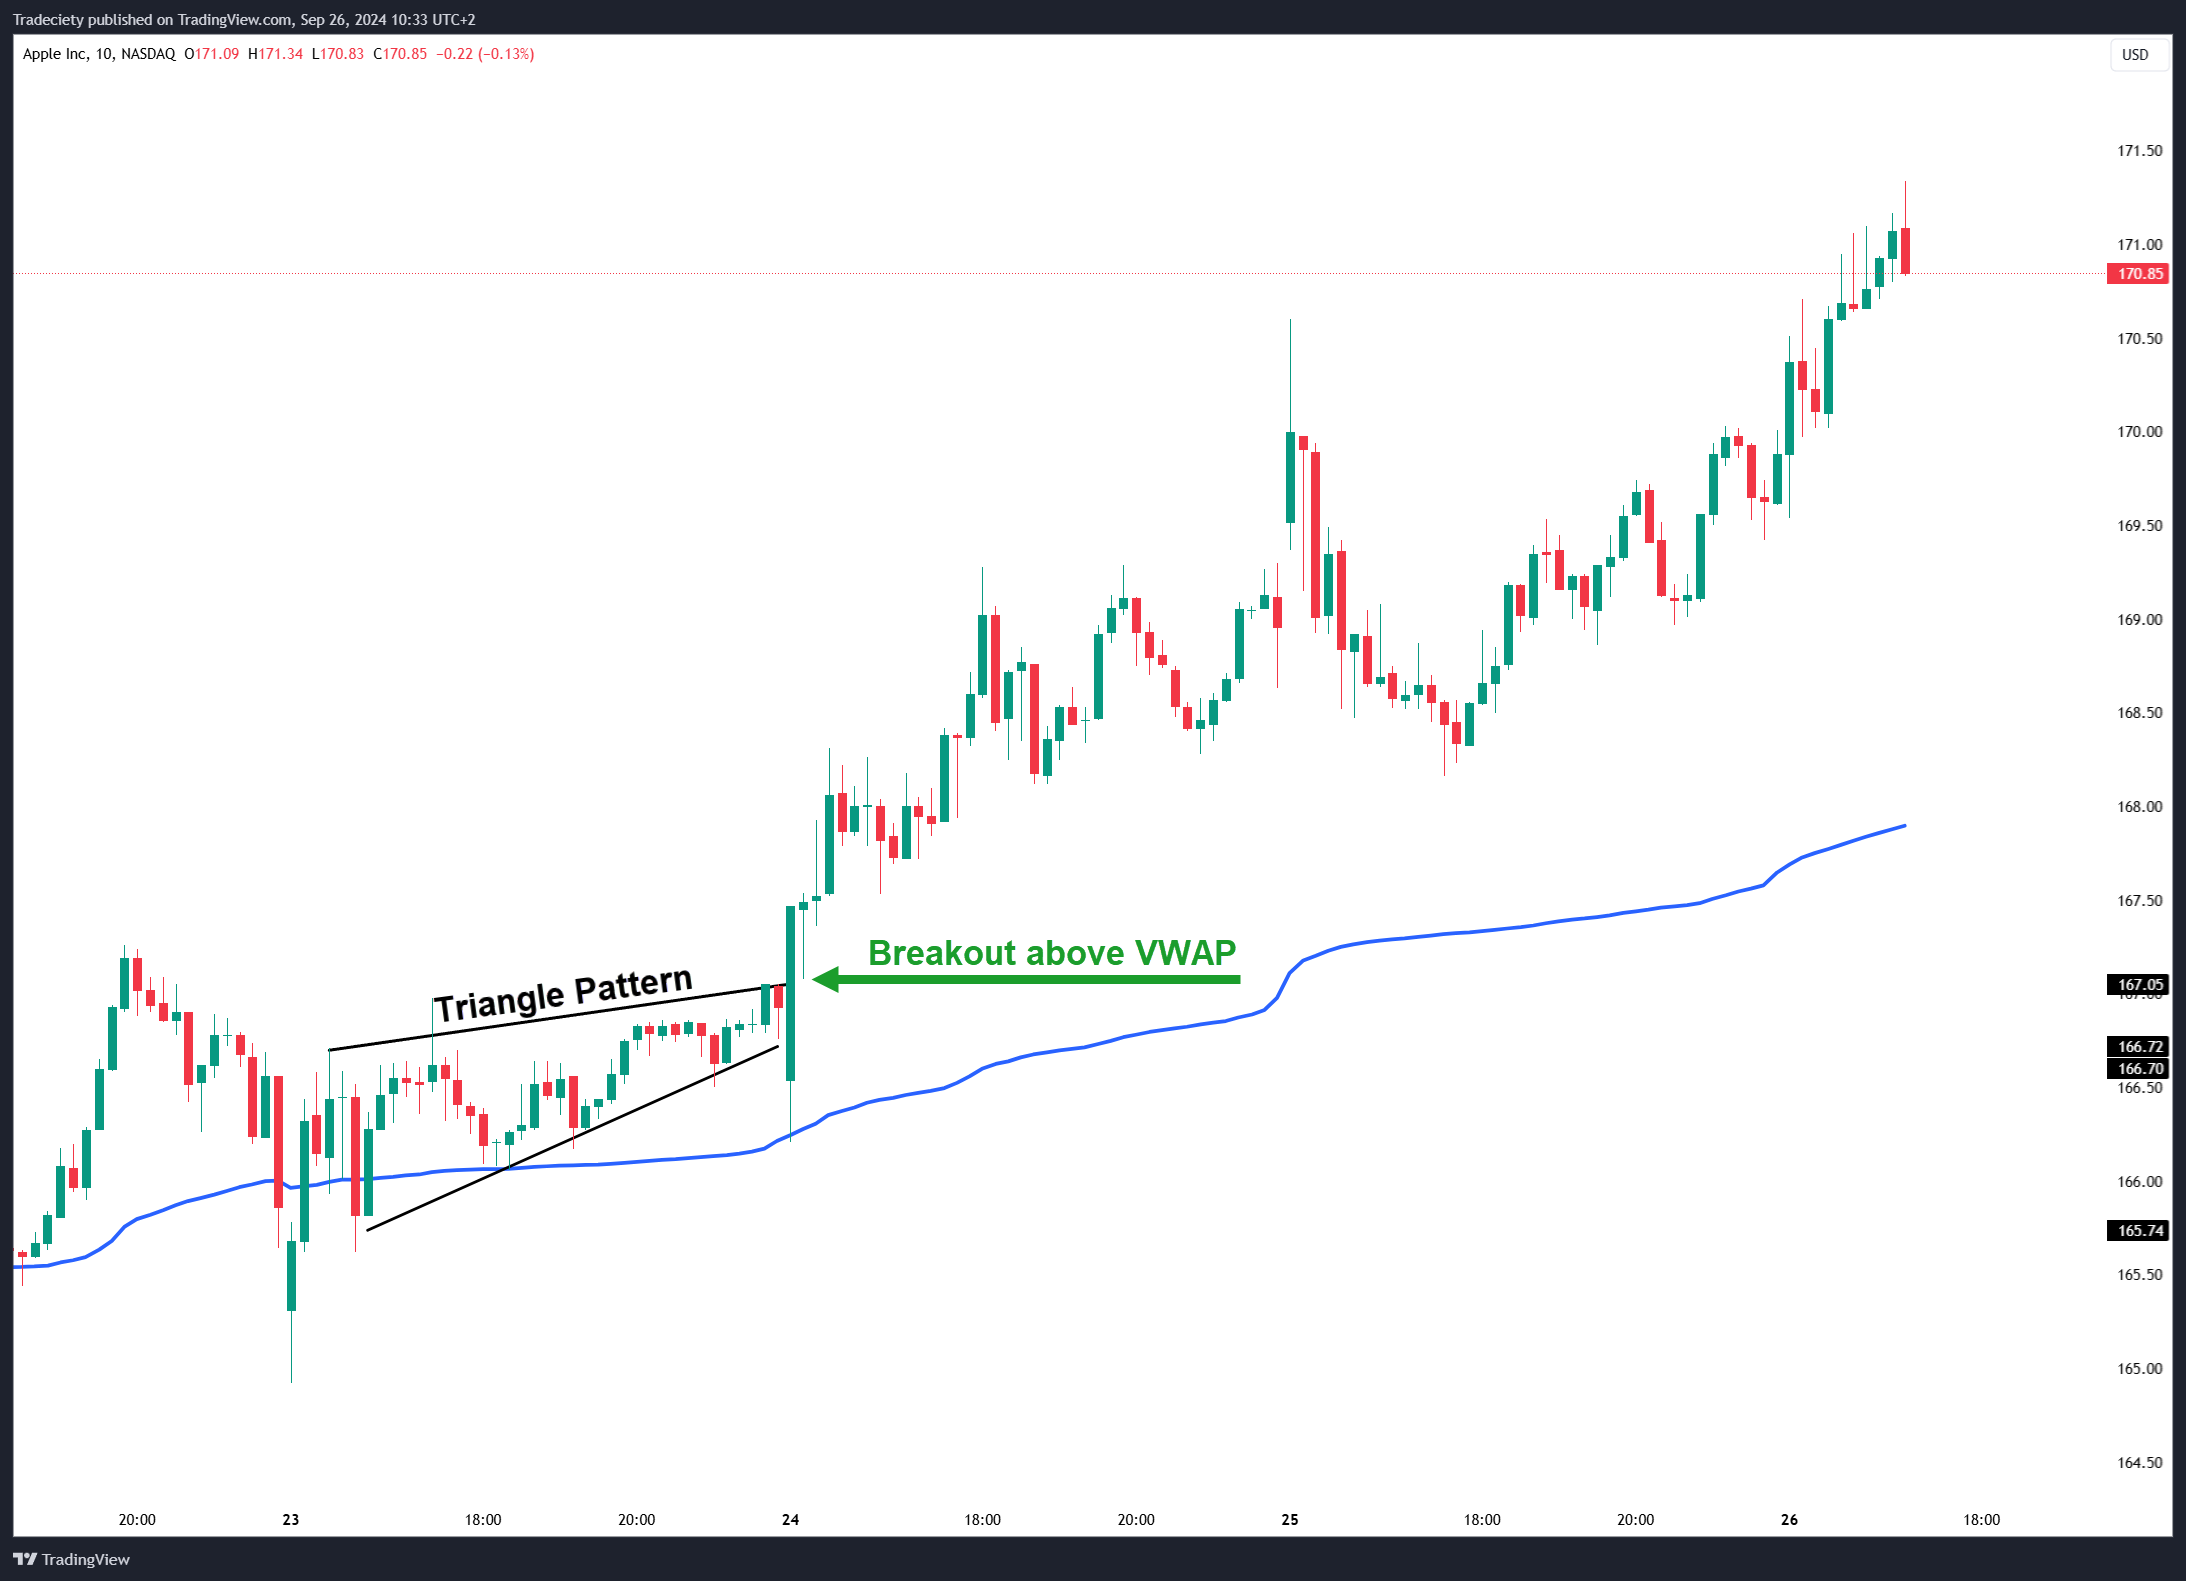
A breakout strategy using VWAP involves waiting for the price to move significantly above or below the VWAP line. For instance, if the price crosses above VWAP with increasing volume, it could signal a bullish breakout.
In the scenario below, the price traded inside a narrow triangle pattern just above the VWAP. The strong breakout candle then provided a potential entry signal as price was breaking away strongly from the VWAP.
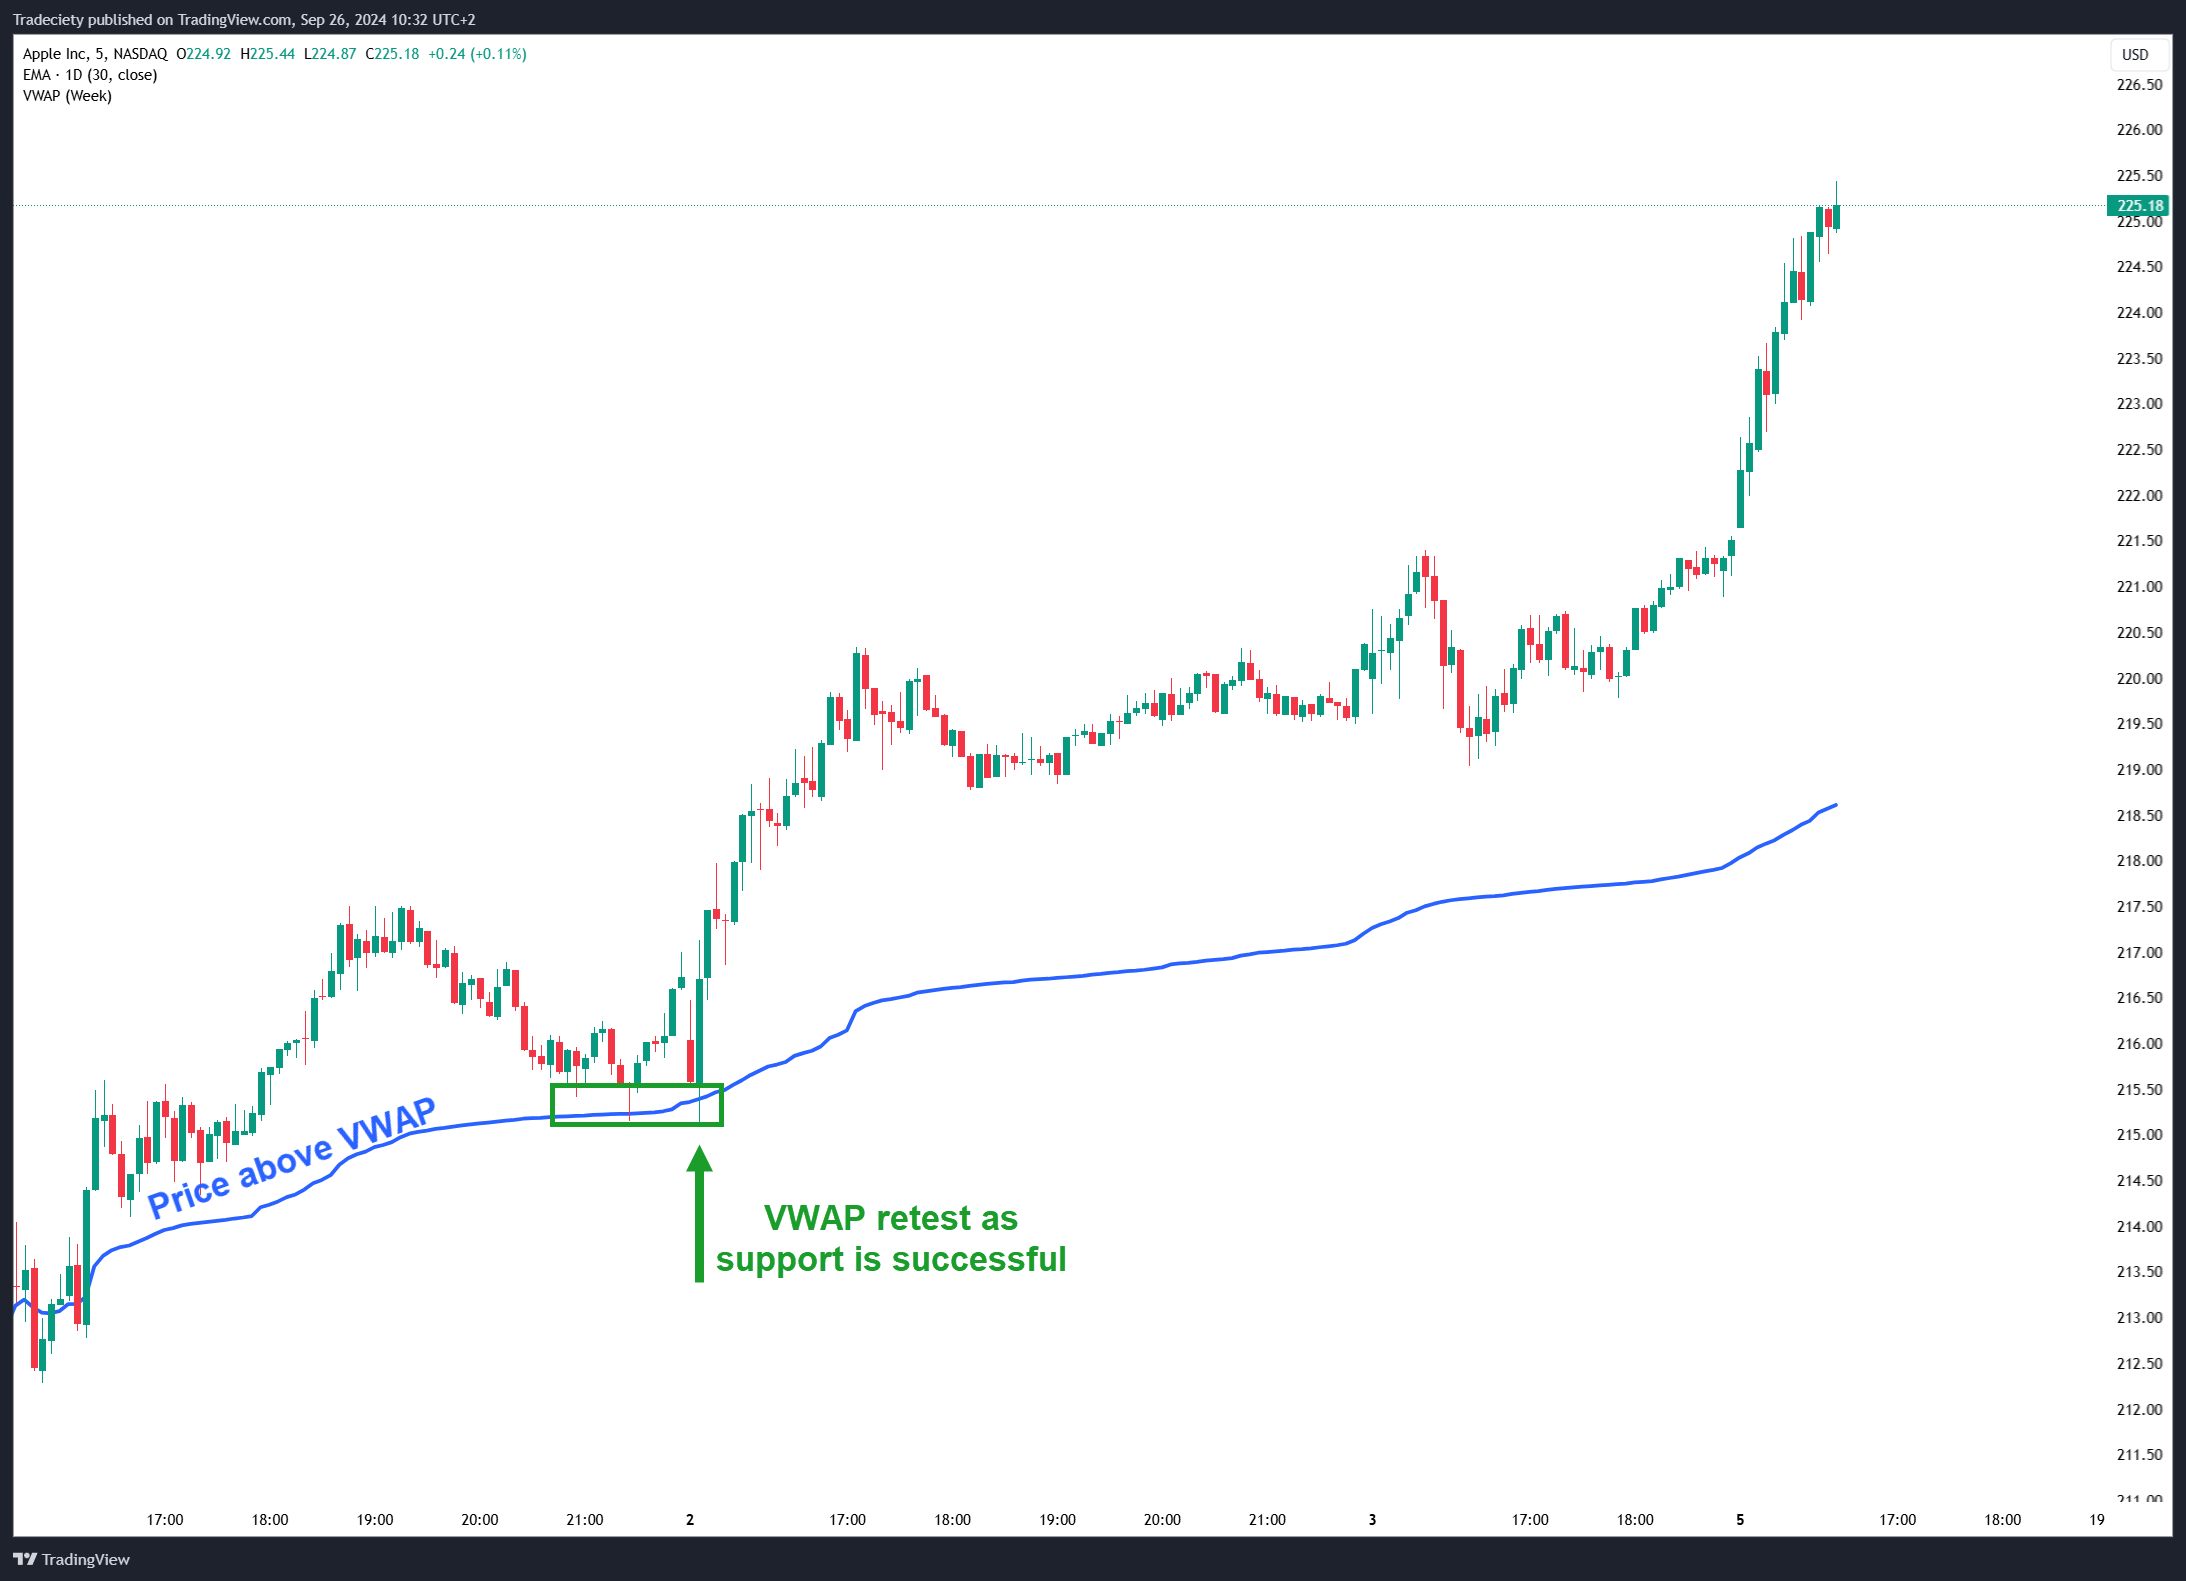
In a pullback strategy, traders look for price retracements back to the VWAP line after a strong move. For example, after the price rallies above VWAP, a pullback to the VWAP level could present a buying opportunity, assuming the upward trend continues.
The price is in an initial uptrend trading above the VWAP. The pullback into the VWAP was successful because the VWAP held as support level and the price was never able to close below the VWAP. The strong bullish candle away from the VWAP could have been a potential entry signal into the uptrend.
There are several key advantages of VWAP that make it a favorite among day traders:
Accurate Price Levels: VWAP provides more accurate price levels for entry and exit points because it factors in volume.
Intraday Trading Efficiency: It improves efficiency for intraday trading, allowing traders to better time their trades.
Price-Volume Correlation: VWAP integrates both price and volume, offering a fuller picture of the market's real-time dynamics.
The VWAP indicator is an essential tool for both professional and retail traders, especially for those engaged in day trading. Its ability to combine price and volume into a single metric makes it invaluable for identifying market sentiment, potential entry points, and exit strategies. Whether you’re a beginner or a seasoned trader, incorporating VWAP into your trading strategy can offer a more informed and efficient approach to the markets.
To truly master VWAP, test out its use in different market conditions, refine your strategies, and continually adapt as you grow in experience.
VWAP is most effective on intraday charts, as it resets daily and is designed for short-term trading.
If you are looking for longer-term approach, you can change the anchor period to weekly which makes the VWAP at the beginning of a new week.
While VWAP is primarily a day-trading tool, it can offer value in longer-term trading when used alongside other indicators. However, its effectiveness diminishes the longer the time frame.
In low-volume markets, VWAP can be less reliable due to the lack of sufficient data, leading to distorted signals.
Institutional traders use VWAP to execute large trades without significantly impacting market prices, ensuring they are getting an average price comparable to other traders.
external link:


We have been trading supply and demand strategies for over ten years, and they have stood the test of time remarkably well. Supply and demand is...

3 min read
Choosing the right trading journal is essential for traders wanting to analyze performance, refine strategies, and improve consistency. In this...

3 min read
“95% of all traders fail” is the most commonly used trading related statistic around the internet. But no research paper exists that proves this...