Supply and Demand Trading in 2026
We have been trading supply and demand strategies for over ten years, and they have stood the test of time remarkably well. Supply and demand is...
7 min read
Rolf
Sep 2, 2019 5:21:40 AM
Anyone trading Forex or any other financial markets for a while knows that trends don’t last long. In fact, the majority of a trader’s screen time is spent looking at a price chart where the currency pairs move up and down between a narrow range. However, during those few precious moments of a trending market, the price action often gives out hints about whether the trend will continue or reverse.
When Forex traders talk about the triangle pattern, they are indicating a very specific chart pattern, usually identified when the upper and lower ends of a price action form trend lines or a combination of a trend line and a horizontal line that intersect each other, creating a triangle.
Figure 1: Ascending, Descending, and Symmetrical Triangle Patterns
One of the best ways to figure out if a trend will continue or not is learning to identify triangle patterns. Being a signal for trend continuation or reversal, triangle patterns are often called bilateral pattern. However, the majority of the time, bilateral patterns end up breaking in the direction of the prevailing trend and that’s why most traders recognize these as continuation patterns.
Depending on the location of the triangle pattern, it can also signal a reversal of the prevailing trend. For example, if you see a triangle pattern forming after a series of bullish or bearish moves, it can easily signal a reversal as well. To identify if a continuation or reversal pattern, you can use more elaborate technical analysis tools such as Elliot Waves or simply combine other technical indicators and take a more commonsense approach.
As you know, even during a trend, the market usually never climbs or falls freely. Different traders enter the market at different times with different trading strategies. Some market participants will reduce their exposure after the initial trend to take some profits off the table. Some will add more exposure to their existing positions with the hope to capture the entire trend in order to maximize their profits.
These dynamic behaviors of different traders cause the market the fluctuate. Regardless of which time frame you are trading, there will always some contradiction. Generally, after a major trend takes place, the retracement happens because a lot of traders reduce their exposure in the direction of the trend.
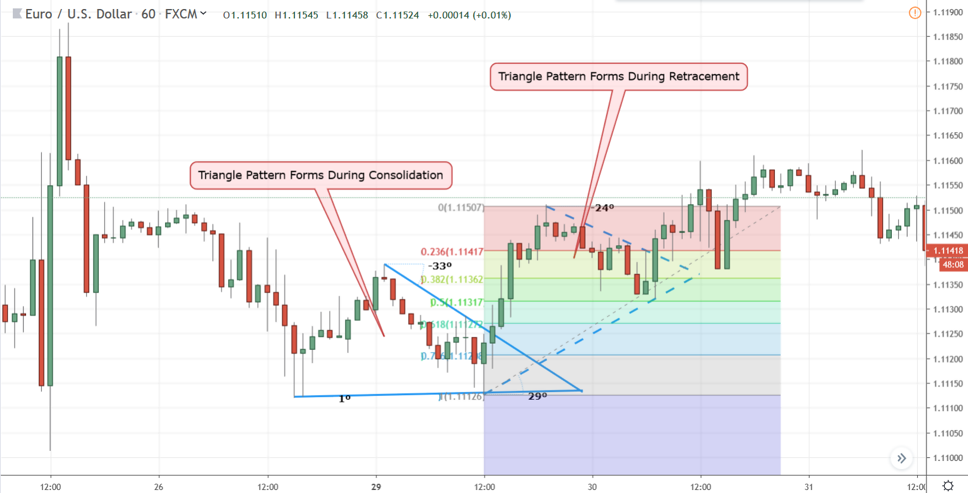
Figure 2: Triangle Patterns Form During Consolidations and Retracements
Most triangle patterns form during this time of minor consolidation when assets are changing hands from traders who were initially bullish to a new set of traders who believes that the trend will likely continue. However, after the initial retracement, smaller traders enter the market and the liquidity as well as volatility starts to go down. In a chart, you can see this process as the formation of a triangle.
However, if there is a news that fundamentally supports the prevailing trend, suddenly, larger traders like institutional investors or banks enter the market and the low liquidity state causes prices to spike up, breaking the triangle.
Now that you have gotten a basic understanding of why triangles form in the market, let’s discuss some of the major benefits of using triangle patterns to enhance your trading.
There are many advantages of using triangle patterns because these will not only signal that if a trend is about to continue or reverse, if you know how to interpret different types of triangles, it can reveal how far the trend continuation or reversal will reach, which can help you calculate your reward to risk ratio for the trade. Furthermore, knowing a concrete profit target based on the length of the triangle can also improve your money management strategy and make it more accurate.
Regardless of how you want to integrate triangle patterns into your trading strategy, it will provide you with a unique edge. While indicator-based technical analysis that utilizes mathematical models to draw a conclusion regarding the directional movement in the market, mastering triangle will provide you with predictive capability that technical oscillators like MACD or Stochastics will never be able to.
While Forex traders have identified numerous triangle patterns, regardless of their origin and shape or size, most triangle patterns can be grouped into three broader categories:
An ascending triangle pattern consists of a horizontal line on the top of the price action and an ascending trend line. As the name suggests, an ascending triangle pattern is usually a bullish pattern formed during a prolonged uptrend. Usually, the upper resistance level, identified as a horizontal line, breaks and signals the continuation of a bullish trend.
Once the price has broken above the upper horizontal resistance, the initial profit target for the trade should be set at a height equal to the size of the triangle. It is the distance between the horizontal line and the leftmost point of the ascending trend line.
Let’s take a look at an example trade on GBPUSD hourly chart to elaborate the concept in detail.
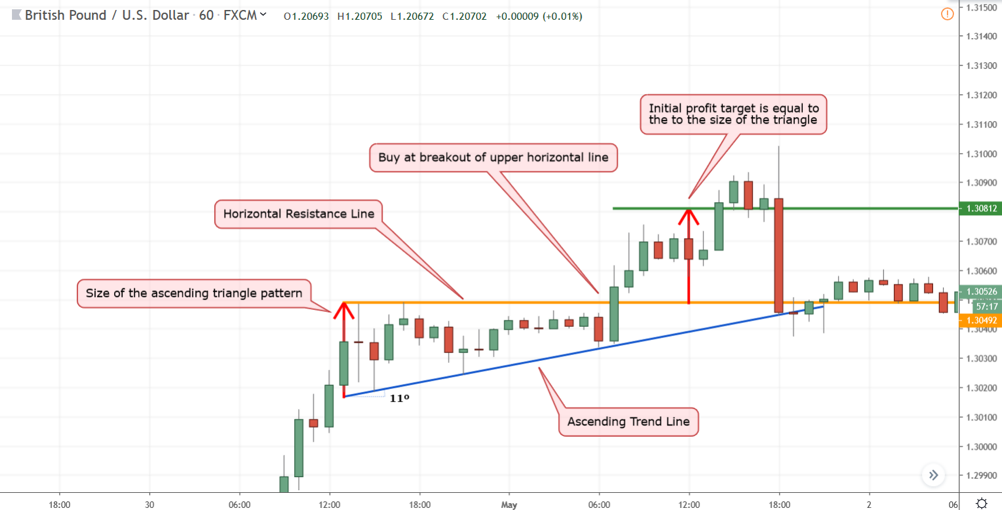
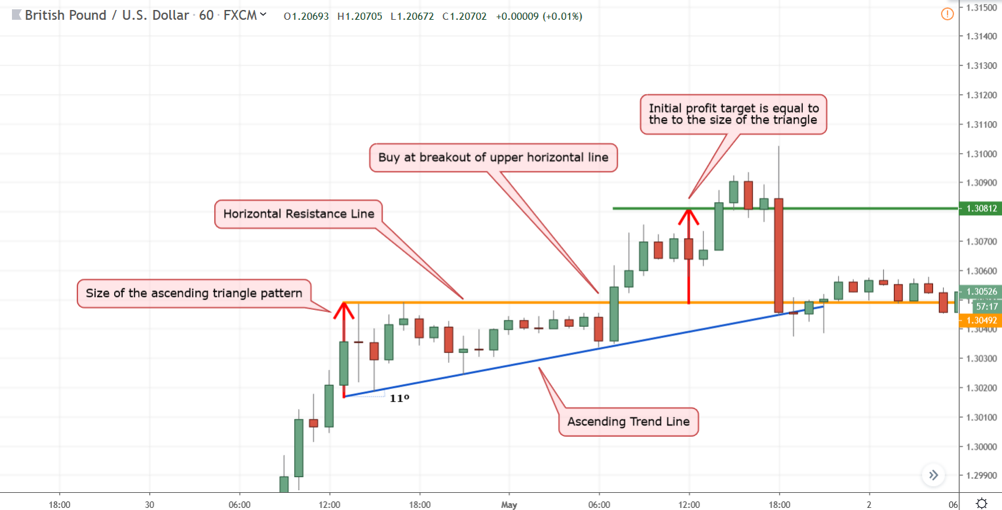
Figure 3: Trading Ascending Triangle Pattern on the GBPUSD Hourly Chart
In figure 3, we can see that the GBPUSD had a fairly good bullish run, then the uptrend found a strong resistance near the 1.3049 level (orange line). After two tries, the price started ranging. However, instead of ranging between a horizontal resistance and a horizontal support levels, price action continued to show a bullish pressure in the market as demonstrated by the formation of the ascending trend line (blue line).
After several hours of range-bound price action, the GBPUSD bulls finally pushed the price above the horizontal resistance level with a clear break on the hourly chart. At this point, you should have entered the market with a buy order.
If you are an aggressive trader, you can simply place a Pending Stop order above the 1.3049 level to trigger your trade. However, professional traders know better that there could be false breakouts and they usually wait for the bar to close above the horizontal line before entering the market.
Nonetheless, once the trade is triggered, the initial profit target was set to be equal to the size of the ascending triangle pattern, as demonstrated by the two upward-pointing arrows (red). Here, the Stop Loss should be just below the ascending trend line of the bar that broke the triangle.
As you can see in figure 3, soon after the price broke above the horizontal resistance level, it reached the profit target in no time.
As you can guess by now, a descending triangle pattern is just like the opposite of an ascending triangle pattern. It is made out of a horizontal line at the bottom end of the price action and a descending trend line. A descending triangle pattern is usually considered to be a bearish trend continuation pattern formed during a prolonged downtrend. The way to trade a descending triangle pattern is you wait for the lower support level to break. This occurrence signals the continuation of the prevailing bearish trend.
Once the price has broken below the lower horizontal support, the initial profit target for the trade should be set at a height equal to the size of the triangle. Just like trading an ascending triangle pattern, it is usually the distance between the horizontal line and the leftmost point of the descending trend line.
In the following example, we will take a look at an example trade on the USDCHF hourly chart to elaborate the how to trade a descending triangle pattern.
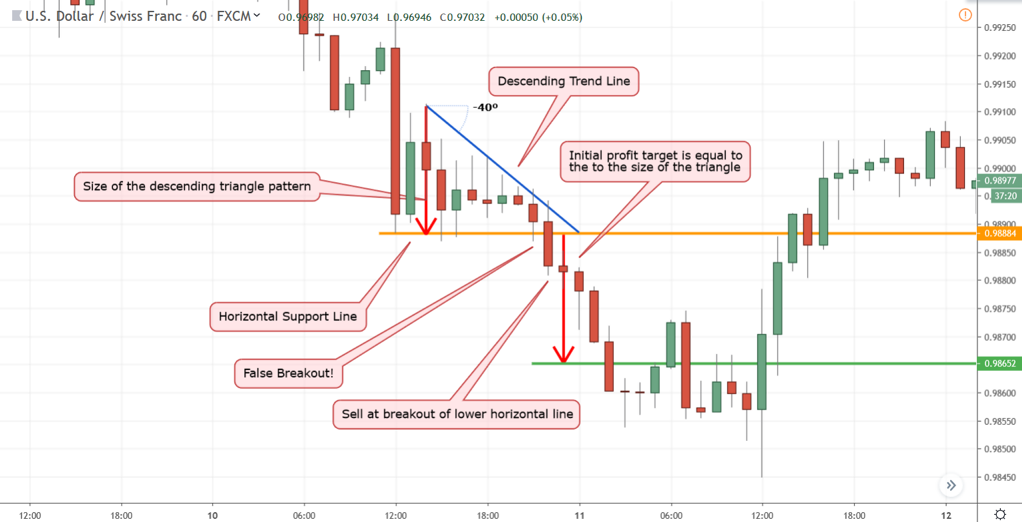
Figure 4: Trading Descending Triangle Pattern on the USDCHF Hourly Chart
In figure 4, we can see that the USDCHF was trending downwards. However, soon after the formation of a large bearish bar, the downtrend found strong support near the 0.9888 level (orange line). After several tries, the price started ranging. However, it ranged between a descending trend line (blue) and horizontal support levels (orange). Nonetheless, the price action continued to show a bearish pressure in the market as demonstrated by the formation of the descending trend line (blue line).
After several hours of range-bound price action, the USDCHF bears finally pushed the price below the horizontal support level. But, prior to that, it had a false breakout where price penetrated below the support but failed to close below it. This is why we discussed by professional traders do not simply place Stop orders to enter the market, but wait for the bar to close while trading breakouts.
Nonetheless, the next bear had a clear break on the hourly chart. At this point, you should have entered the market with a sell order. Here, the Stop Loss should be just above the descending trend line of the bar that broke the triangle.
Once the trade is open, the initial profit target was set to be equal to the size of the descending triangle pattern. As you can see in figure 4, the USDCHF trade easily reached the profit target within a few hours of the breakout.
Unlike an ascending or the descending triangle pattern, a symmetrical triangle pattern has no horizontal support or resistance lines. Instead, a symmetrical triangle pattern is made out of an ascending and a descending trend line that intersects each other at some point.
There is no established directional bias when trading a symmetrical triangle pattern as a break above the downtrend line could signal the start of a bullish trend. By contrast, a break below the uptrend line could signal a bearish trend.
However, the profit target, regardless of which way the trend has broken, will always be equal to the size of the triangle in question – just like the other two triangle pattern.
Let’s take a look at an example trade on the AUDCAD hourly chart to see how to trade a symmetrical triangle pattern.
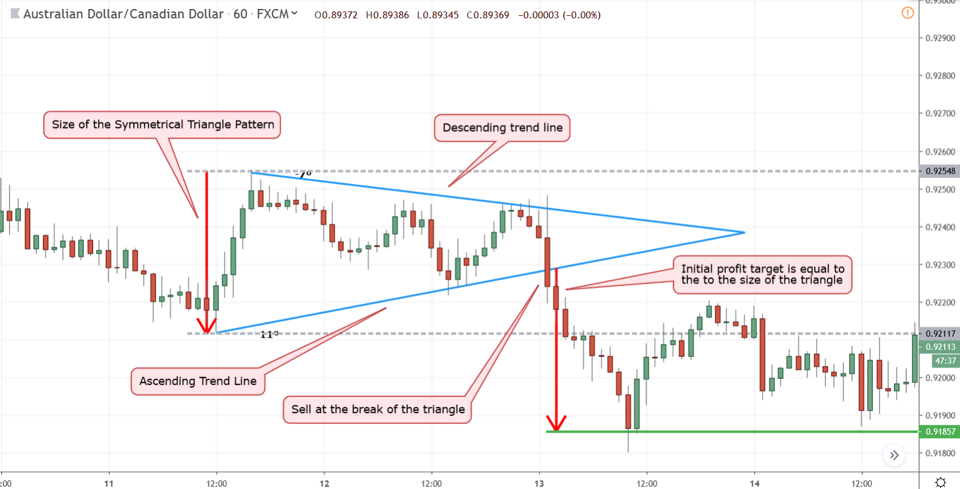
Figure 5: Trading Symmetrical Triangle Pattern on the AUDCAD Hourly Chart
In figure 5, we can see the formation of a symmetrical triangle pattern, as evident by the intersection between the uptrend line and the downtrend line (both are blue). While there was a false breakout on the upside, eventually the bar turned back and closed below the ascending (uptrend) line, generating a signal that a new bearish trend will likely take place.
At this point, you would have entered the market with a sell order. Similar to trading the ascending and descending triangle patterns, the initial profit target of the trade would be equal to the size of the symmetrical triangle patterns. Here, the Stop Loss should be just above the ascending trend line (opposite side) of the bar that broke the triangle.
As you can see in figure 5, the AUDCAD trade reached the profit target within the next several hours. Furthermore, as soon as it reached the profit target, the downtrend literally ended, and the market started ranging.
While a clear breakout of the triangles is the established way to trade these patterns, some aggressive traders try to maximize their reward to risk ratio of the trade by preemptively entering the market at the opposite end of the triangles. For example, if your trading system is signaling that a triangle will break below, you can try to enter the market near the upper trend line, hoping that a break will yield higher profits and vice versa. However, unless you have ample experience trading triangles, try to refrain from applying such an aggressive strategy.
While you can trade various triangle patterns discussed in this article as a standalone system, it works best in combination with other technical strategies. In fact, integrating triangle patterns is a great way to improve the accuracy of any trading system.
If you are new to trading, you can also use built-in tools found in a lot of charting software that can easily help you identify triangles. However, as the proverb goes, practice makes perfect and the more you try to trade on your own, the better you will eventually become at identifying and trading these patterns.

We have been trading supply and demand strategies for over ten years, and they have stood the test of time remarkably well. Supply and demand is...

3 min read
Choosing the right trading journal is essential for traders wanting to analyze performance, refine strategies, and improve consistency. In this...

3 min read
“95% of all traders fail” is the most commonly used trading related statistic around the internet. But no research paper exists that proves this...