Supply and Demand Trading in 2026
We have been trading supply and demand strategies for over ten years, and they have stood the test of time remarkably well. Supply and demand is...
Trendline channel patterns are a staple in technical analysis, helping traders to identify potential trade opportunities by charting trends within defined boundaries. These channels provide insight into market trends, offering strategic entry and exit points for traders. In this guide, we’ll explore how to identify, trade, and optimize the trendline channel pattern to improve your trading strategy.
By the end of this guide, you’ll have a solid understanding of how to trade channel patterns, recognize different types, and implement practical techniques to maximize your trading success.
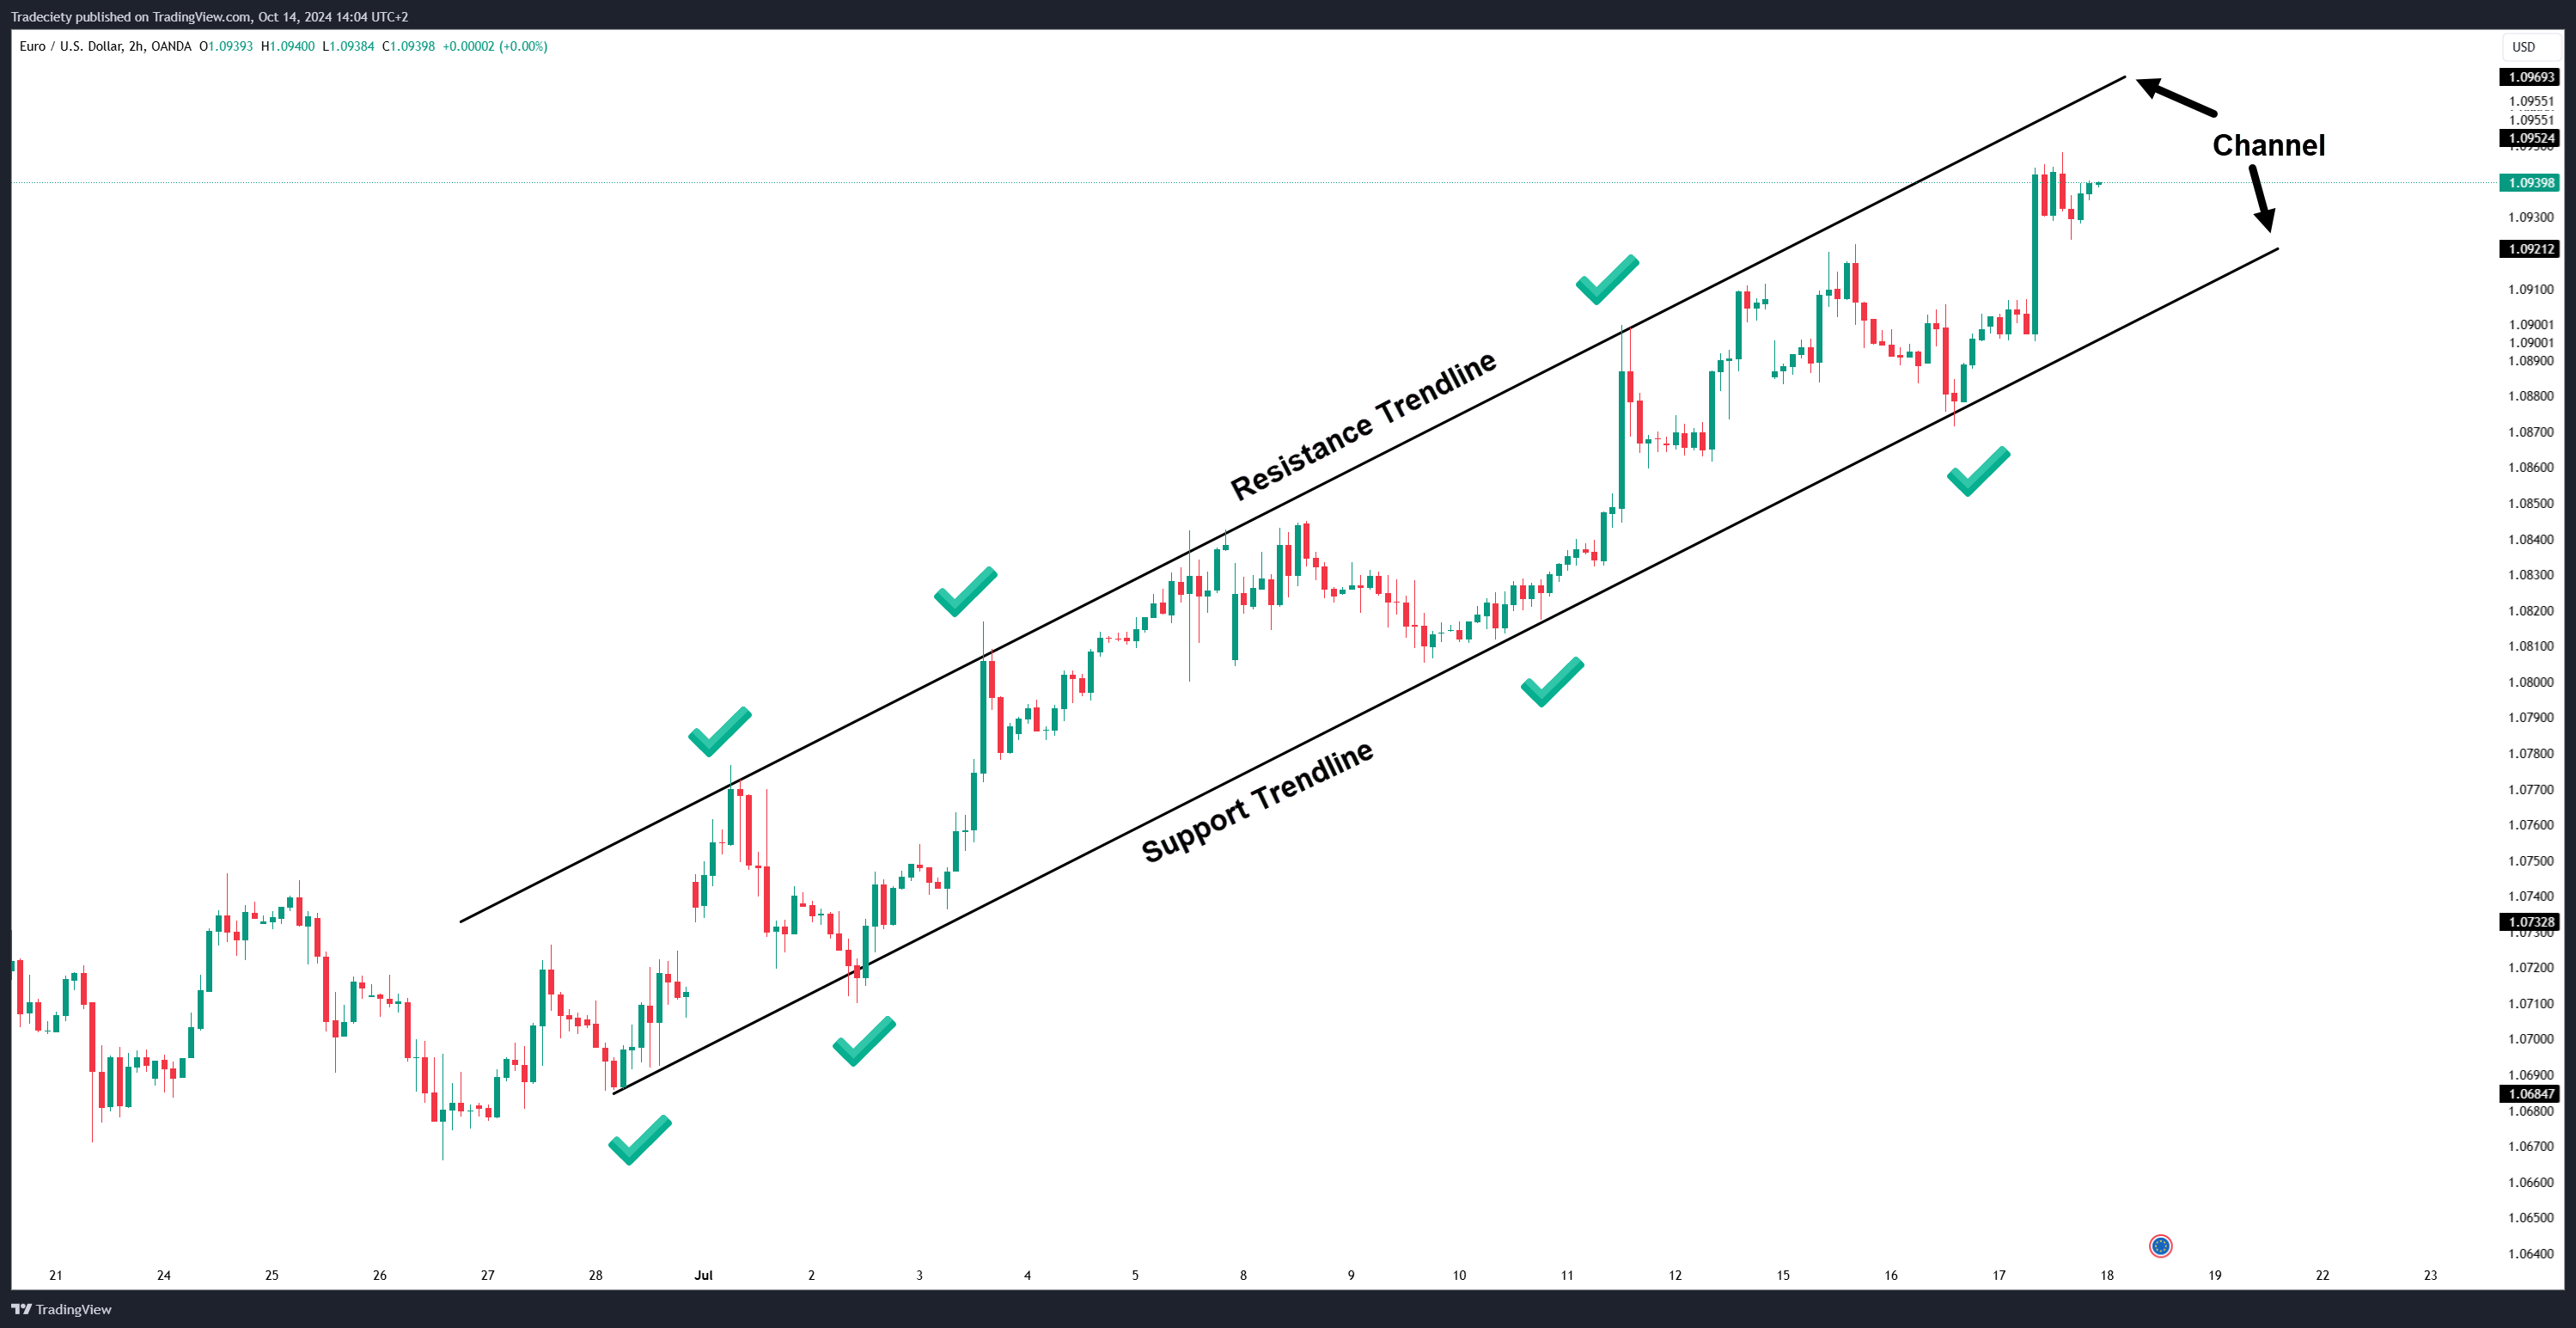
A trendline channel pattern is formed by two parallel trendlines that encapsulate price movement within a market. These lines represent support and resistance levels, which mark the highs and lows that price consistently respects over a given period.
The lower trendline acts as support, indicating a price level where buying pressure tends to prevent further declines.
The upper trendline functions as resistance, marking a price ceiling where selling pressure typically prevents further gains.
For a channel to be valid, the price must touch each line at least twice, creating a visually discernible pattern. The parallel nature of these lines helps traders to predict future price movements and identify potential trading opportunities.
Trendline channels can be categorized into three main types:
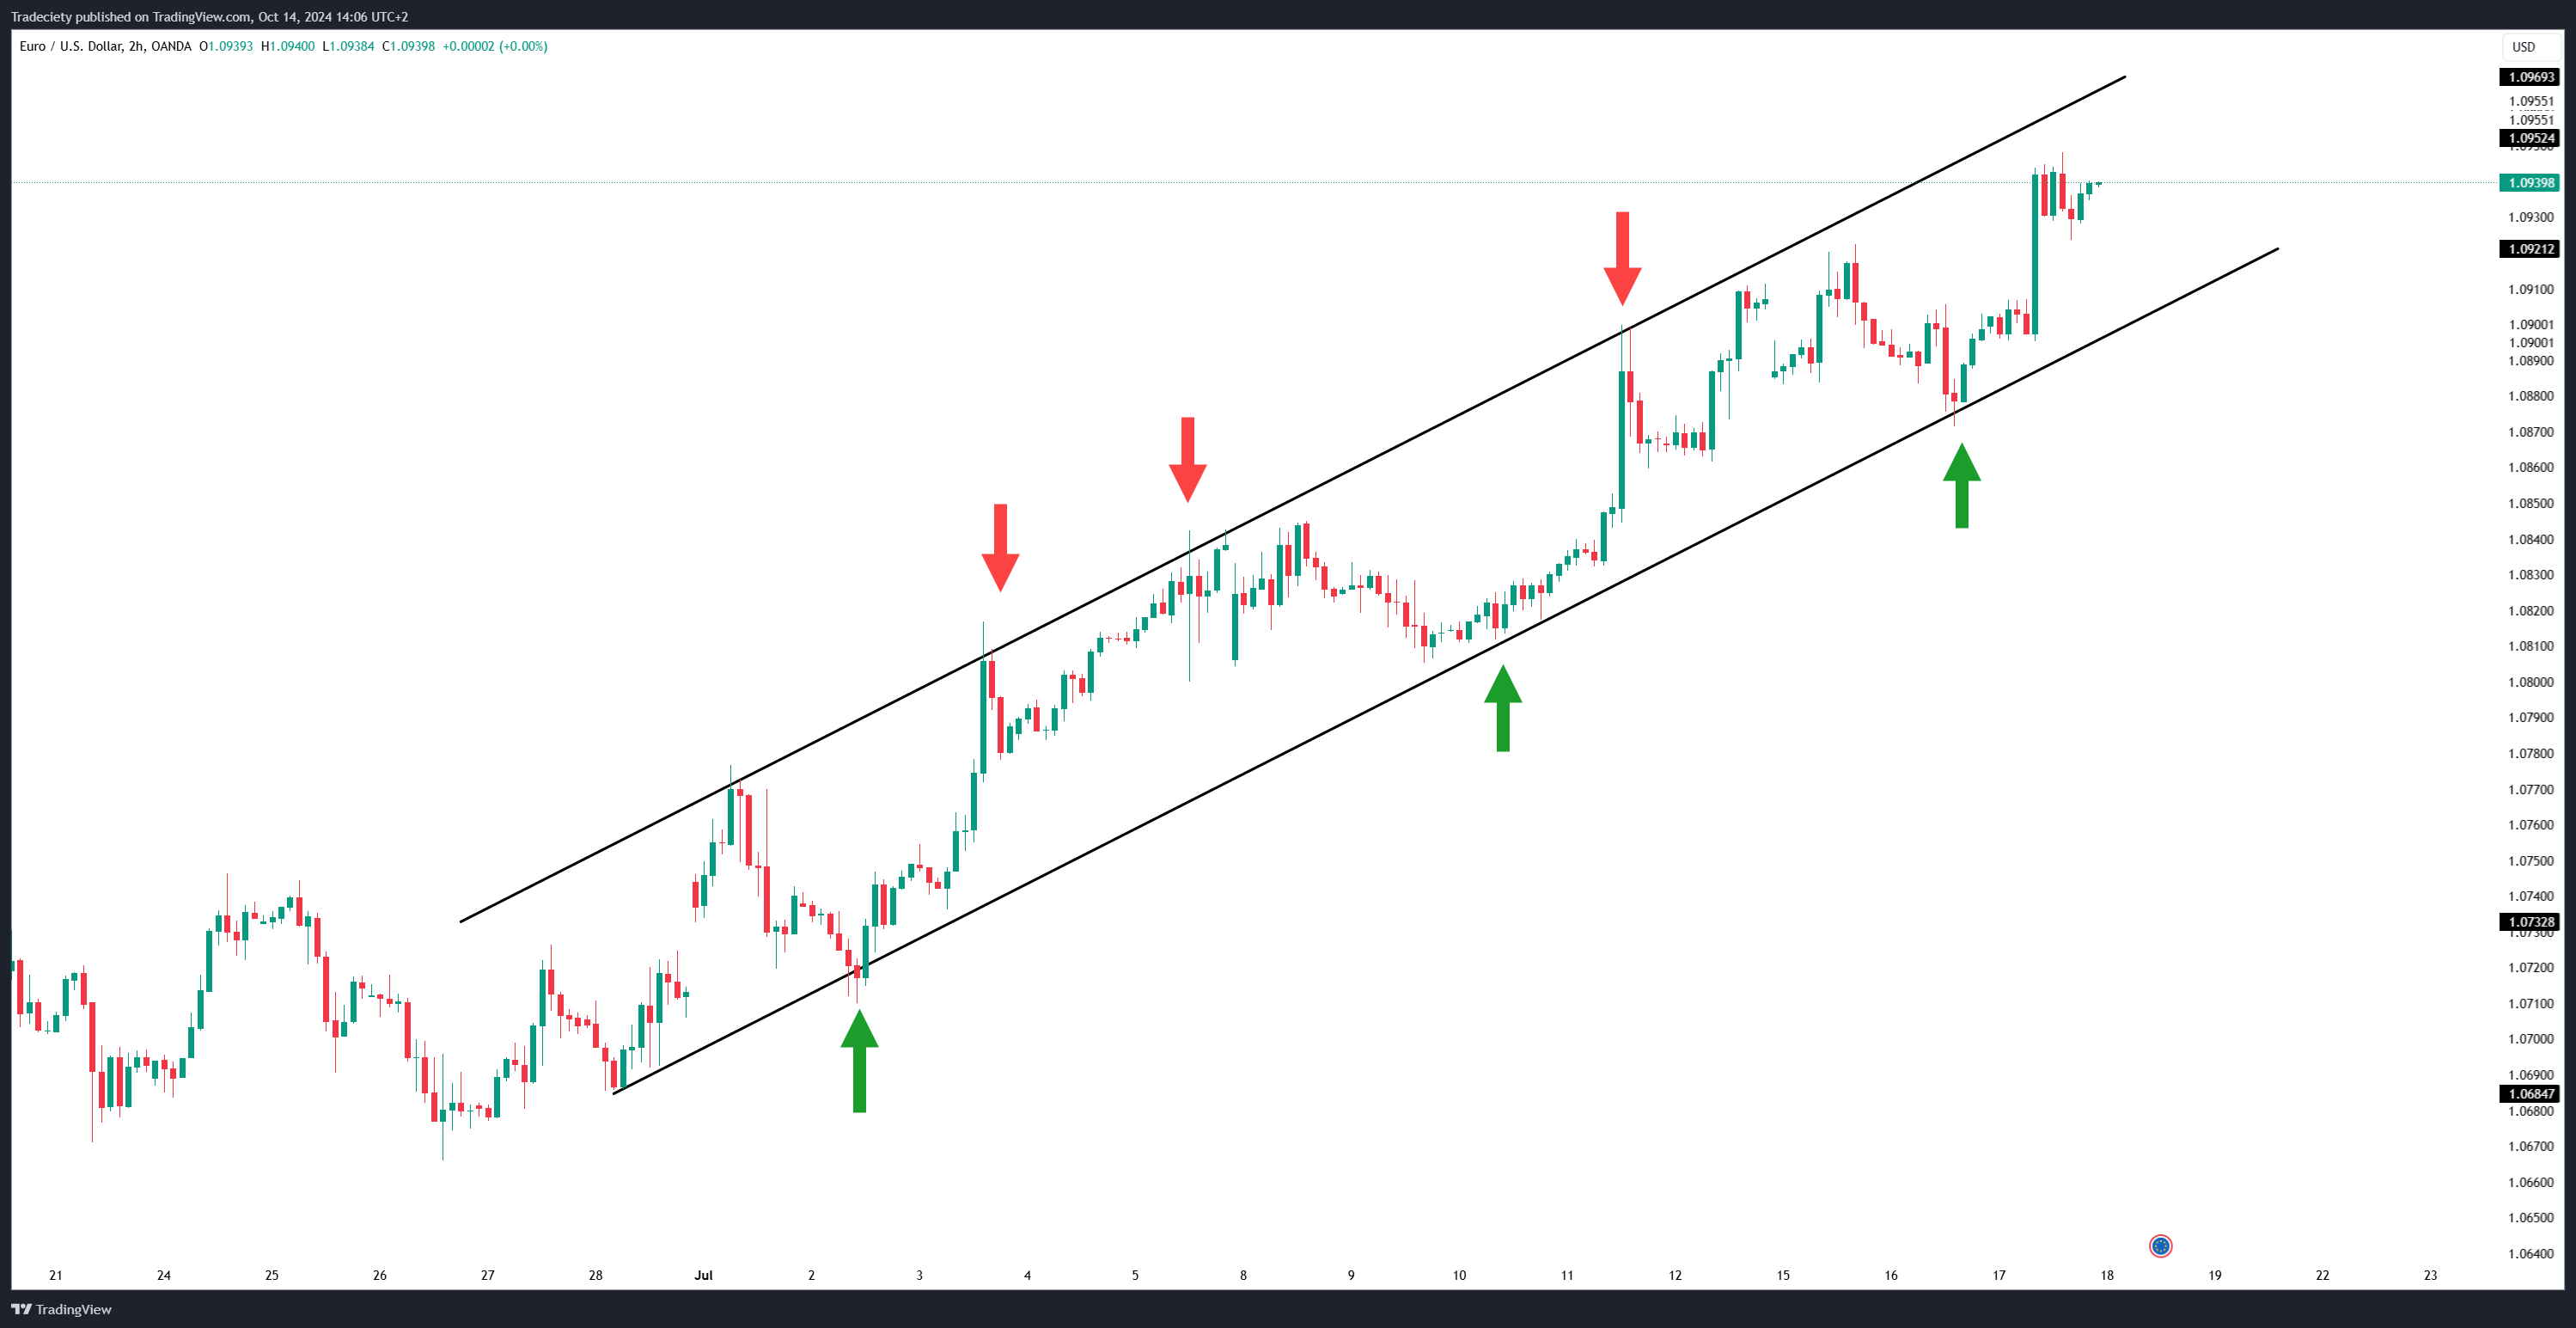
Ascending Channel (Bullish Pattern):
In an ascending channel, the price moves upwards within the channel, indicating a bullish trend. Both the support and resistance lines slope upwards. Traders often look for buying opportunities at the lower boundary (support) and take profits near the upper boundary (resistance).
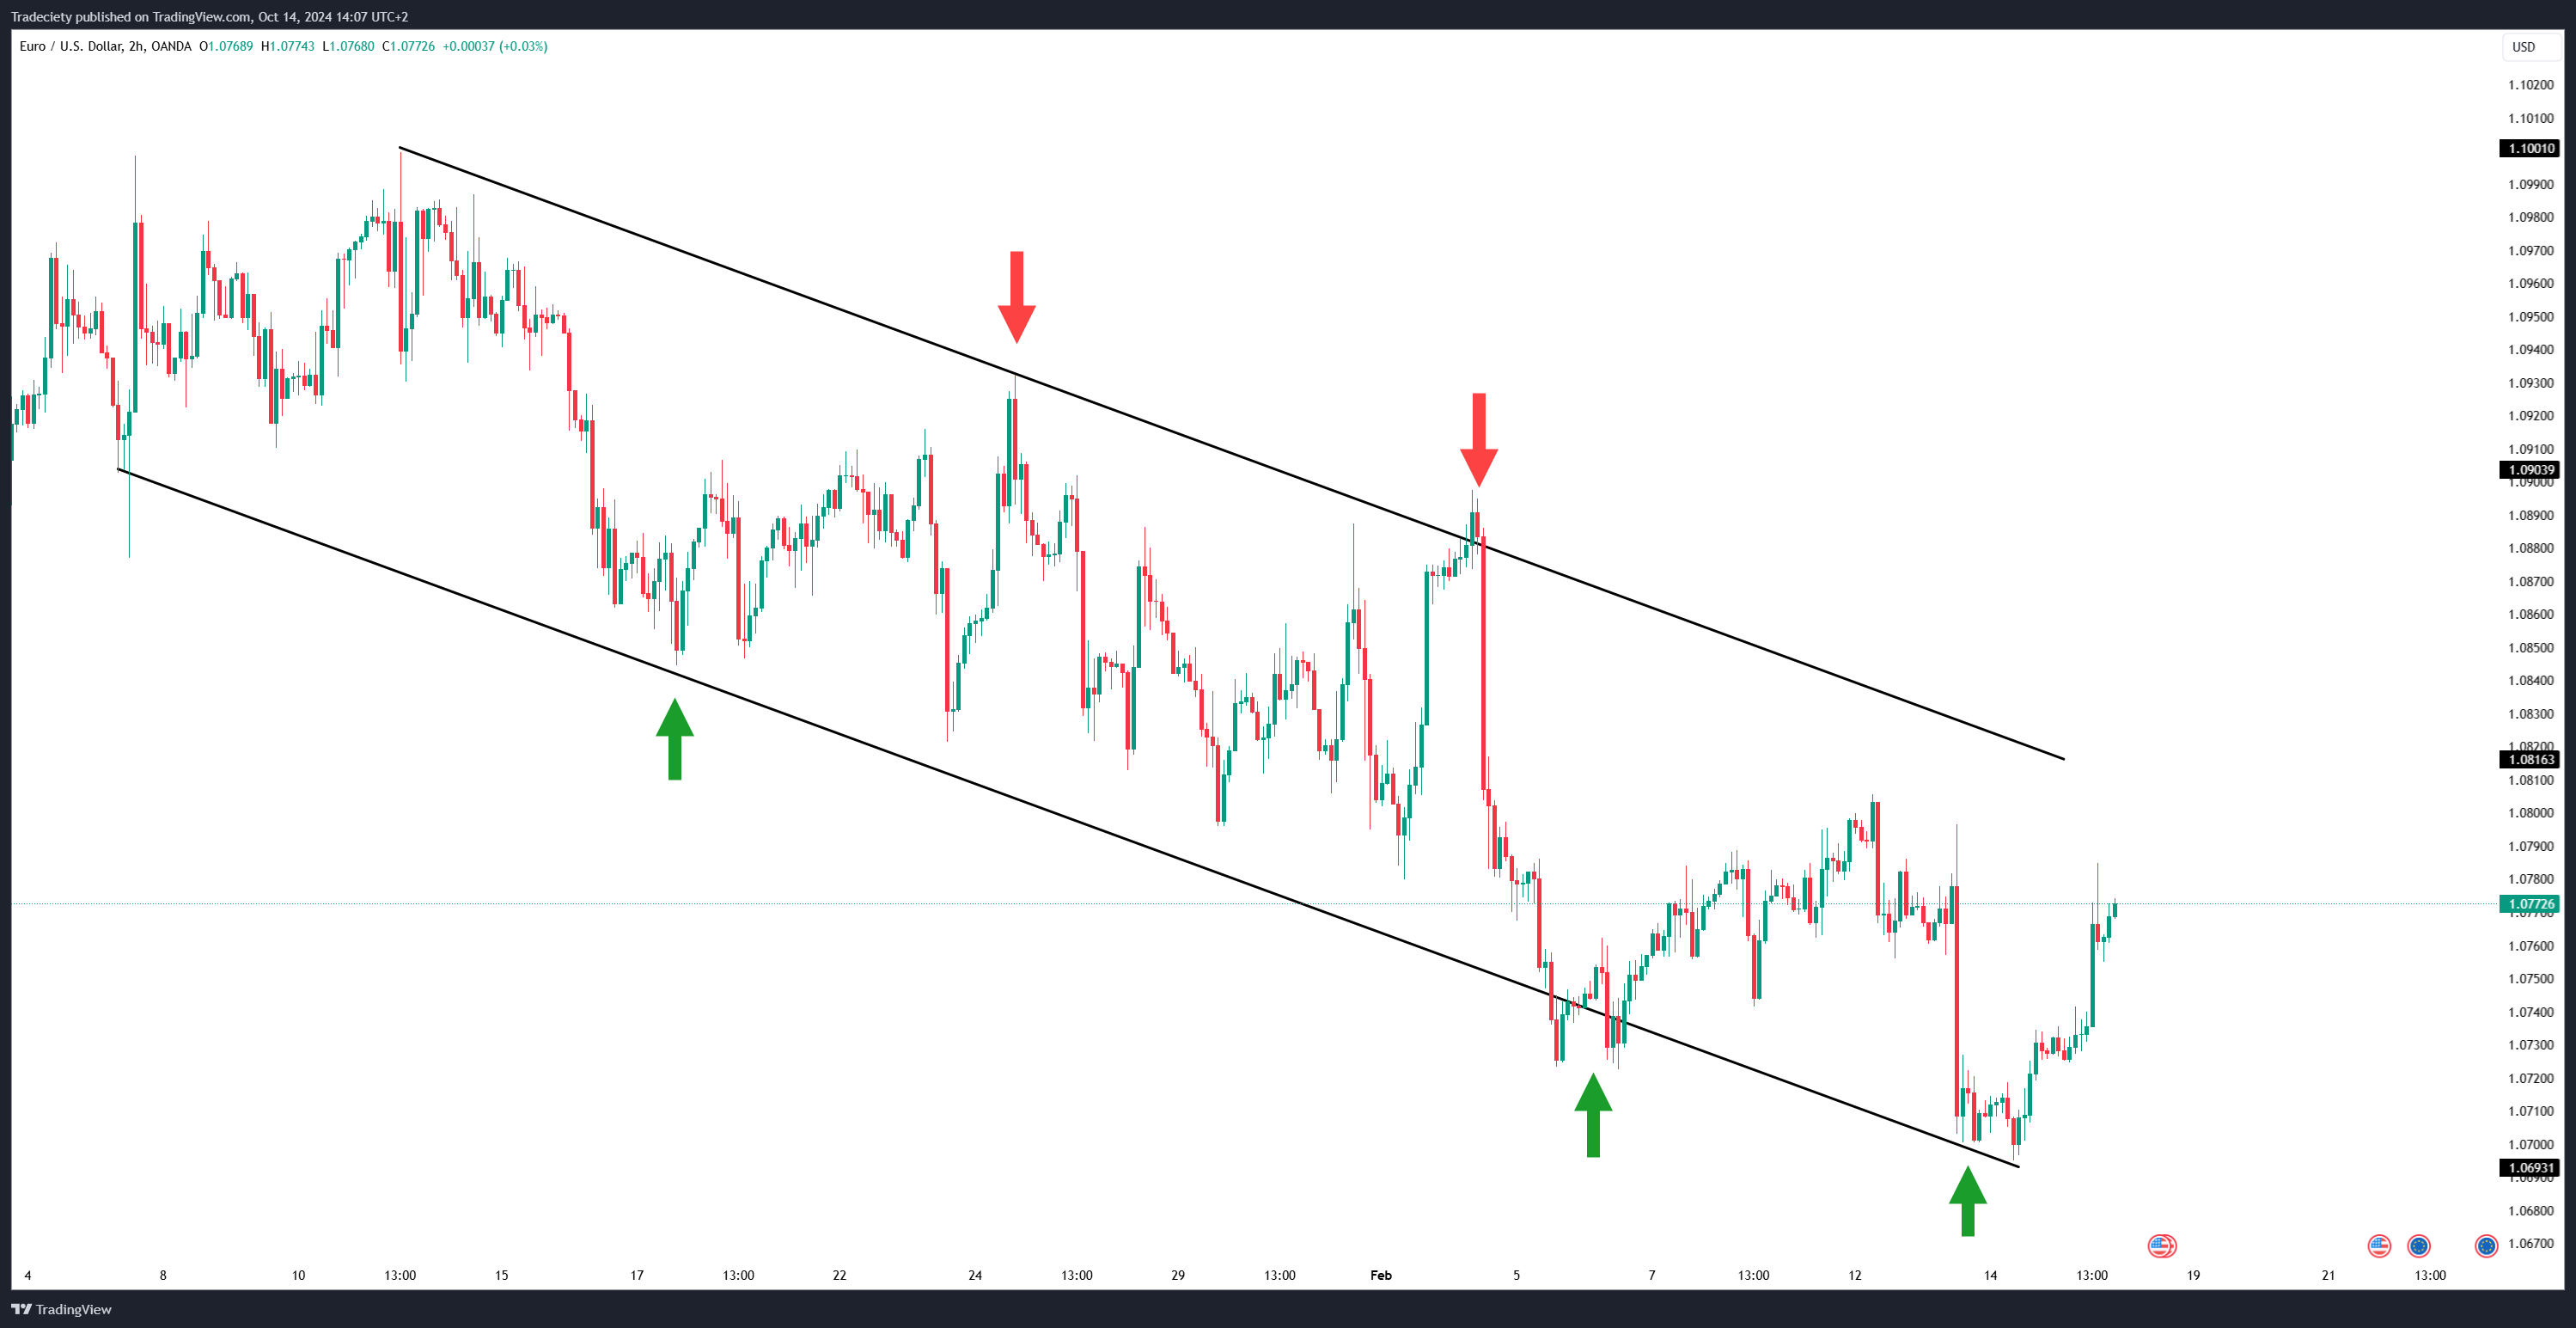
Descending Channel (Bearish Pattern):
A descending channel reflects a bearish trend, where the price moves downward. Both support and resistance lines slope downwards. Traders can profit by selling near the upper boundary (resistance) and buying back near the lower boundary (support).
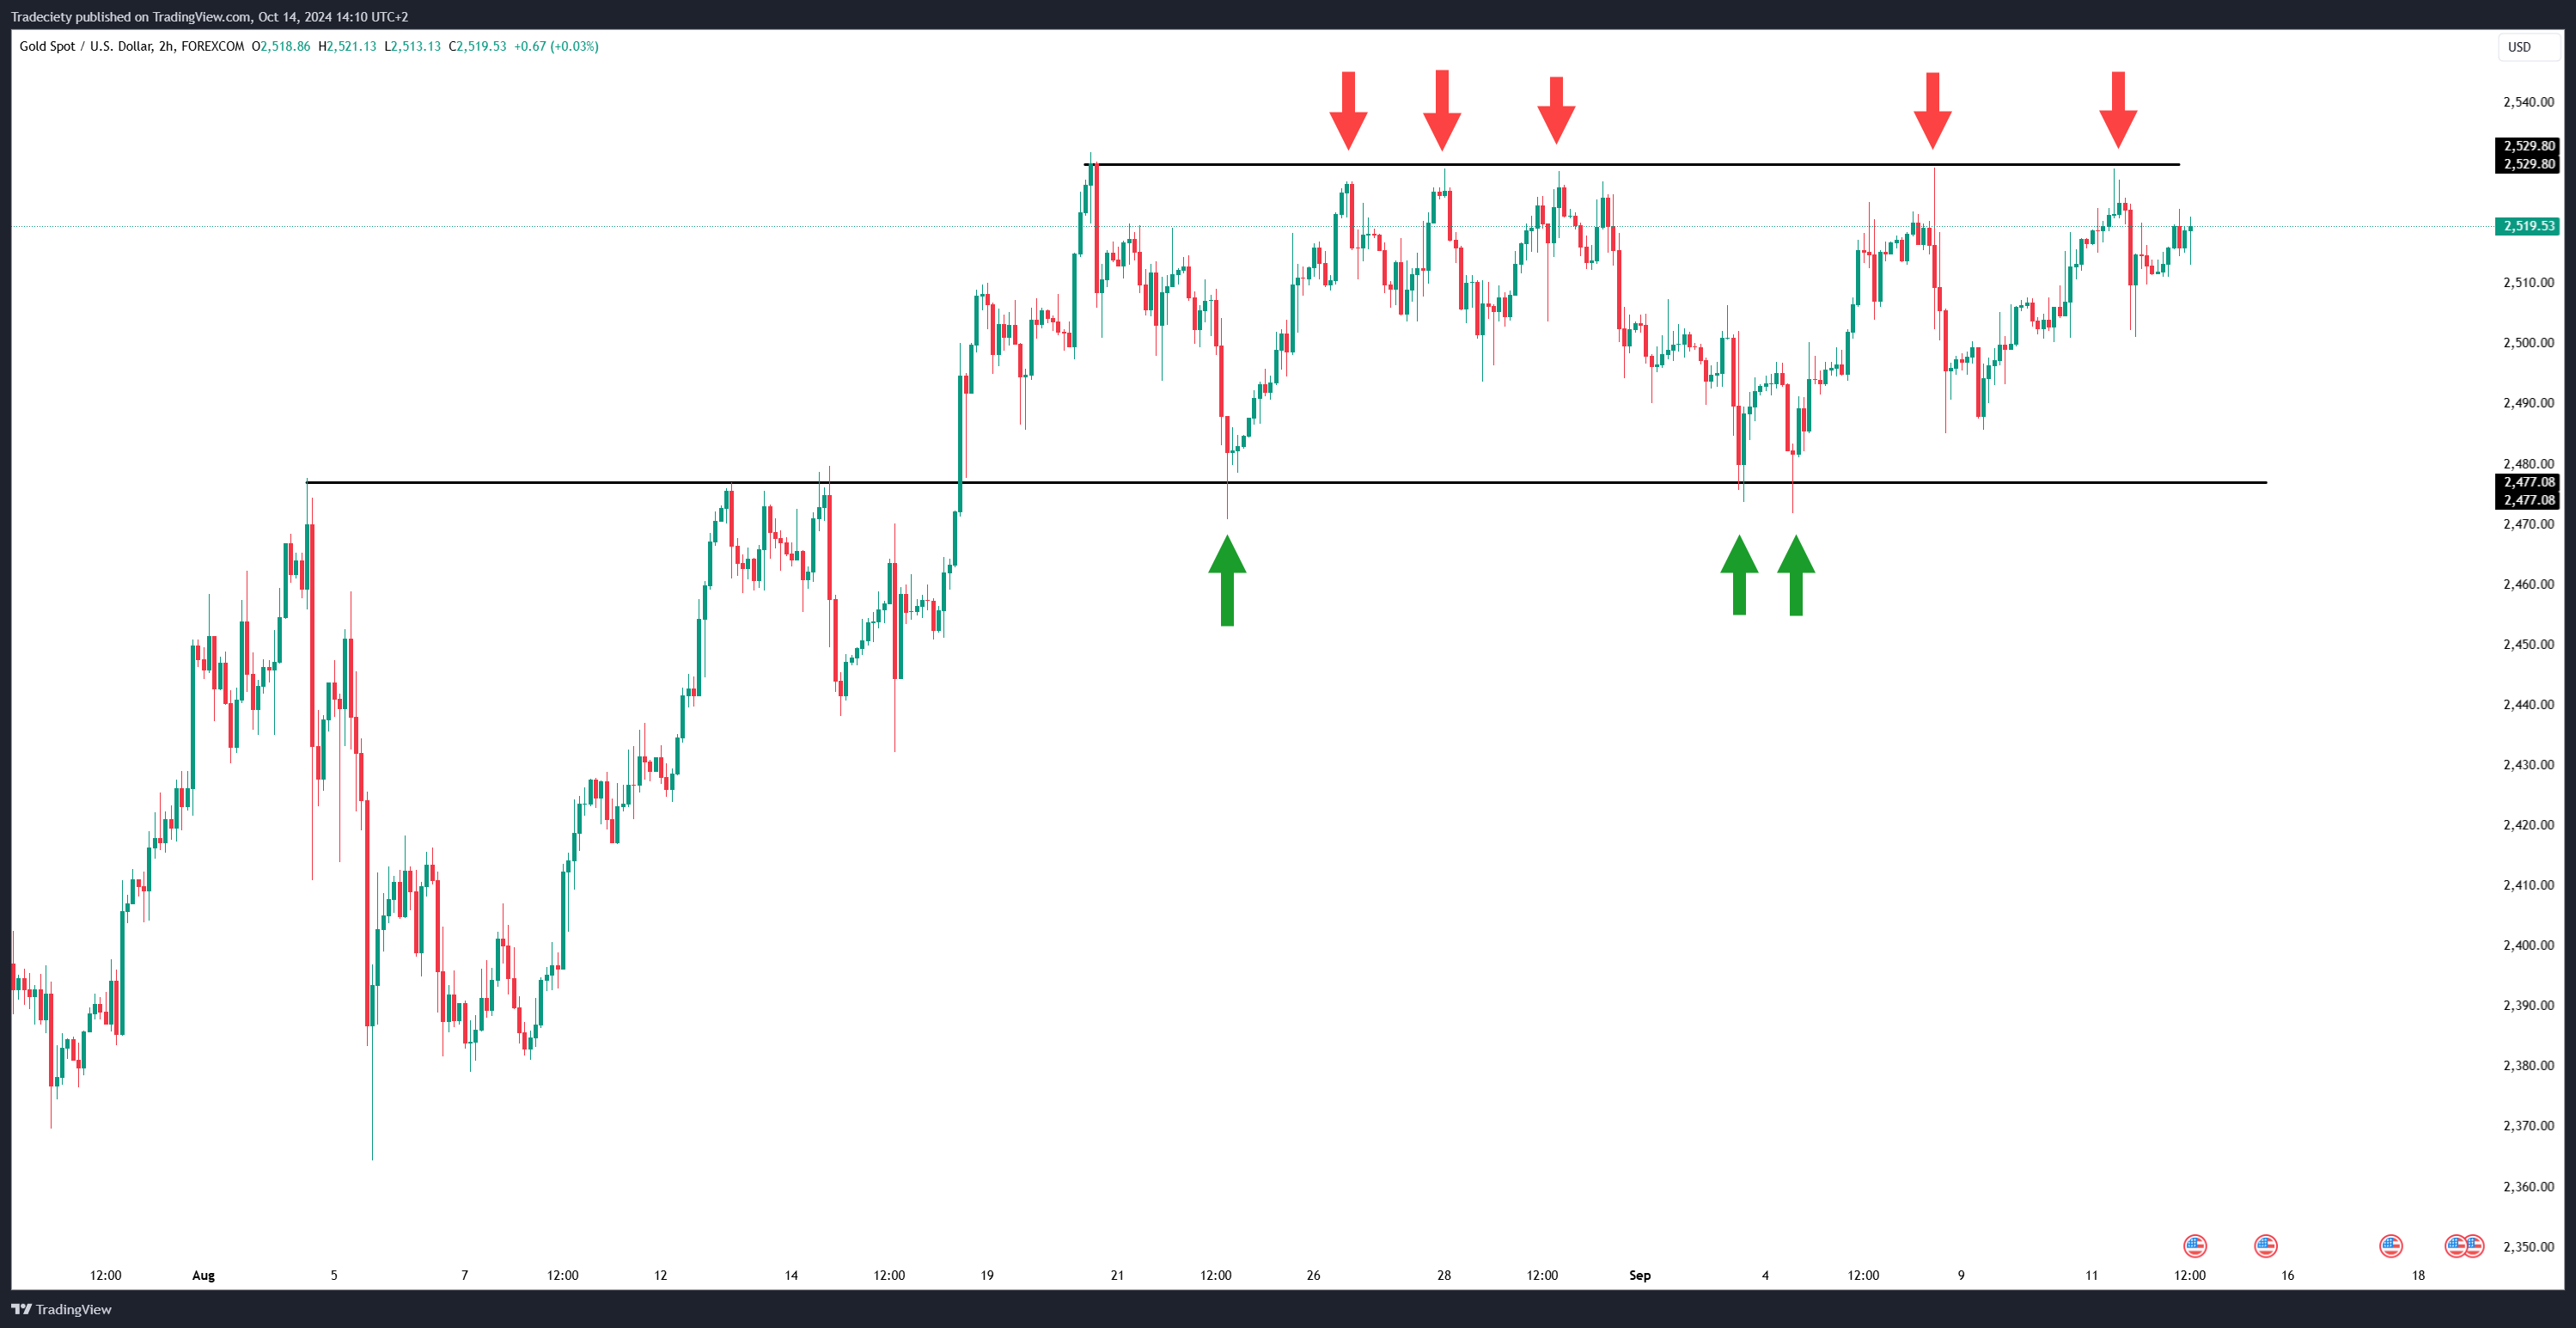
Horizontal Channel (Neutral Pattern):
In a horizontal channel, price moves sideways, with neither an upward nor downward bias. Both support and resistance lines are flat, representing a neutral market. Traders often buy at the lower boundary and sell at the upper boundary, capitalizing on the oscillation within the range.
You may also refer to sideways channels to double tops, or triple tops.
To successfully trade a trendline channel pattern, the first step is accurately drawing the trendlines that mark the channel. Here’s a step-by-step guide:
Identify Swing Highs and Lows:
Start by spotting the key swing highs (peaks) and swing lows (troughs) on your chart. These are critical points where the price reverses direction.
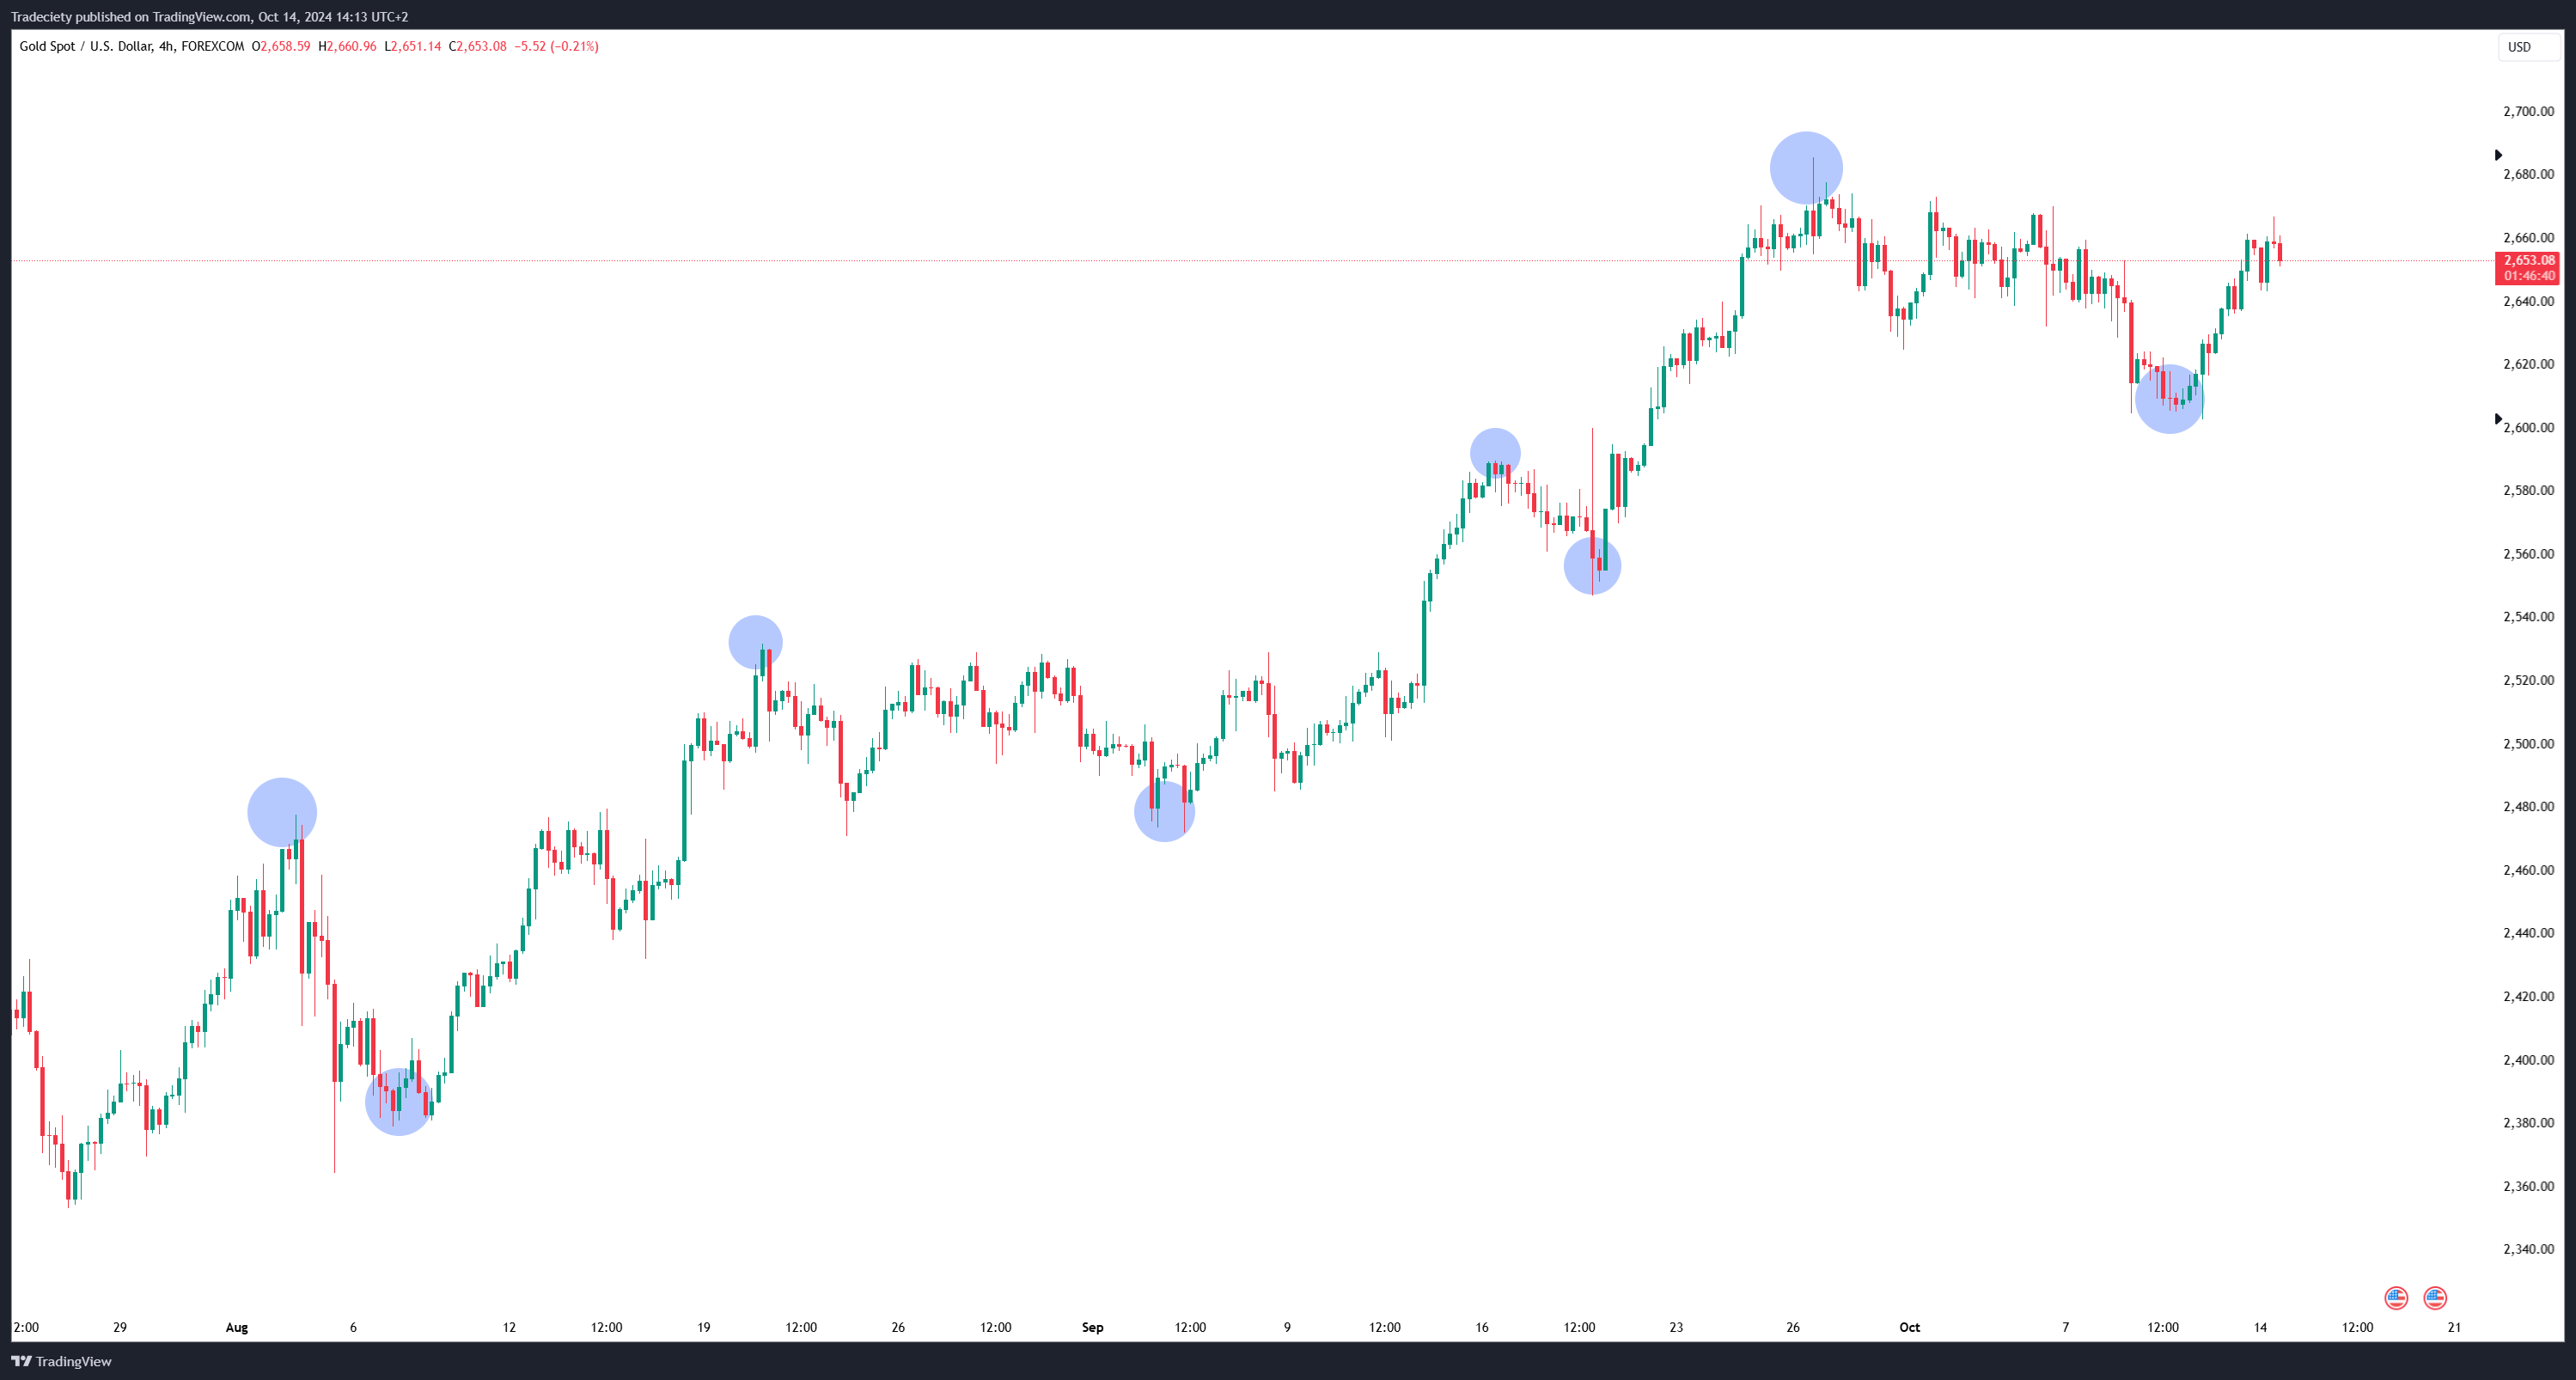
Connect the Lows and Highs:
Draw a line connecting at least two consecutive lows to create the support line, and another connecting at least two highs to form the resistance line. Ensure both lines are parallel, forming the channel.
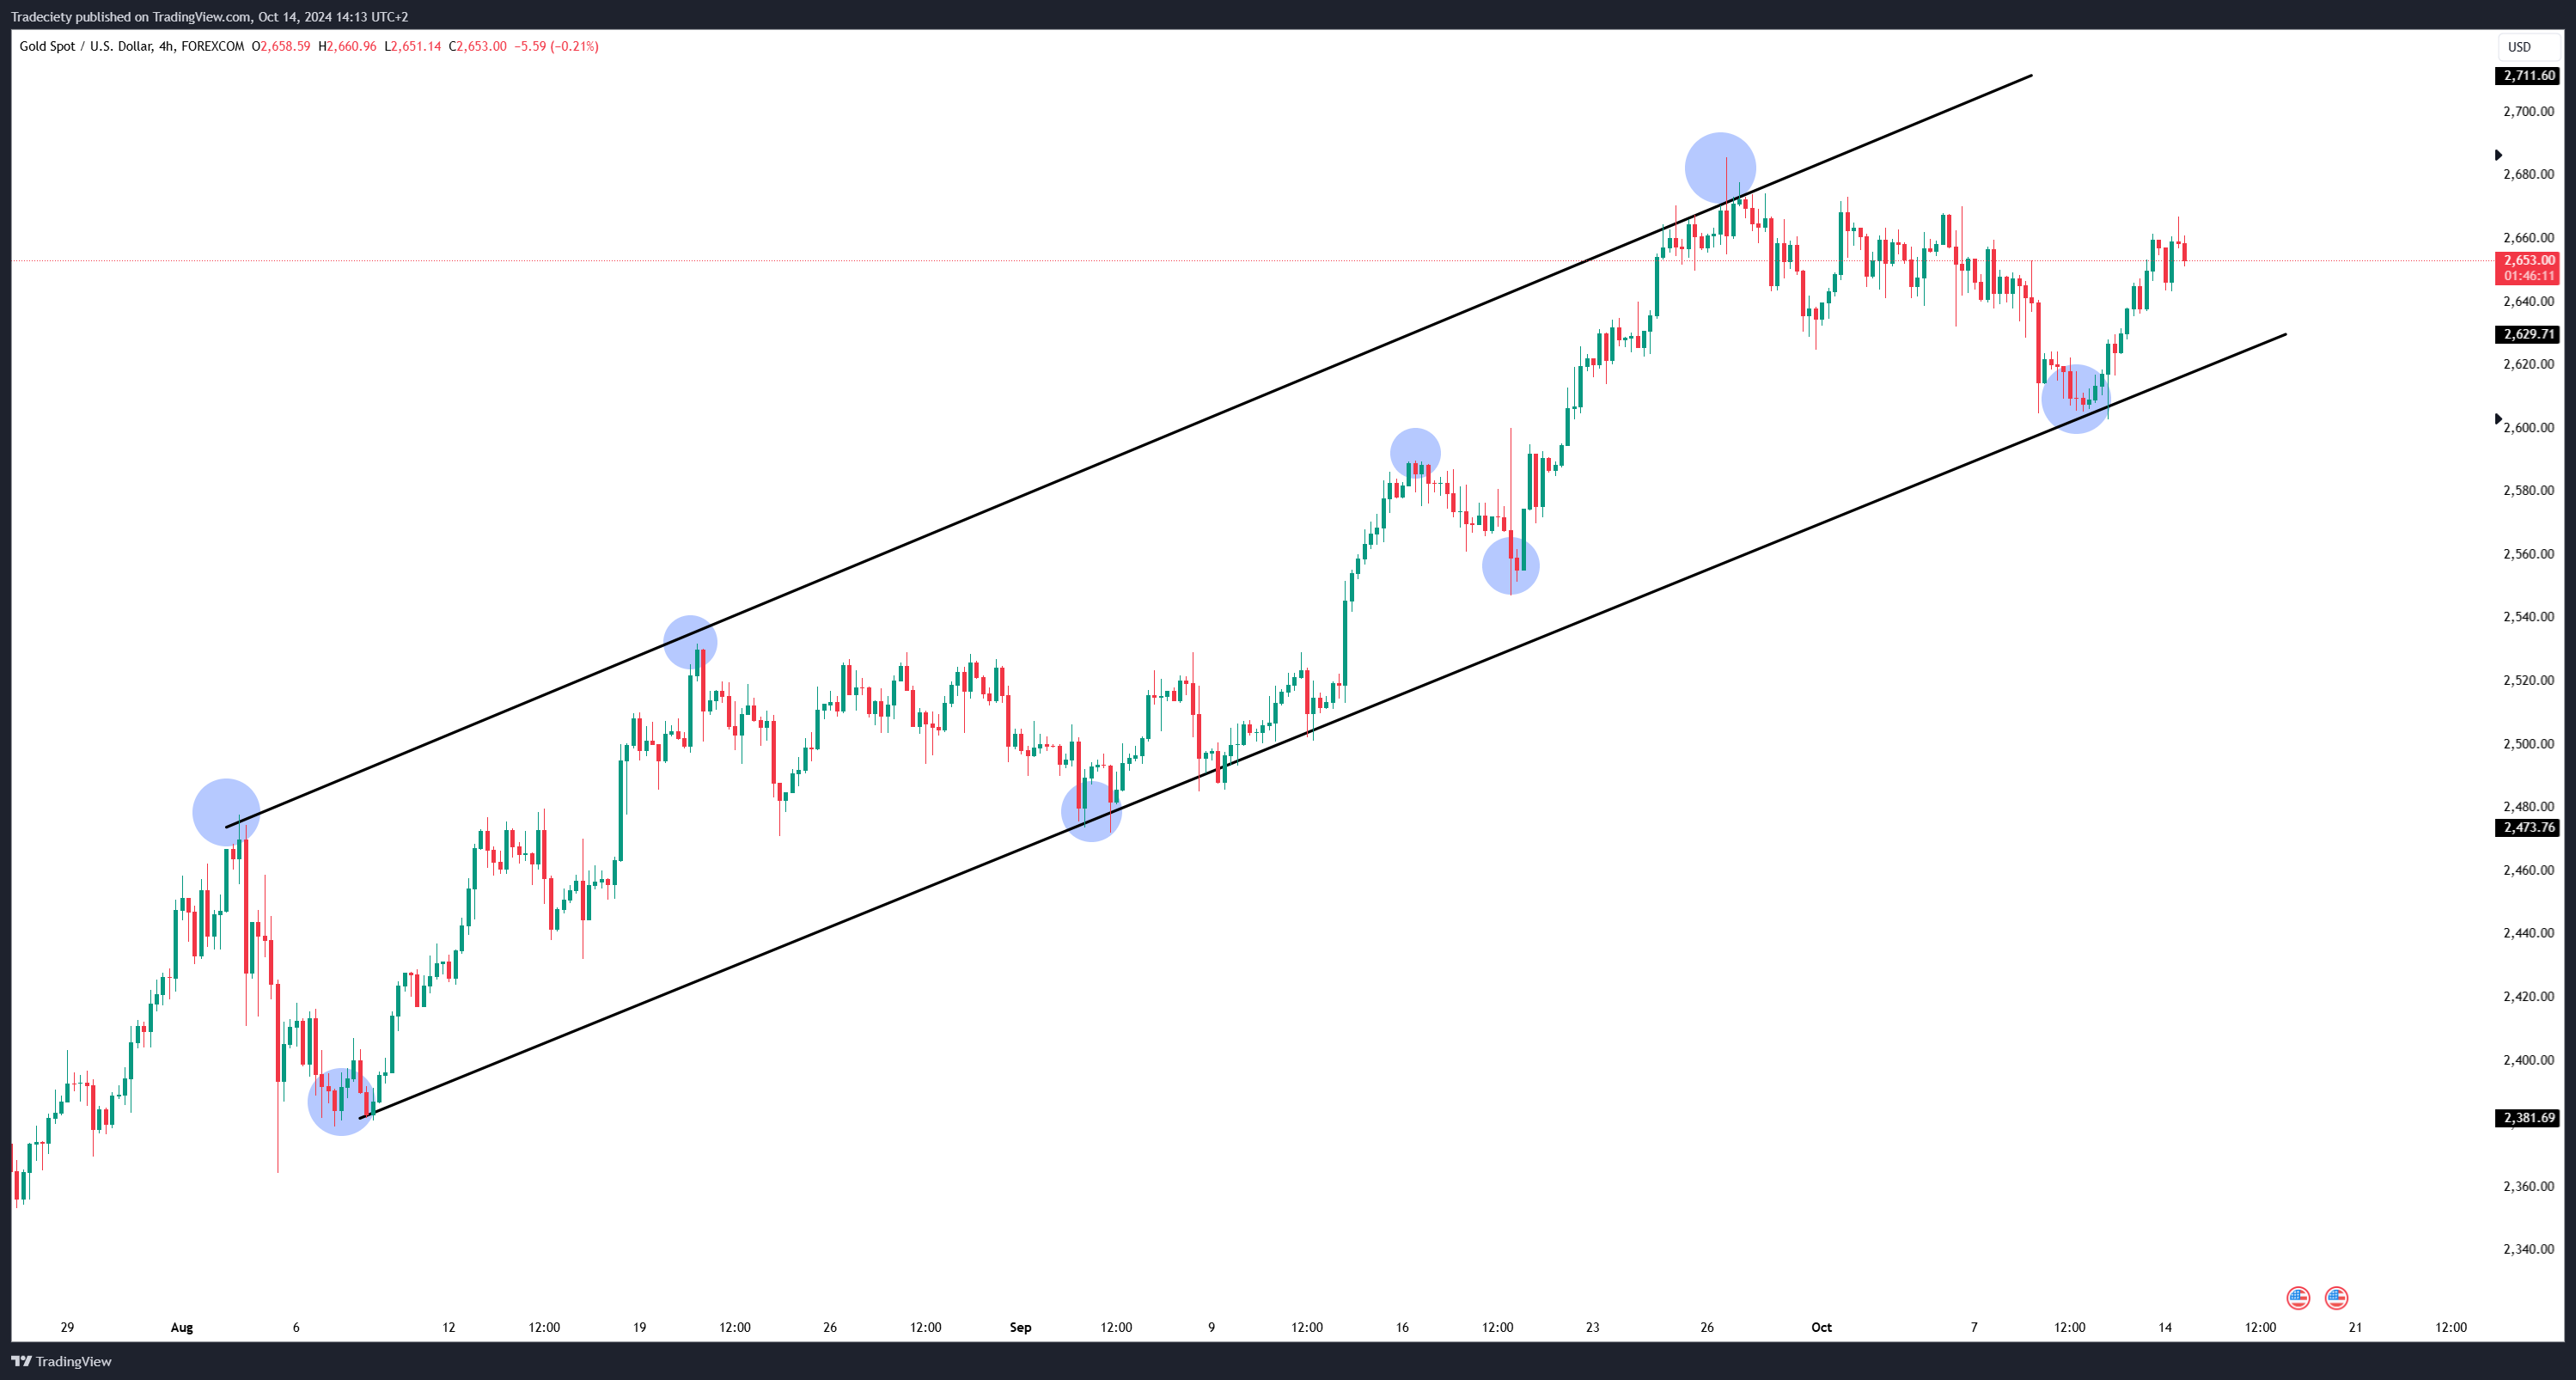
It is ok if trendlines cut through candlestick wicks and even through candlestick bodies at times. However, you do not want to see that the price is able to trade outside of the trendline for too long – when the price is reversing back into the channel quickly, it can be considered a valid trendline and channel. We will talk about trendline fakeouts later.
To confirm the validity of your trendline channel, look for multiple touchpoints—price should hit the support and resistance lines at least twice, creating a consistent pattern. The more touchpoints, the stronger the channel’s reliability.
To avoid trading false channels, follow these rules for confirmation:
Minimum Touches:
A valid trendline channel should have at least two touches on both the support and resistance lines.
Consistent Price Movement:
The price should consistently move between the two lines, respecting the boundaries with limited false breaks.
Timeframes:
Channels can form on various timeframes, from intraday to weekly charts. For short-term traders, daily or 4-hour charts work well, while long-term traders may prefer weekly or monthly charts to confirm broader trends.
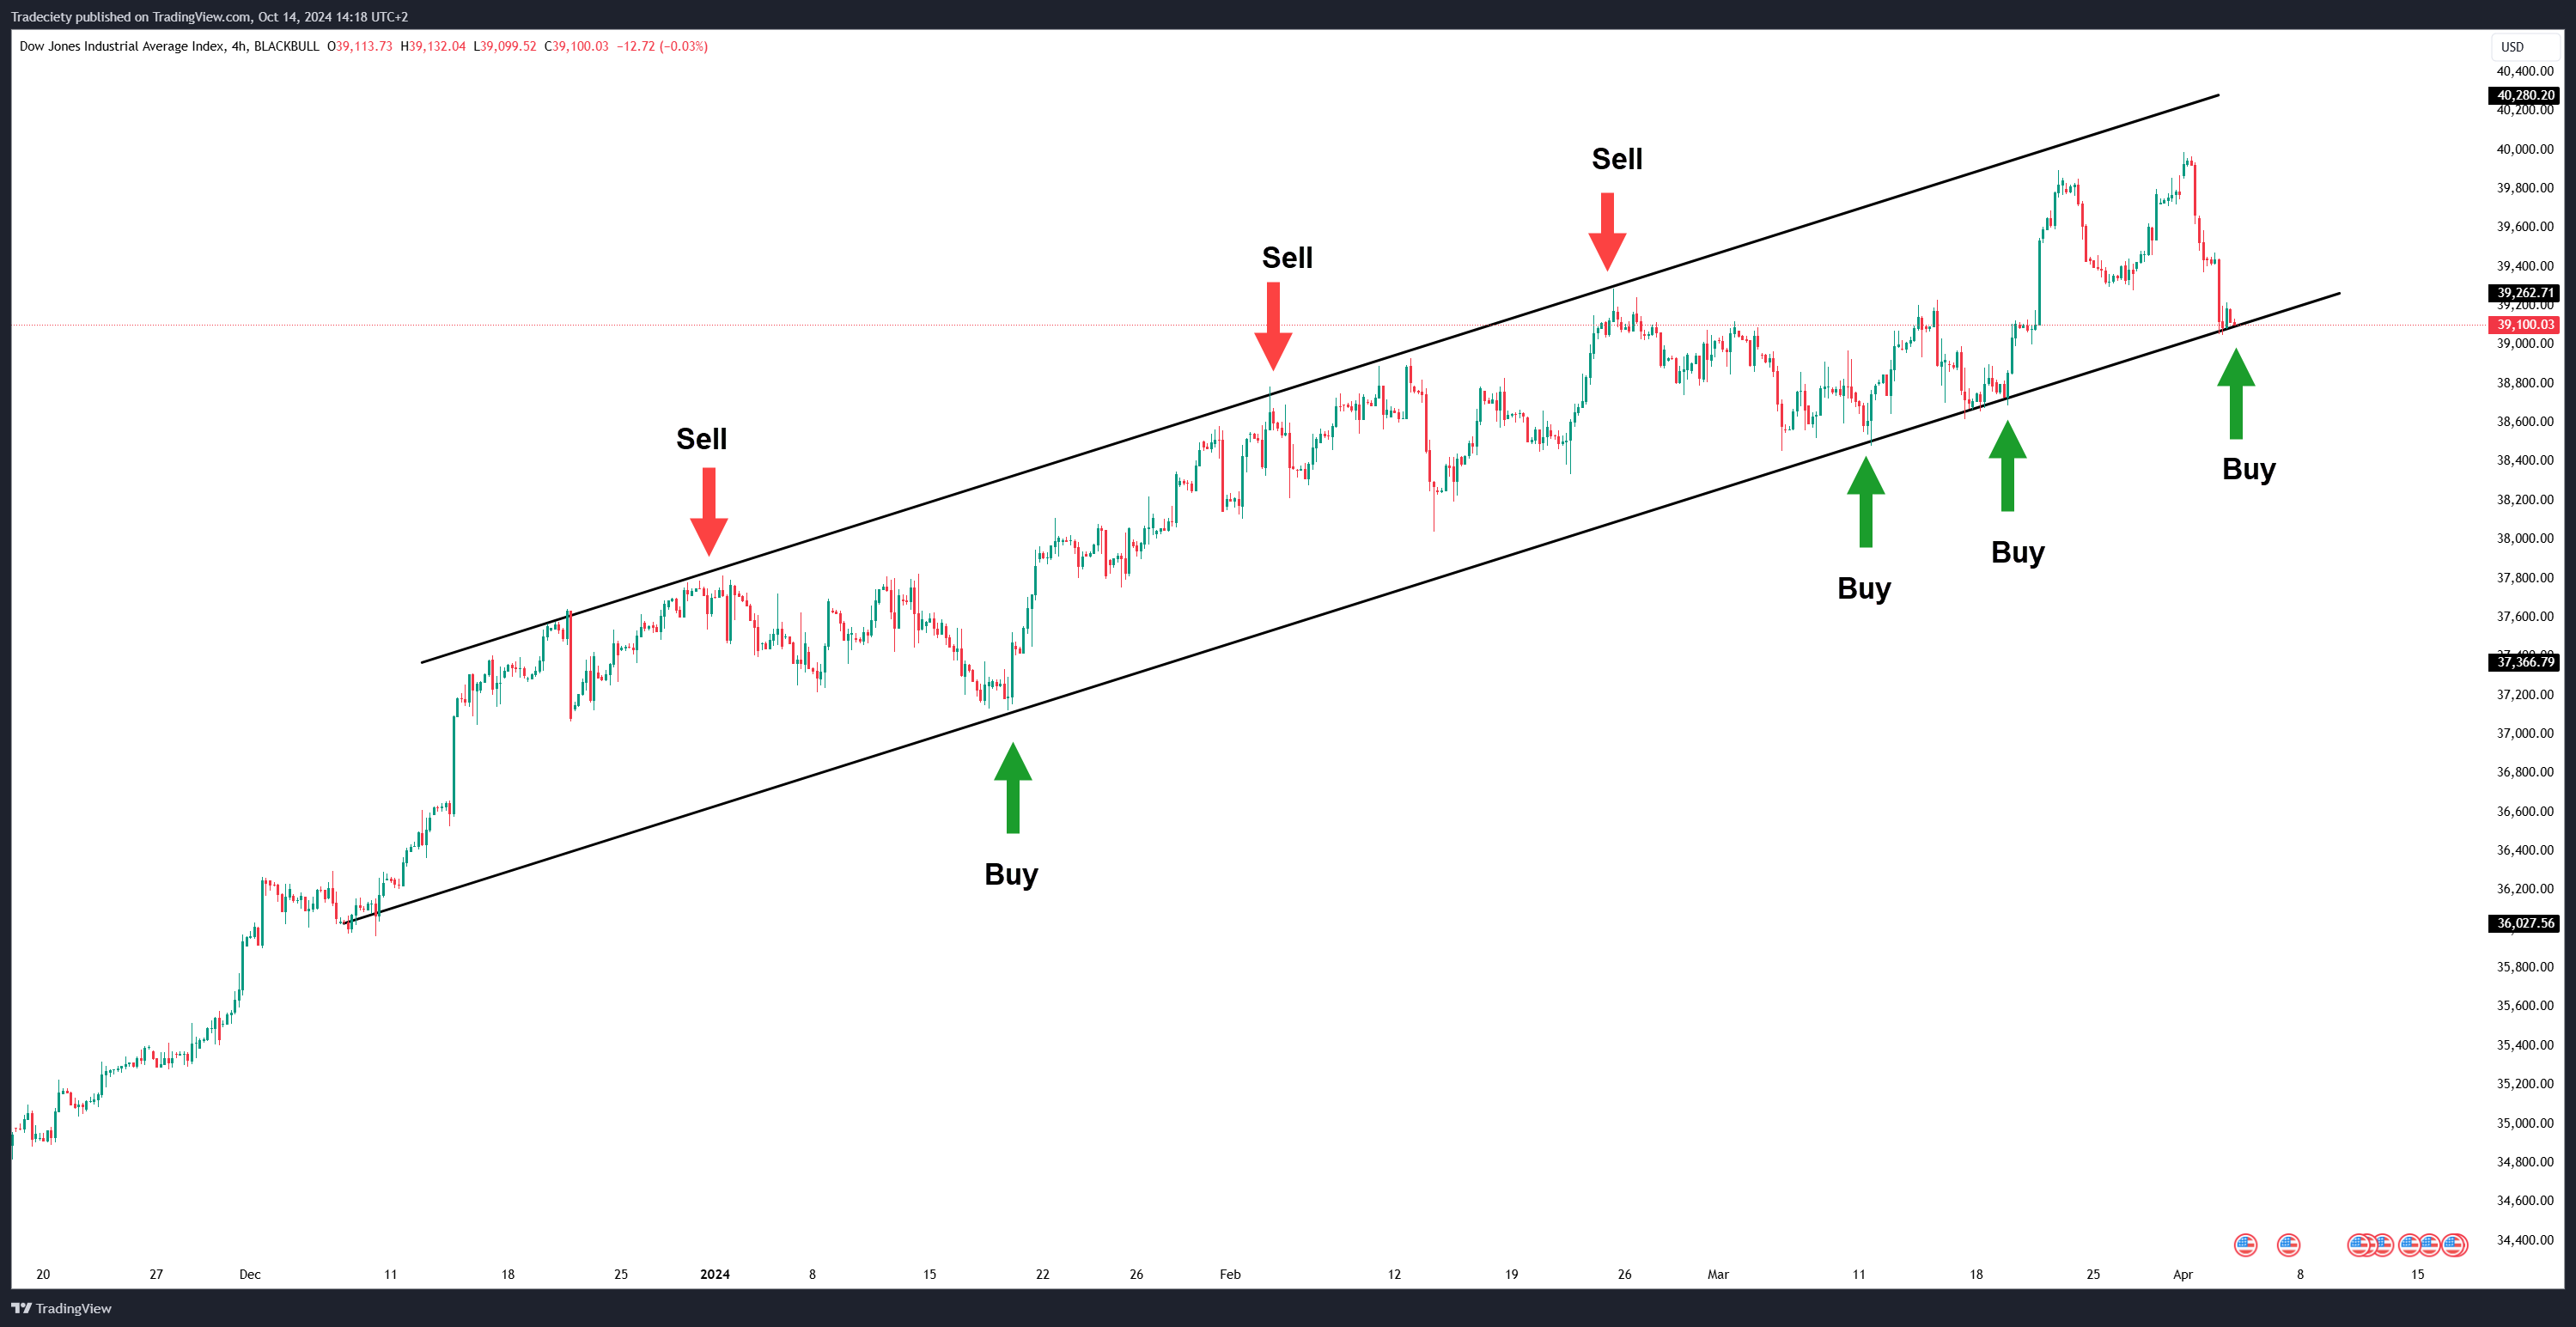
Once you've identified a valid channel, the next step is to plan your entry points. Here are two common strategies:
Buying at Support, Selling at Resistance
The most straightforward approach is to buy when the price hits the lower trendline (support) and sell when it reaches the upper trendline (resistance).
You can also choose to only trade bullish signals at the support trendline within an upward channel – filtering out bearish signals against the ongoing trend. And vice versa.
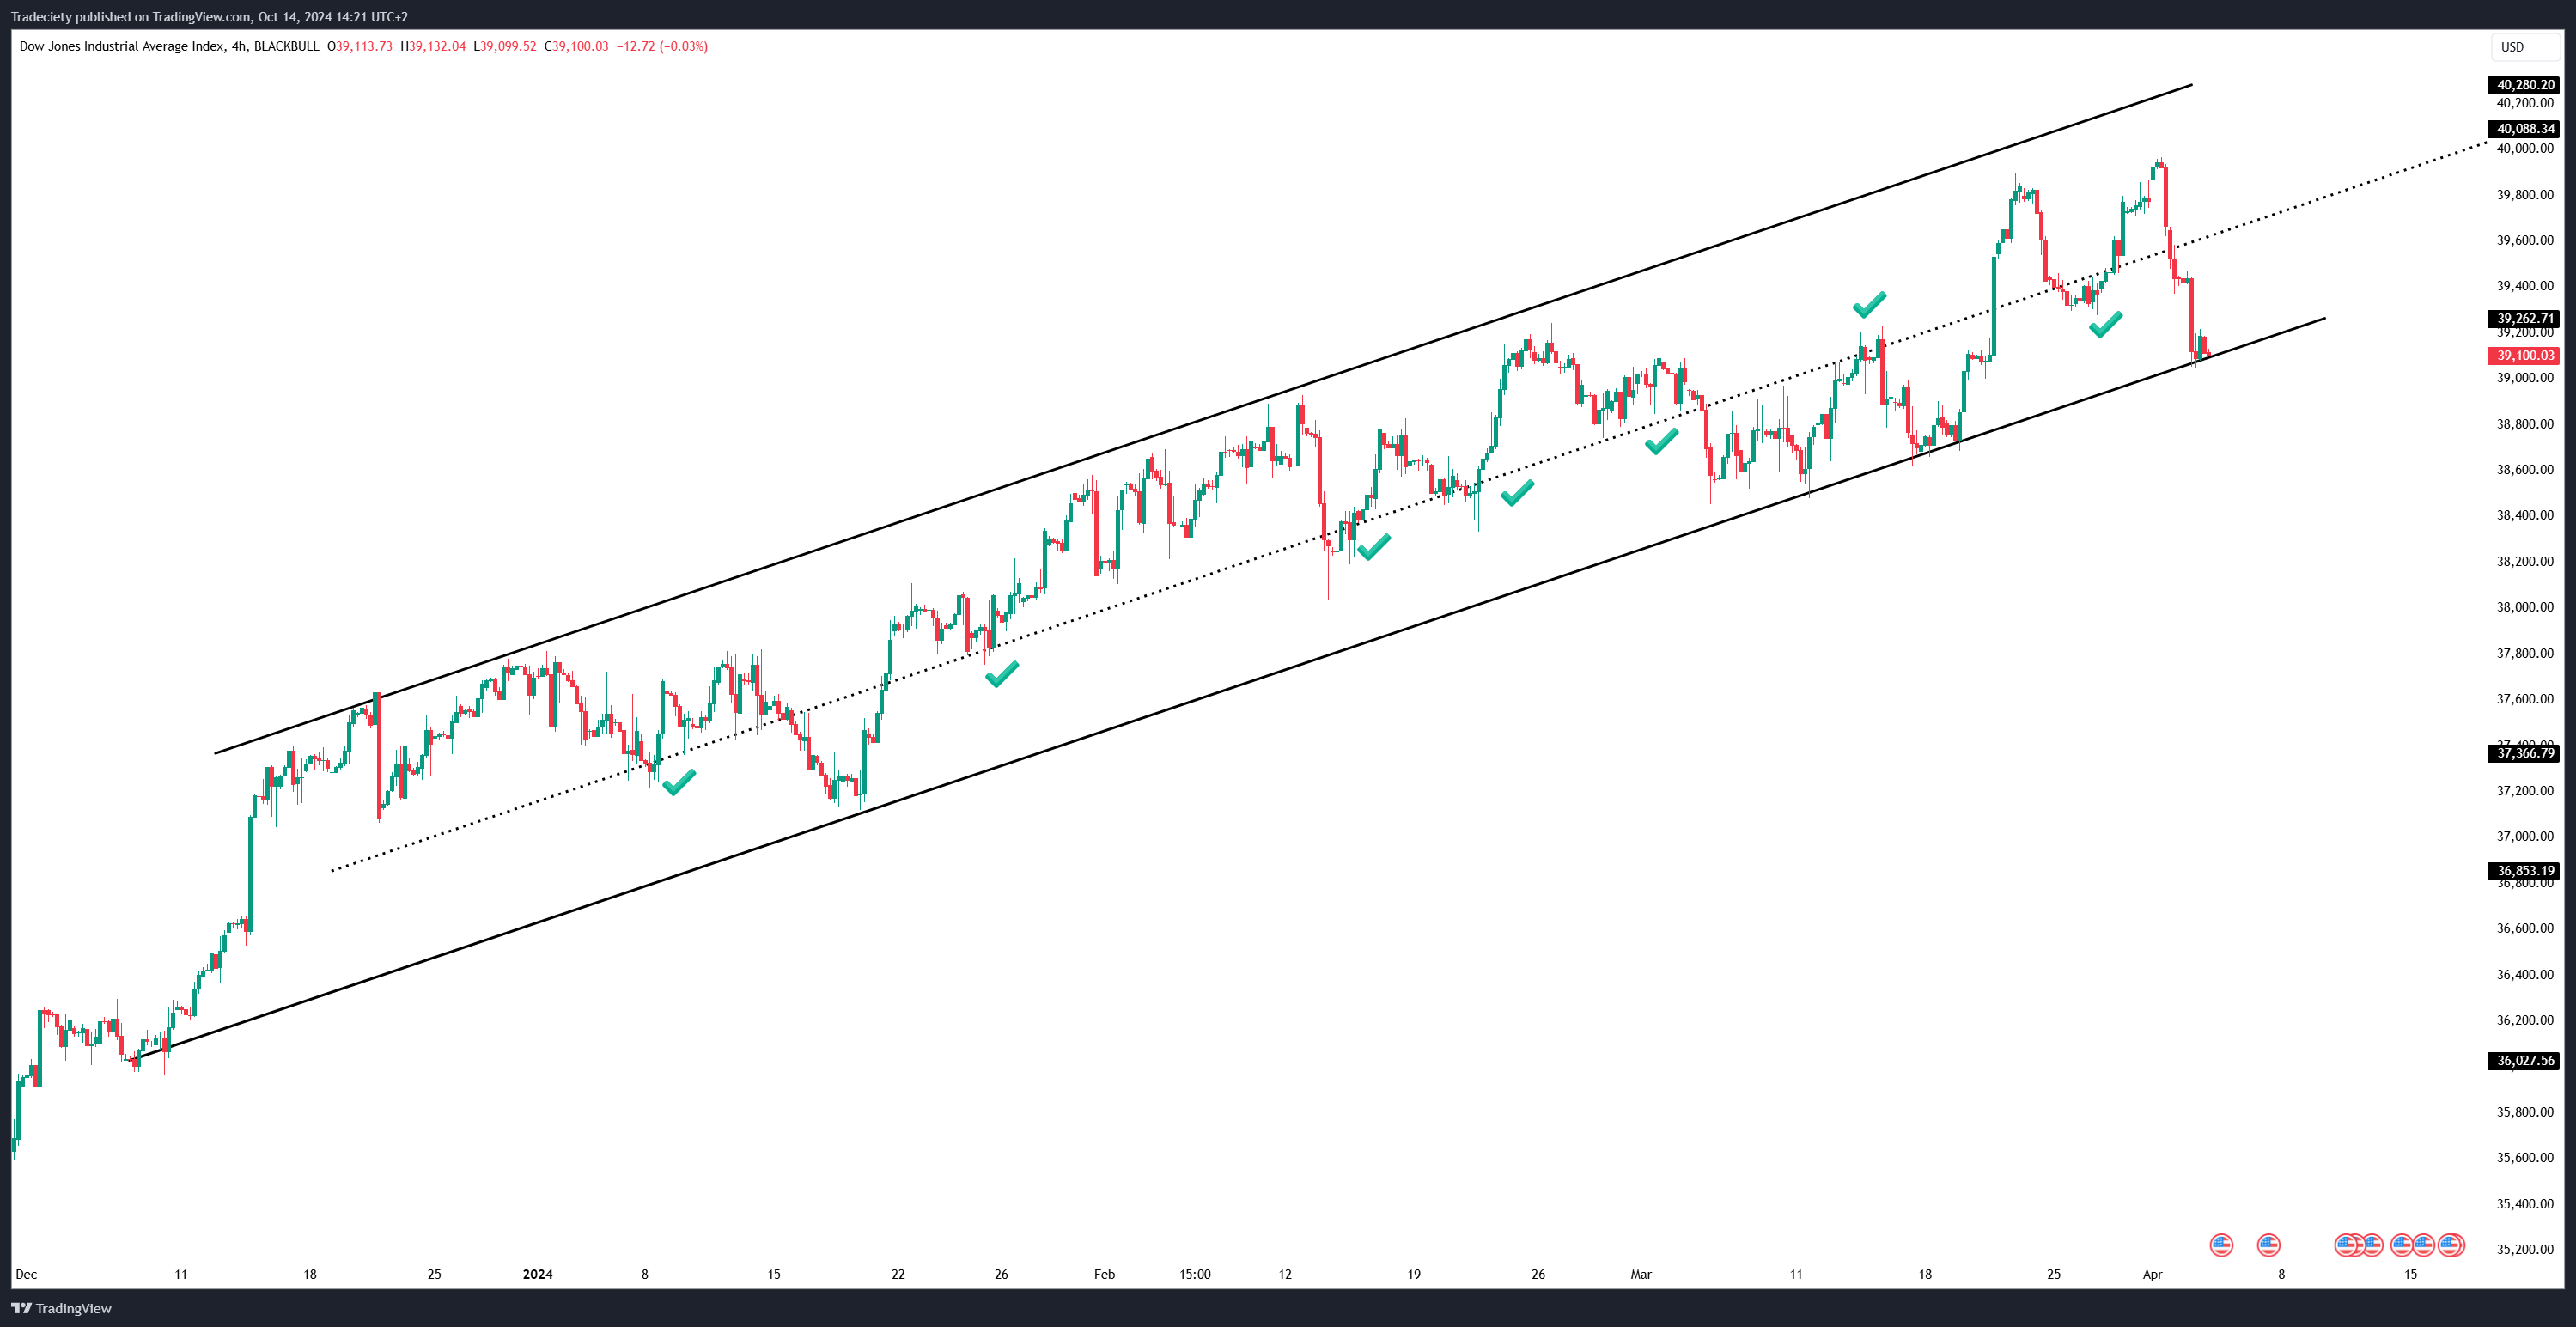
Trading the Mid-Line
The midline of a trendline channel also carries some importance – especially on higher timeframe channels that are wide. The price will often bounce at the mid-line, providing further support and resistance levels. Those levels can be great confluence levels on lower timeframes.
Trendline channels don’t last forever, and eventually, the price may break out of the channel. Here’s how to approach these scenarios:
Trading the Breakout:
When the price breaks through either the support or resistance line, it signals the potential start of a new trend. Traders can enter the market after a breakout confirmation or wait for a retest of the broken level before entering.

Trading Channel Fakeouts
As mentioned channel fakeouts are common and, therefore, many traders choose to follow a fakeout strategy. For this, the trader is ignoring the breakout signal and, instead, wait for the price to move back into the channel. Ideally, you the move back into the channel should occur with high momentum (large candlesticks) to signal the strong fakeout force.

Effective risk management is essential when trading trendline channels. Here’s how to set stop losses and take profits:
Stop Loss Placement
Set your stop loss slightly outside the trendline—below the lower boundary (support) for long trades and above the upper boundary (resistance) for short trades. This reduces the risk of being stopped out by market noise or false breakouts.
Take Profit Levels
Calculate your take profit based on the channel width. If the channel is 100 pips wide, aim to take profit near that level from your entry. Using the width of the channel helps ensure that your risk-to-reward ratio remains favorable.
Other target approaches can include a fixed Reward:Risk ratio. For that, you set your stop loss as explained above and then take a multiple of the stop loss distance as your take profit level. If your stop loss is 50 pips away from your entry, your take profit is set at 100 points, providing a 2:1 Reward:Risk ratio.
Practice in a Demo Account
Before jumping into live trading, it’s crucial to test your channel trading strategy in a demo account. Trading on a demo account is also great for practicing and improving your pattern recognition without the pressure of real money trading.
Continuously Refine Your Strategy
Trading is a dynamic process, and strategies that work today might need adjustments in the future. Keeping a trading journal can help you track your trades, evaluate your performance, and refine your strategy over time. Regularly reviewing your trading data will help you identify areas for improvement and keep you on the path to success.
Q1: What is the best timeframe for trading trendline channels?
The ideal timeframe depends on your trading style. Day traders may prefer 15-minute to 1-hour charts, while swing traders often use 4-hour or daily charts. Longer-term traders might opt for weekly or monthly charts to capture broader trends.
Q2: How do you know if a trendline channel is valid?
A valid trendline channel requires at least two touches on both the support and resistance lines, along with consistent price movement between them. A higher number of touches typically increases the reliability of the channel.
Q3: Can you use trendline channels in conjunction with other patterns?
Yes, trendline channels can be combined with other chart patterns, such as triangles, flags, or head and shoulders, to create more robust trading setups.
Q4: Is it possible to trade channels in volatile markets?
While more challenging, channel trading is possible in volatile markets. However, you must be cautious of false breakouts and wider price swings, which can make risk management trickier.
Mastering the trendline channel pattern can significantly enhance your trading strategy. Whether you're trading in a bullish, bearish, or neutral market, these channels provide clear entry and exit points, helping you capitalize on price movements. Remember to practice in a demo account, continuously refine your strategy, and employ strong risk management techniques to increase your chances of success.
external link:


We have been trading supply and demand strategies for over ten years, and they have stood the test of time remarkably well. Supply and demand is...

3 min read
Choosing the right trading journal is essential for traders wanting to analyze performance, refine strategies, and improve consistency. In this...

3 min read
“95% of all traders fail” is the most commonly used trading related statistic around the internet. But no research paper exists that proves this...