3 min read
Scientist Discovered Why Most Traders Lose Money – 24 Surprising Statistics
“95% of all traders fail” is the most commonly used trading related statistic around the internet. But no research paper exists that proves this...
By drawing trendlines on price charts, you can identify long-term trends and potentially profit from them. This guide will walk you through everything you need to know about trendline trading, from the basics of drawing trendlines to using them to enter and exit trades. Along the way, we'll also explore some common pitfalls to avoid and how to use other technical concepts alongside trendlines for a more well-rounded trading approach.
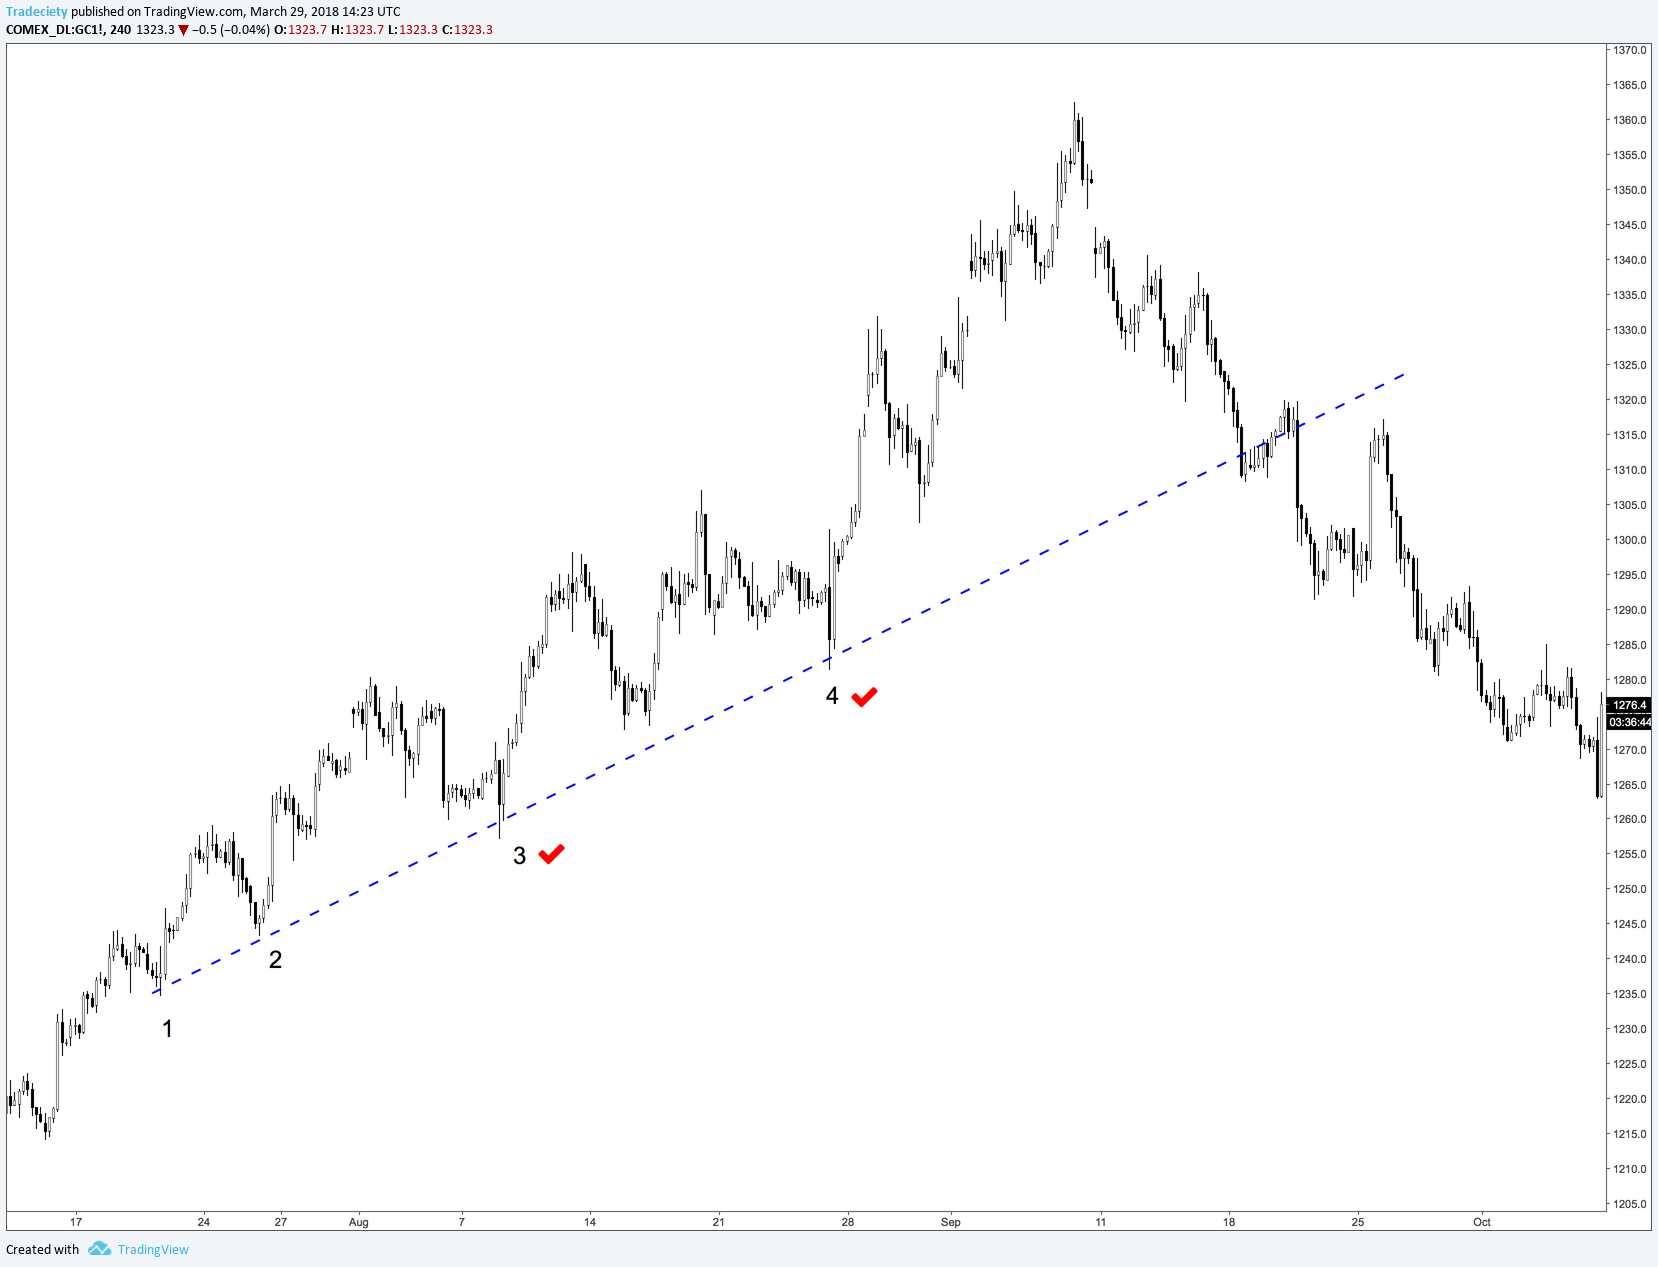
Generally speaking, it is advisable to wait for three confirmed points of contact before you start paying further attention to a trendline. A trendline is only confirmed if you can get three points of contact because you can always connect any two random points on your charts. But when three points of contact are lining up, it is no coincidence anymore.
The next question that always comes up is whether you should use the candlestick-wicks or the candle-bodies to draw the trendlines!? The answer is confluence.
Whenever you get the best and the most contact points and confluence around your trendline, that’s how you draw it. There are no fixed rules about whether wicks or bodies are better. Just look for a trendline that gives you the most confirmation without it being violated too much.
At the same time, consistency is very important as well. You should define for yourself how you draw trendlines and then always stick to that approach to avoid noise.
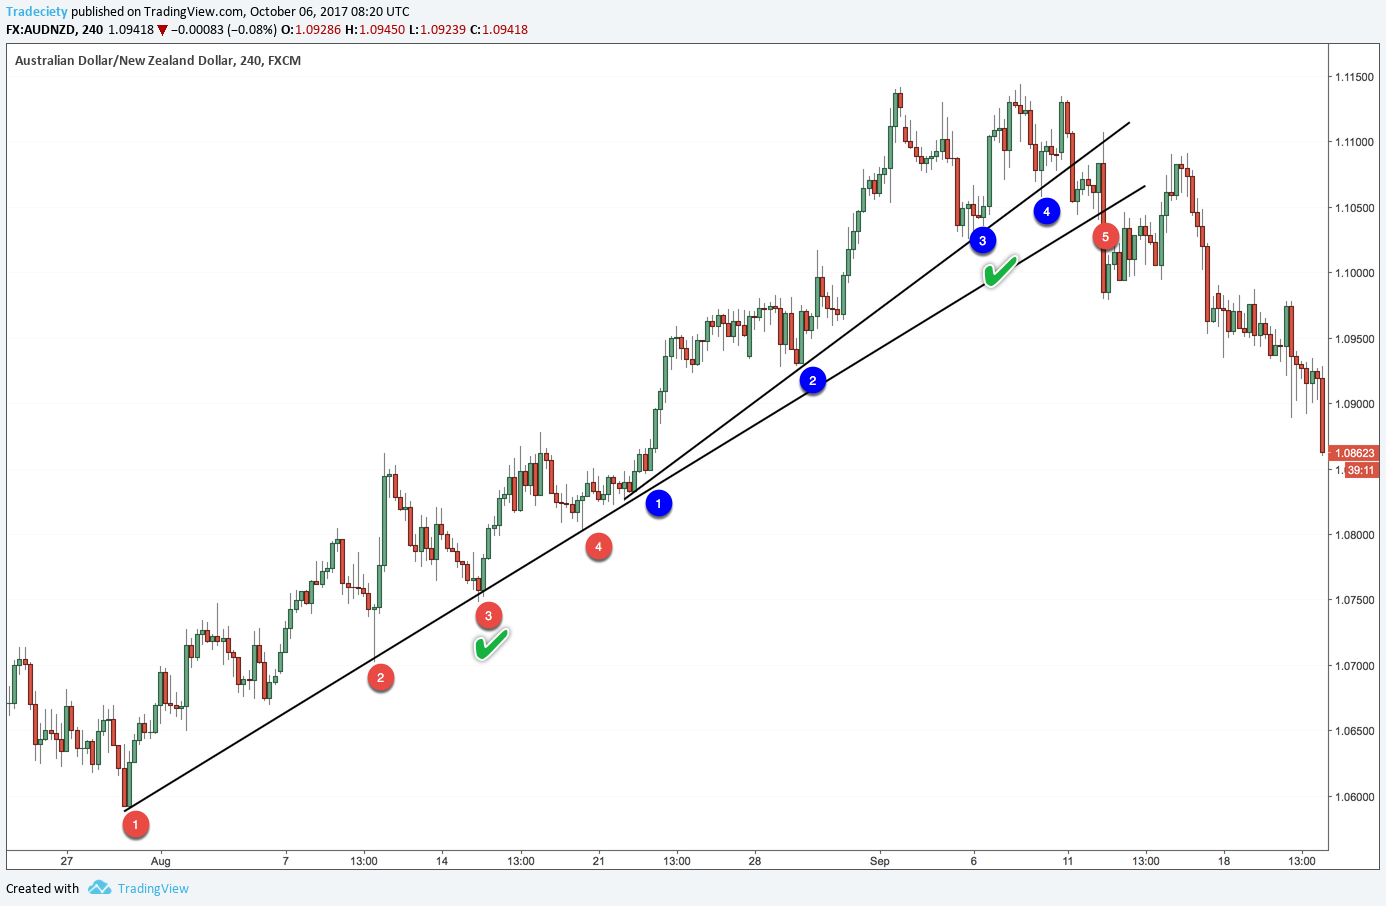
Below you see a screenshot with 2 possible trendlines and multiple touches on each. After the third touch, the trendlines have been confirmed and you can see how we used both the wicks and the bodies to get the trendlines in. Both trendlines are valid.
The next question that comes up is whether you draw trendlines connecting the lows or the highs. The answer is very straightforward:
During a downtrend, you connect the highs and during an uptrend, you connect the lows to draw a trendline. This has two benefits: you can use the touches to get into trend-following trades and when the trendline breaks we can use the signal to trade reversals.
click to enlarge
The slope – or the angle – of trendlines immediately tells you how strong a trend is.
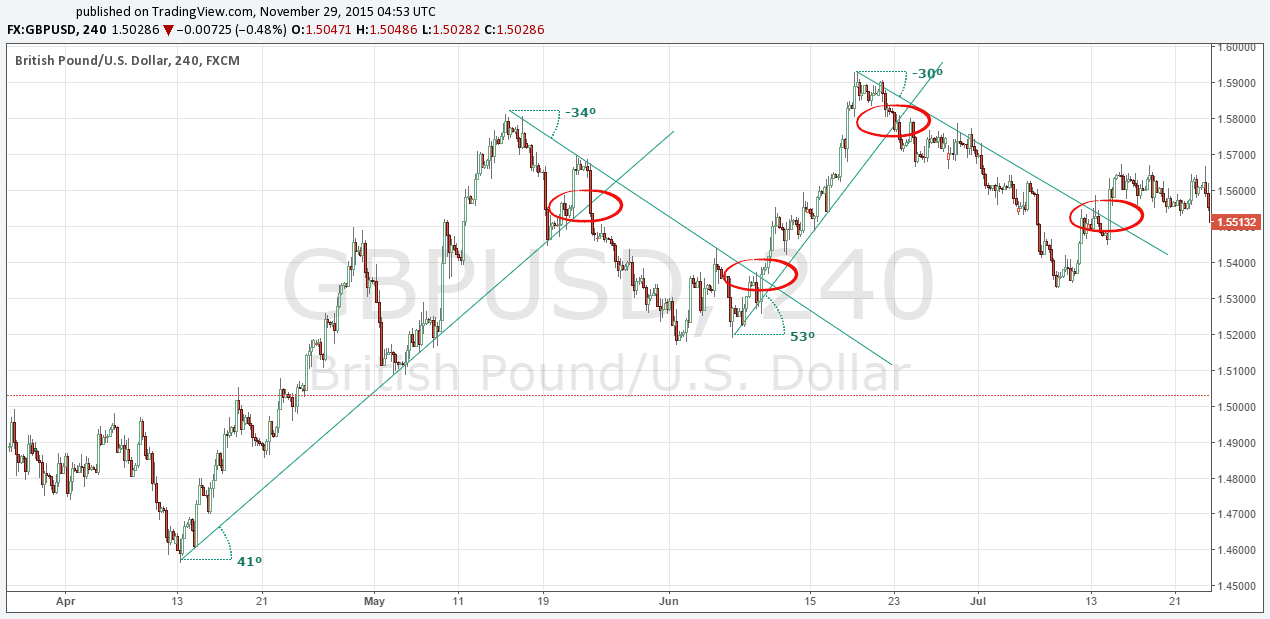
A steep angle on a lower trendline in an uptrend means that the lows are rising fast and that the momentum is high. The screenshot below shows an uptrend with steeper angles of trendlines. The trend is gaining momentum and the trendlines visualize it perfectly.
Some people will call this the bump and thrust pattern when you see that a trend is suddenly gaining even more strength and then the trend becomes unsustainable at one point - more on that later.

click to enlarge
The next screenshot shows the opposite: a downtrend with multiple trendlines that show decreasing angles. The trend is losing momentum.
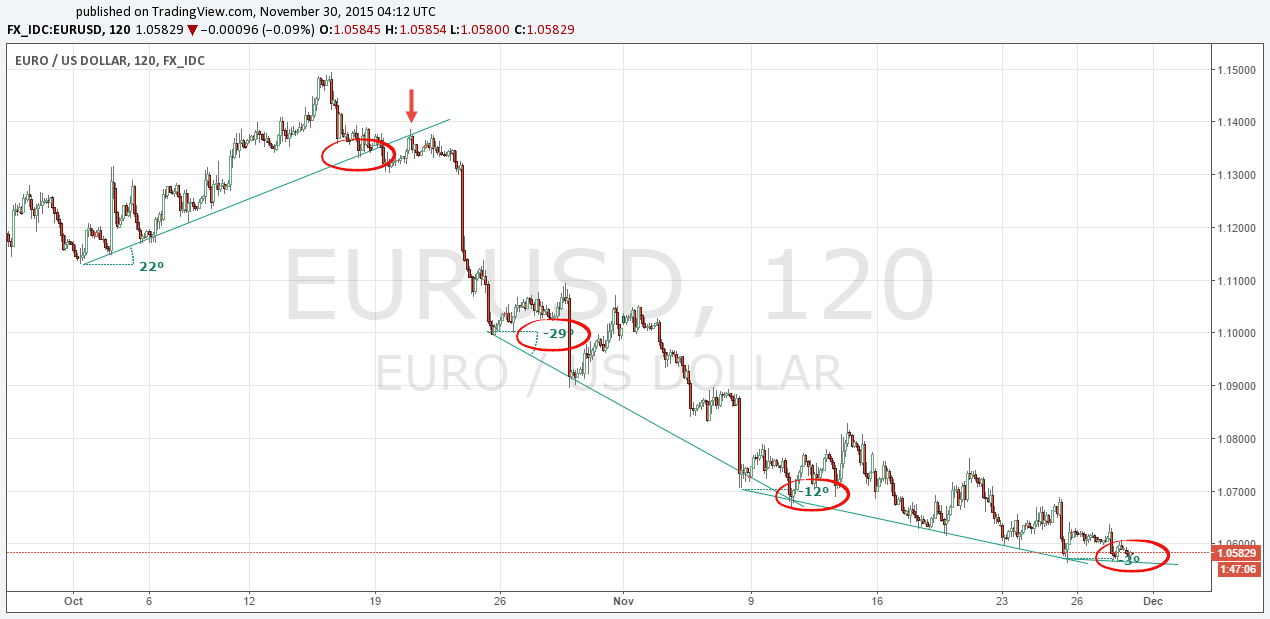
click to enlarge
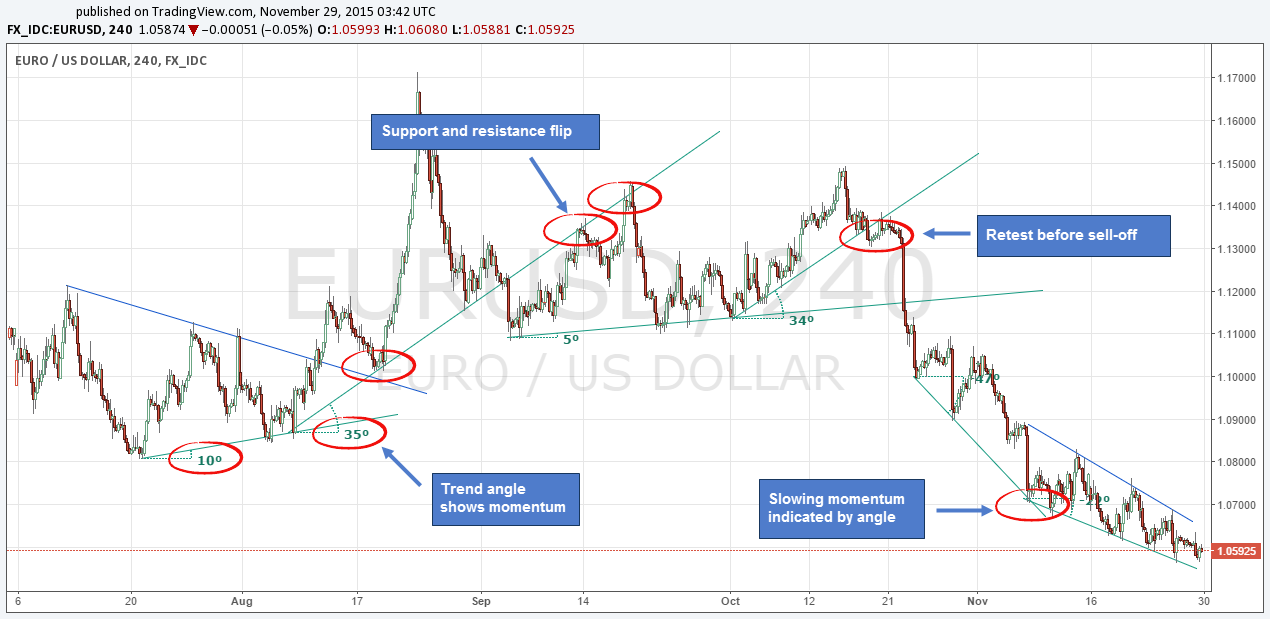
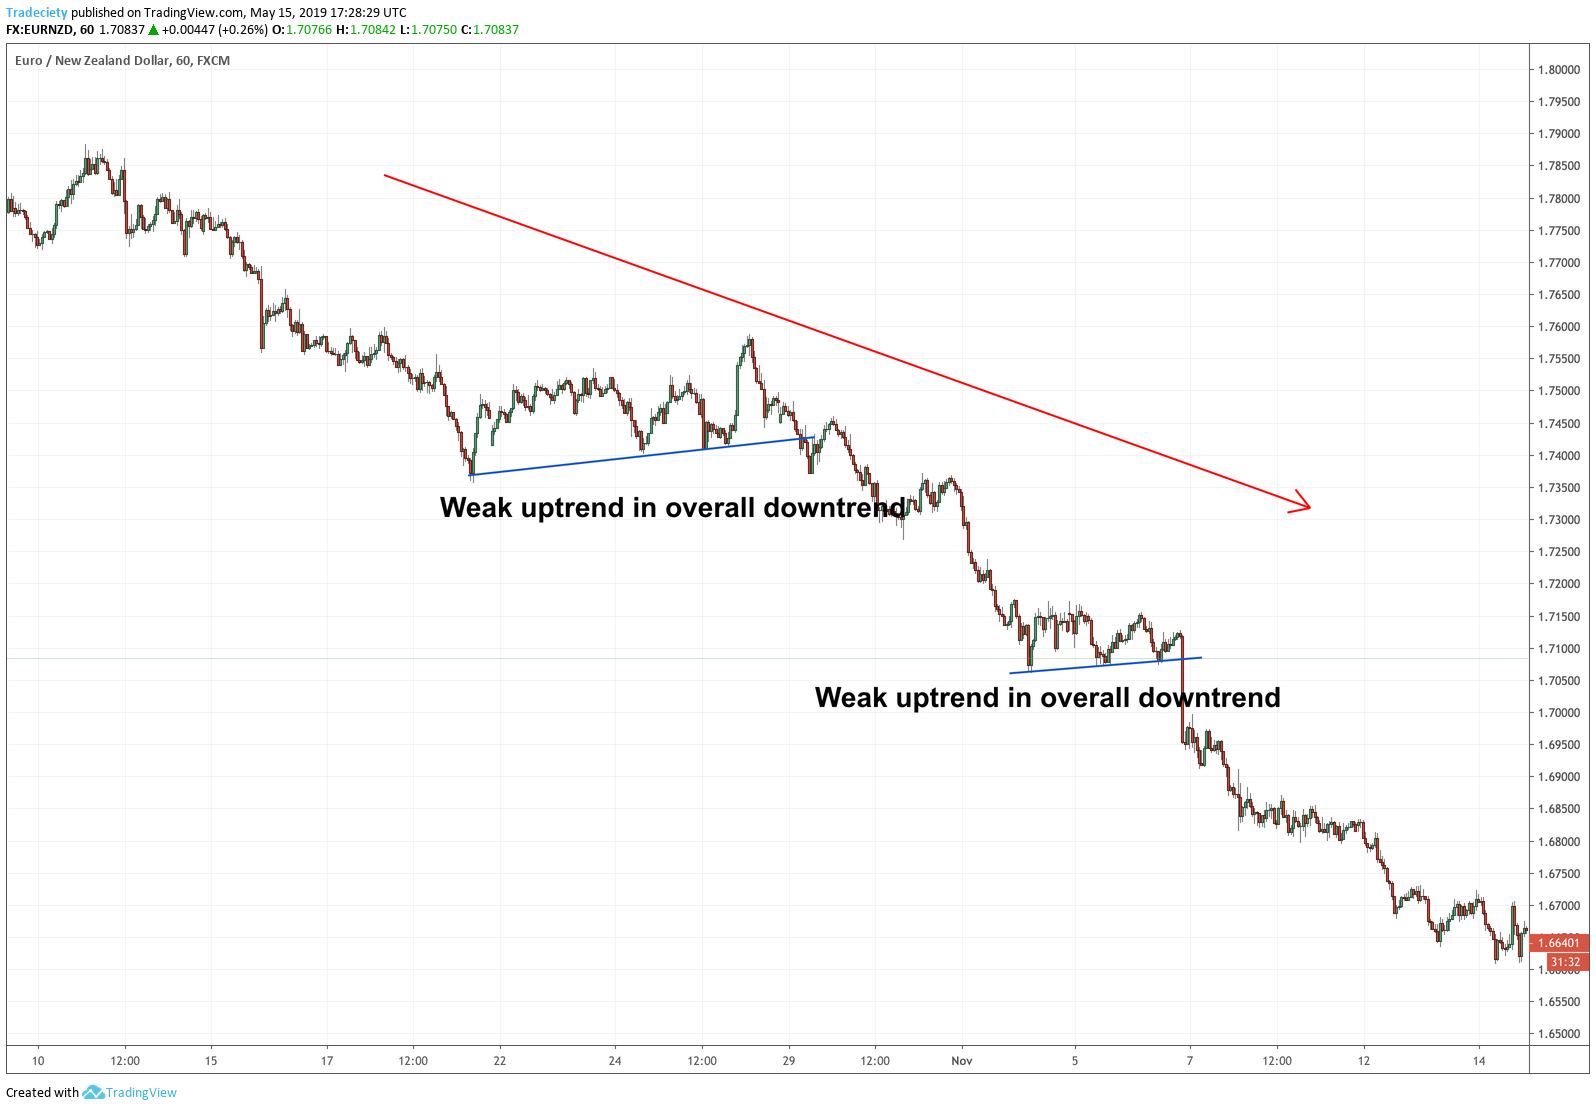
The screenshot below shows a primary long-term downtrend.
During the primary trend, traders start looking for weak consolidation phases and apply trendlines to those price movements. The low angle of the trendlines indicates that the consolidation does not have a high chance of turning into a real bullish reversal. The sellers still keep pushing the price very close to the bottom of the move, while the higher lows are very shallow and the buyers cannot take over the price action.
Of course, you won’t always be able to draw a trendline, but if you can find one, they can be high-probability trade setups.
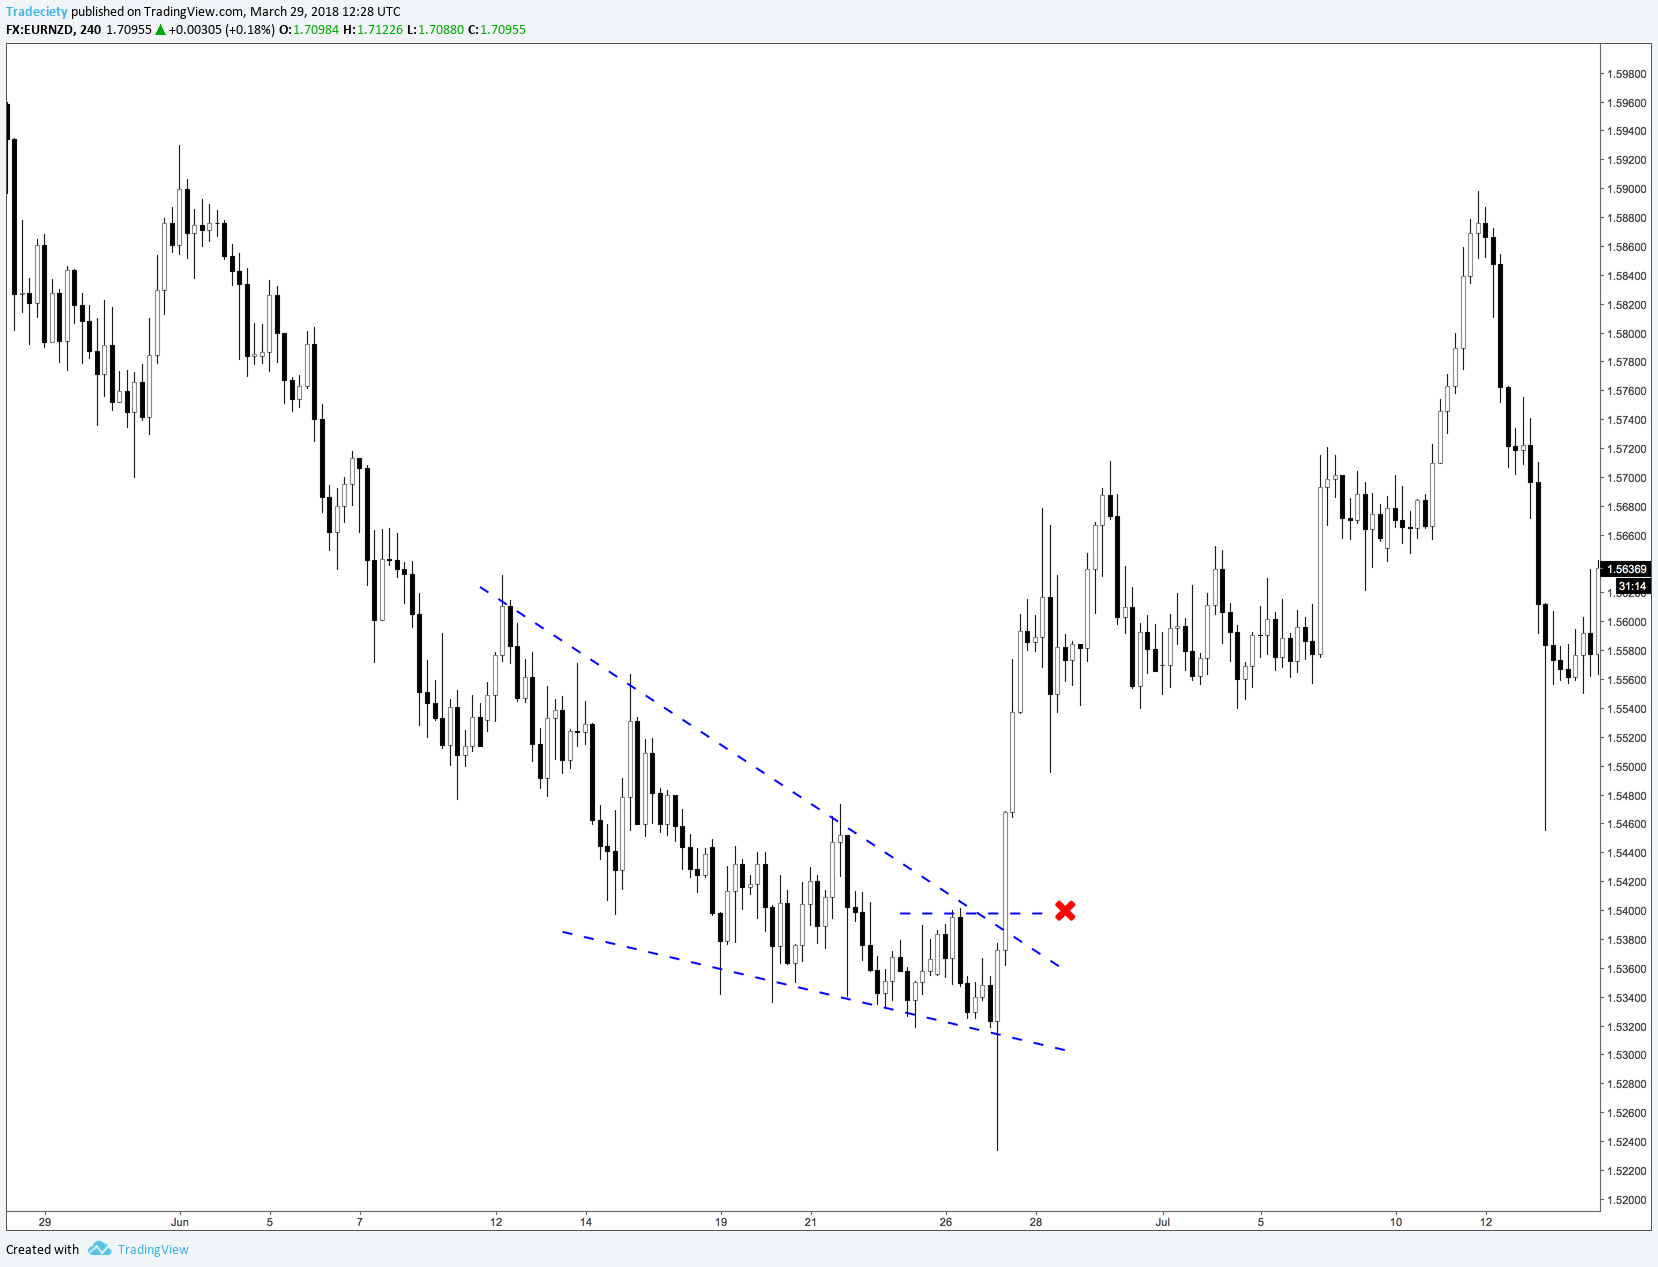
Many chart patterns in technical analysis are based on the principles of trendlines. The Wedge is a very popular one and we can apply our knowledge here nicely.
In the scenario below, the lower trendline indicates that the price is falling slowly as the angle of the lower trendline is shallow. This already shows that the sellers are not as strong in this market anymore. In the end, before the strong reversal, the market makes one final push which ends as a fake breakout. This pattern is also referred to as a Bull / Bear trap.
The two trendlines are also converging which shows that the market is in a consolidation phase. The trend waves are becoming smaller and smaller and the whole market is slowing down. During a wedge pattern, it is best to stand aside and not take any new positions. Once the trendline is broken to the upside, the wedge gets triggered and the bullish move can start.
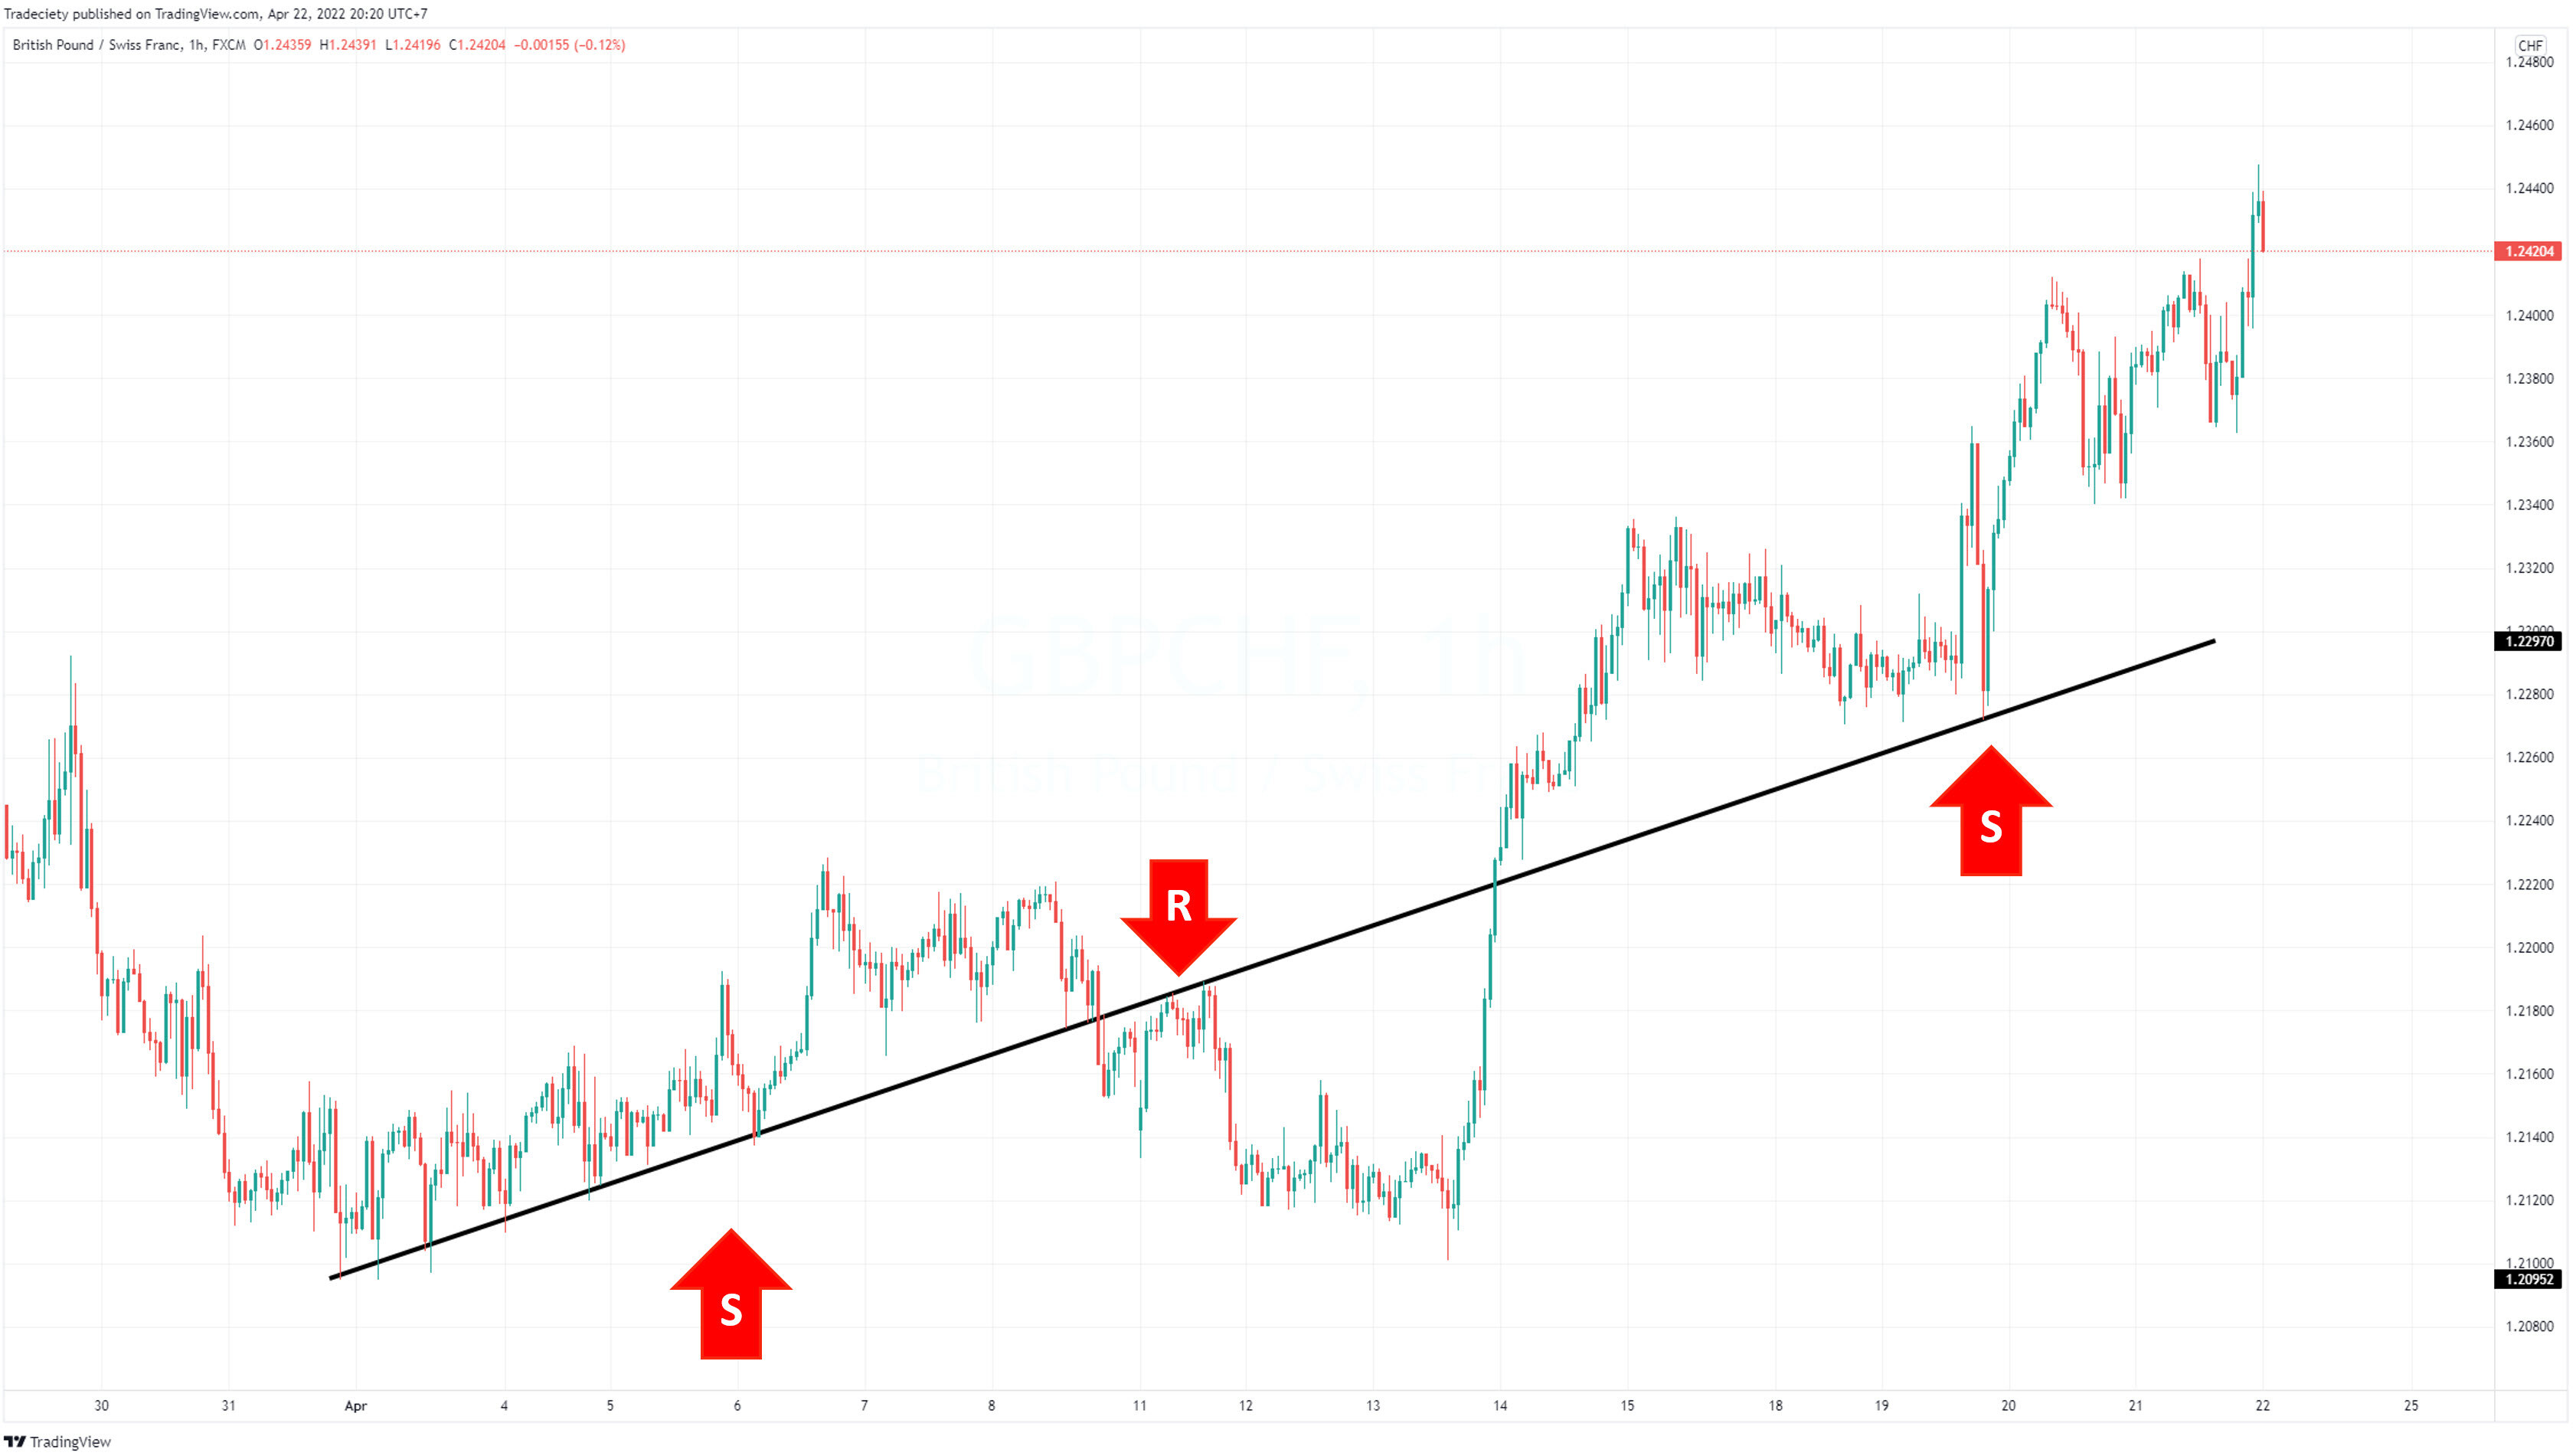
The concept of a "trendline flip" is a powerful tool that highlights a potential shift in price behavior. When a price consistently bounces off a trendline, it acts as resistance. However, a breakout above this resistance trendline can signal a change in power. If the price then revisits the old trendline, it often finds support there, as buyers recognize the previous resistance level as a new area of value. This flip can be a significant indicator of a trend continuation, offering a potential entry point for traders looking to capitalize on the new direction. Remember, the strength of the flip depends on factors like long-term trend direction and follow-through price action, but recognizing this shift can be a valuable weapon in your trading arsenal.
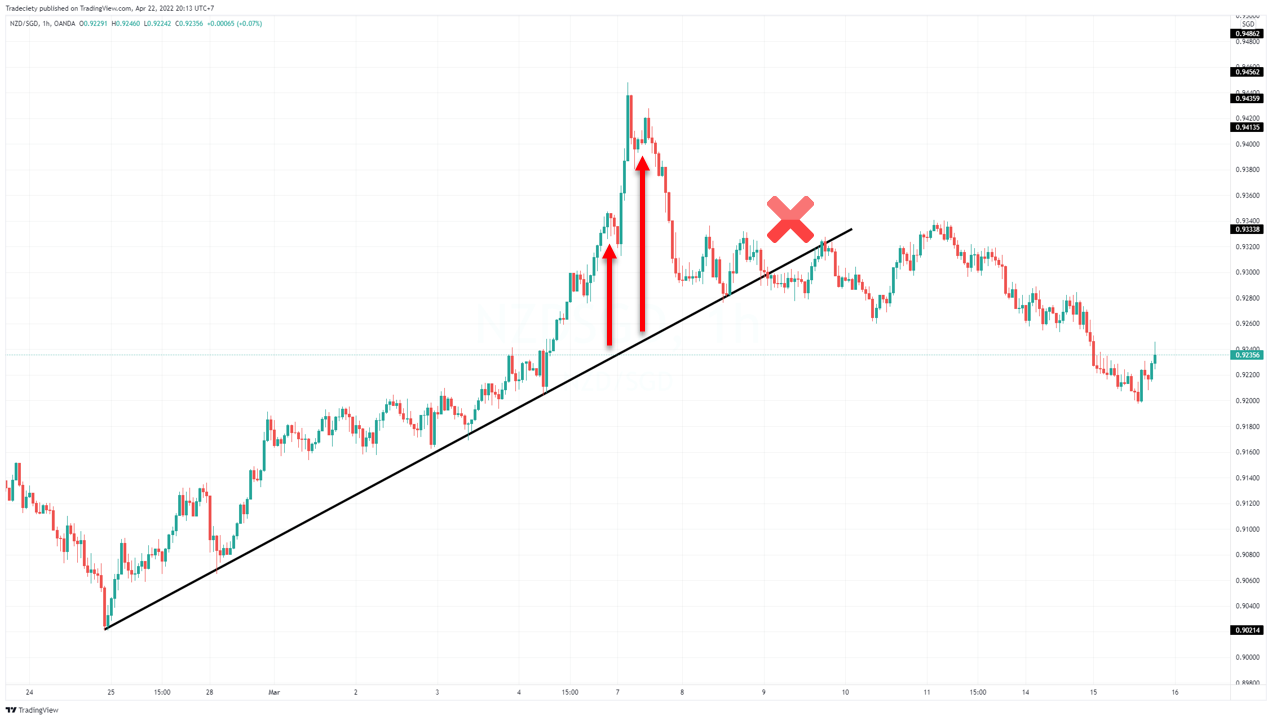
Trendlines are great for visualizing trends, but sometimes, the price action can get a little too enthusiastic. A "trendline takeoff" occurs when the price explodes away from a trendline, often with significantly higher momentum than usual. This sudden surge in momentum can be tempting, but for savvy traders, it might be a red flag.
It suggests the trend might be overextended, fueled by excessive speculation rather than fundamentals. This unsustainable momentum often leads to a correction as the market adjusts to a more realistic valuation. The sharp takeoff can act as a distribution zone, where early bulls cash out, leaving latecomers holding the bag as the price falls back towards the trendline, or even breaks below it entirely. Identifying a trendline takeoff requires looking for a price surge deviating from the established trend. While breakouts can be opportunities, a takeoff might signal a trend nearing its end, prompting cautious observation or even a shorting opportunity for experienced traders.


external link:


3 min read
“95% of all traders fail” is the most commonly used trading related statistic around the internet. But no research paper exists that proves this...

3 min read
Trendlines can be great trading tools if used correctly and in this post, I am going to share three powerful trendline strategies with you.

3 min read
Choosing the right trading journal is essential for traders wanting to analyze performance, refine strategies, and improve consistency. In this...