Supply and Demand Trading in 2026
We have been trading supply and demand strategies for over ten years, and they have stood the test of time remarkably well. Supply and demand is...

Gaps are common, especially in the stock market and they can provide information and insights about the underlying market dynamics. A gap is usually created when the closing price of the previous day and the open of the following day have different price levels (see the screenshot below). In times of large volatility, intra-day gaps can also exist.
The breakaway gap describes a gap in price that gaps over a support or a resistance level.
The chart below shows the price chart of APPL with a strong resistance level. After the gap was formed, the trend accelerated.
The breakaway gap, thus, shows a trend continuation signal most of the time.
The chart study below shows numerous breakaway gaps through important resistance levels. Each breakaway gap leads to a trend continuation as well.
The exhaustion gap usually happens during a trending period and can signal a reversal. Price makes one final gap in the direction of the trend and then reverses.
The chart situation below shows two exhaustion gaps into previous support (2) and resistance (1) levels. In both cases, the candles after the gap are representing small Doji candles and, thus, indicate indecision. The following candles are large momentum candles and provide the final signal.
It is recommended to wait for the completion of the candle that confirms the change in direction to avoid running into false signals.
Continuation gaps occur in the middle of trends. In an uptrend, a gap upwards signals a continuation and it shows that additional buyers entered the market to push price higher.
Preferably, continuation gaps are not extremely large in size to confirm sustainability. Any extreme price or gap movements might foreshadow a shift in the buyer and seller dynamic.
As the name implies, a common gap is nothing extraordinary and it can happen frequently without any major implications about further price movements.
Common gaps often occur when price is ranging. These types of gaps are not big in size and get filled relatively quickly. The screenshot below shows the price chart for QQQ. Price is ranging and common gaps occur frequently within the range without any signaling effect.
Thus, it is recommended to avoid trading gaps within a range and without additional confluence factors. The other 3 types of gaps usually provide higher probability trading opportunities.
The gap-fill is a popular trading strategy and it is used not only in the stock market, but also in Forex.
After a gap is formed, it happens frequently that the price eventually returns to the origin of the gap and, thus, “closes” the gap.
Important in this context is that a gap close does not always happen. Furthermore, the gap close does not necessarily happen right away.
I do not recommend trading gap closes on their own, but using gap fills as a way to pick targets can be beneficial. Also, once a gap is closed, you can often find re-entry opportunities because the price will return into its original direction.
When TWTR closed the gap, the price shortly after started a new bullish phase.
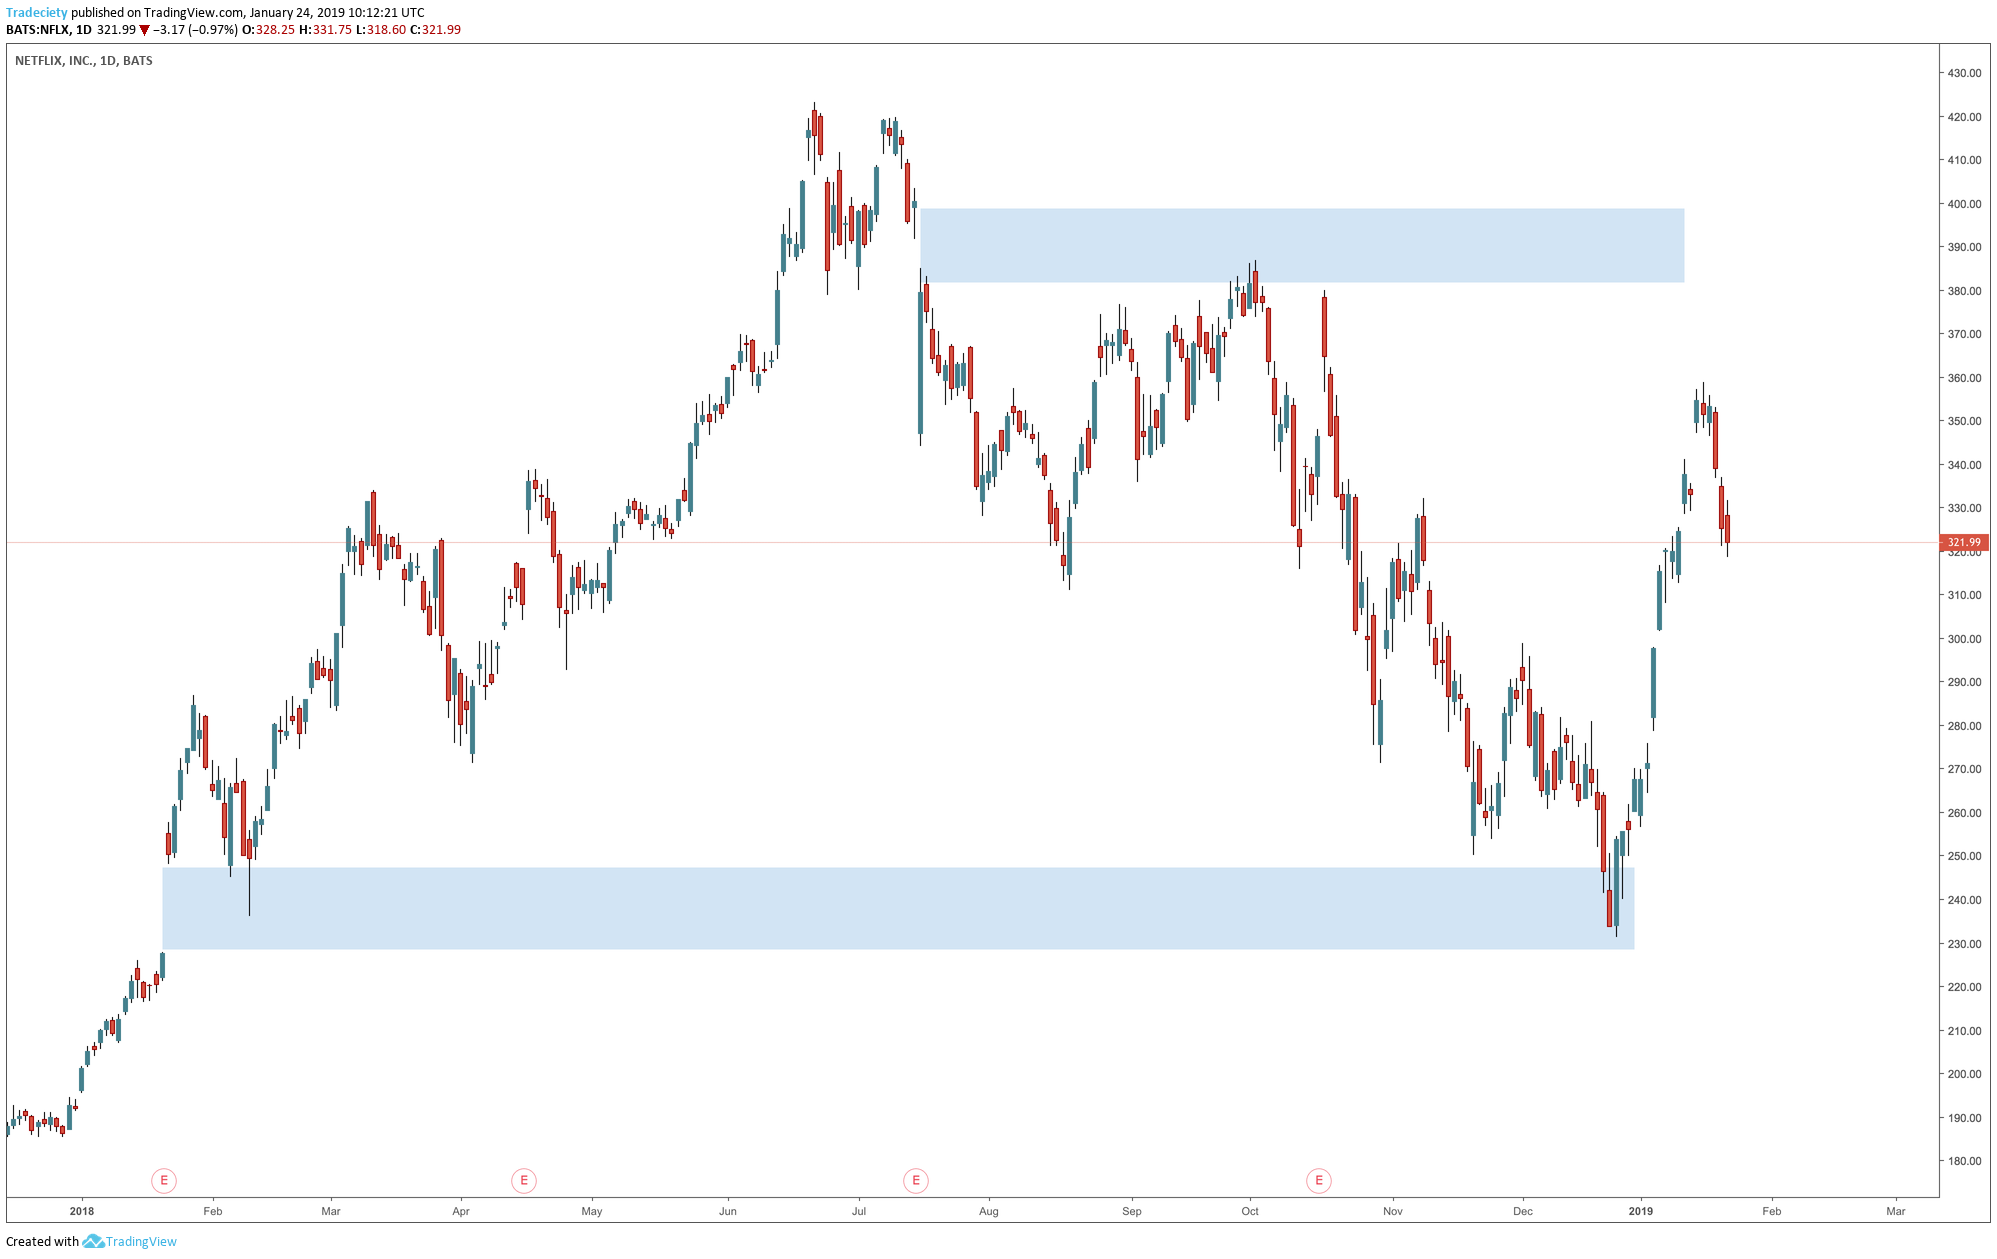
NFLX closed both gaps and each time, the gap close was the catalyst for a new trending move.
In Forex, gaps happen less frequently, but there is a similar mechanism we can observe. Extremely long candles often tend to get “filled” again. The price usually has an easy time reaching the origin of such long candlesticks. Below you see how the long candle on the AUDCAD got filled with another strong rejection. The price does not face any support/resistance on the way down through such a candlestick.
What’s your favorite gap type and how do you trade them?

We have been trading supply and demand strategies for over ten years, and they have stood the test of time remarkably well. Supply and demand is...

3 min read
Choosing the right trading journal is essential for traders wanting to analyze performance, refine strategies, and improve consistency. In this...

3 min read
“95% of all traders fail” is the most commonly used trading related statistic around the internet. But no research paper exists that proves this...