3 min read
Scientist Discovered Why Most Traders Lose Money – 24 Surprising Statistics
“95% of all traders fail” is the most commonly used trading related statistic around the internet. But no research paper exists that proves this...
(00:22):
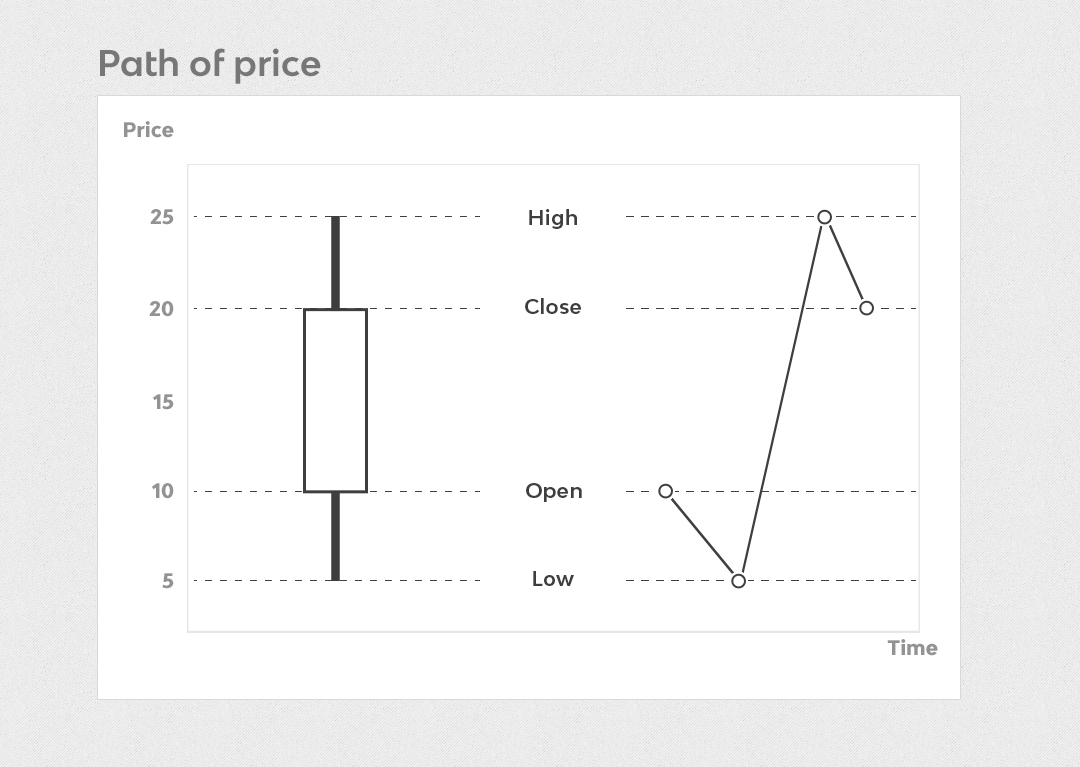
Today we are going to talk about candlesticks and I’ve prepared a special webinar. We will start with the basics of candlesticks. And then in the second part of this video we will move into the live markets and I will show you how to apply candlesticks in your trading to find better trading opportunities. So when we start with candlesticks, the most important thing is that we always need to remember that candlesticks show us the way the price move and the path of the price can be read from a candlestick.
(01:06):
So if this is a bullish candlestick, you notice as this is the open, this is the close, this is the highest point and is the lowest point. So when we dissect a path of the price from this candlestick, we will know that the price opened here, it moved to the lowest point here, it moved to the highest point and then closed right here. And this will help us later on to determine candle quality, candle strength and momentum as well.
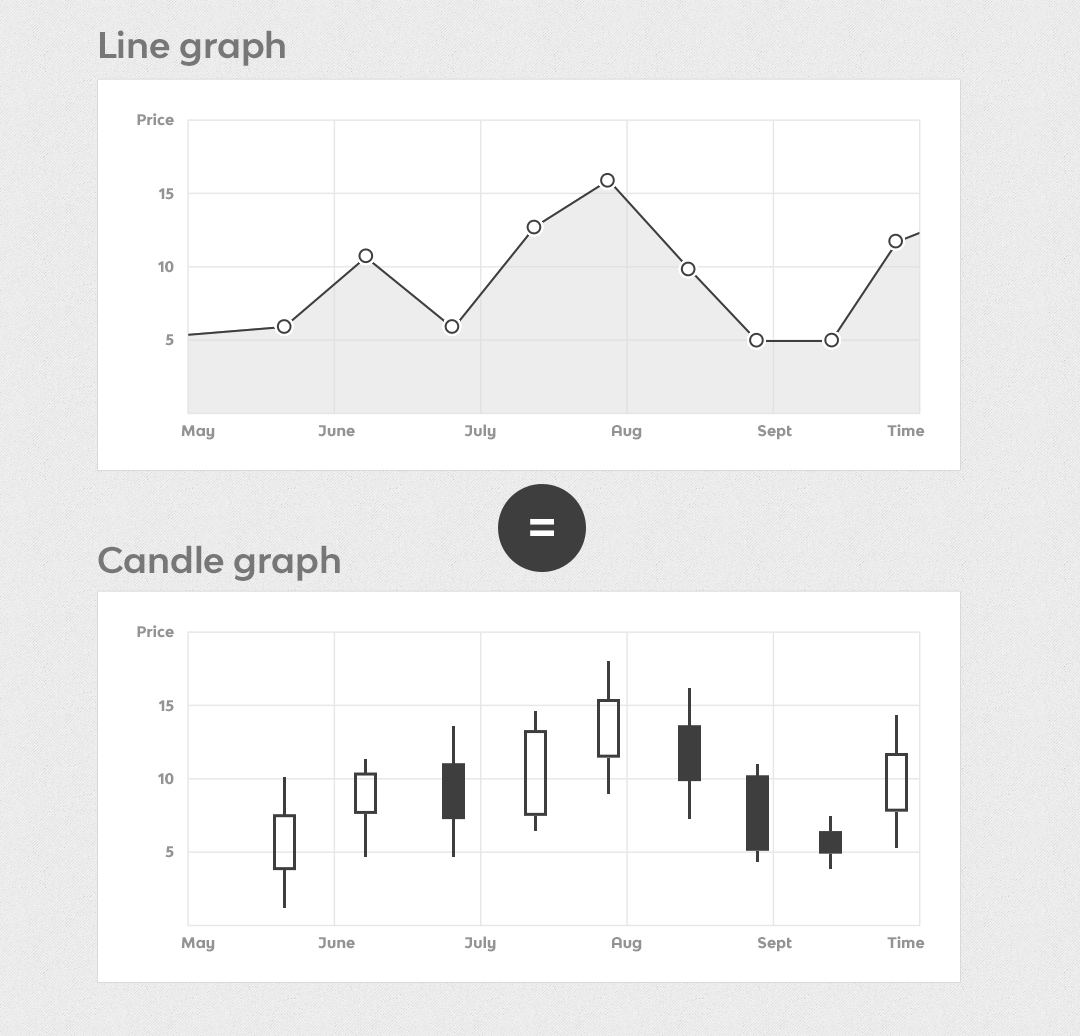
So when we now put a few candlesticks after each other, like in this example here you can see we have a bullish sequence, we have some bearish candles and when you connect the closing prices off the candles, you will get a line graph and the line graph would tell you also a lot about what is going on. The candlesticks just provide a little bit more information about volatility, about momentum and how strong intro candle momentum is. When it comes to understanding the bullish and bearish strengths of the candlestick,
(02:06):
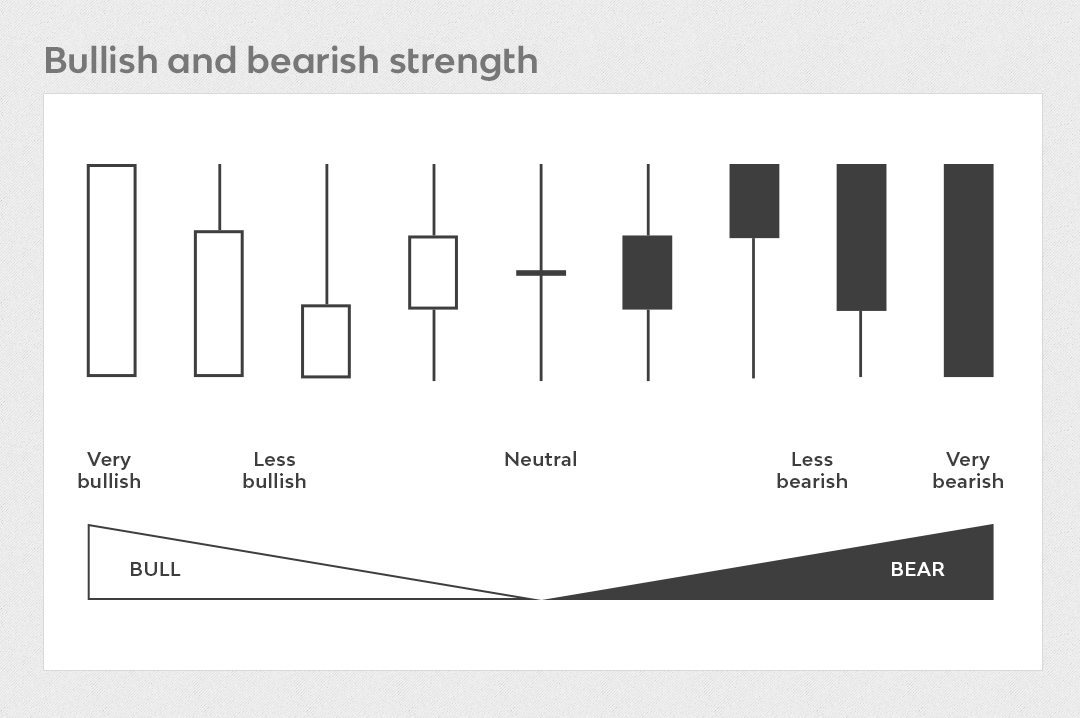
this is how it looks like on a spectrum. We go from very bullish to neutral to very bearish. The very bullish candlesticks don’t have a wick. They just have a very long body. Usually we see those candlesticks during strong trending markets. The, the bullish candles become less and less bullish. The, the smaller the body is becoming, the larger the wick is getting as well so as you can see this is how we slowly moved to a more neutral market. Here we slowly started seeing a bullish dodgy where the body is in the middle. We still have a bullish candlestick here overall, but you see we have longer wicks. This is a completely neutral candlestick where the opening and the closing price is roughly at the same level and then we moved to a more bearish and a very bearish outlook here where you only have a bearish candle body.
(02:54):
There are no wicks. The price opened at the top, it closed at the bottom and during the whole duration of the candlestick, the price only moved lower. This will help us later on when we look at charts, determine how strong is the market. When you look at candlesticks and when we apply candlesticks, it is important always to keep in mind what the story of the candlestick is telling us.

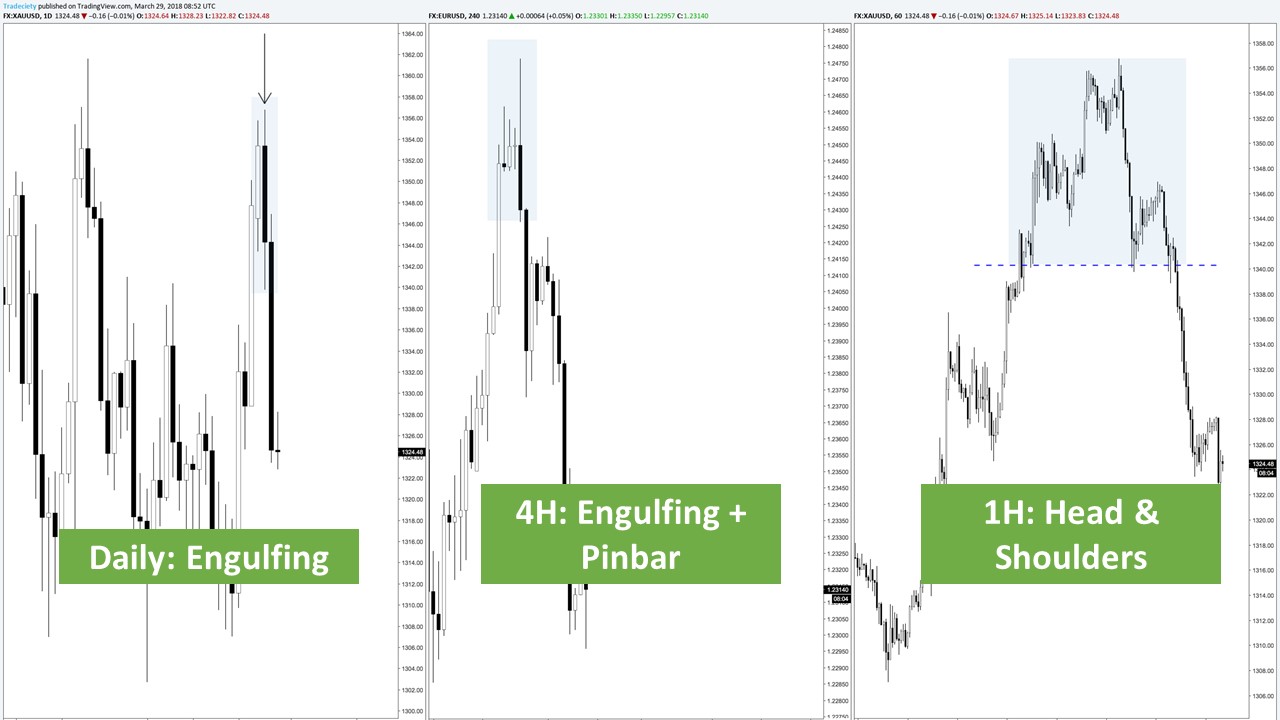
Here we have a very nice top down approach and I marked this engulfing candles to here from the daily chart. You can see this black candle is a bearish engulfing candle. It is completely outside of the previous bullish candle. And what this looks like on the lower time frame is really important and it helps us understand what is going on inside the candlesticks. So when we moved from the daily to the four hour, you can see that this engulfing candle now turns into engulfing and a pin bar.
(03:47):
You can see we have a very strong bullish move first, then the momentum dies down. And then this candle here first has the components of the pin bar with the long candlestick wick showing us a rejection. And then it also has the component of the engulfing candle where the price completely closes at the low of the candle. It leaves a very, very strong body. It is completely outside of the previous three candlesticks. So by understanding and by just going to a lower timeframe, we can already see that how this bullish candle looks on the lower timeframes. If we now go to the even lower timeframe to the one hour, we can see how this engulfing candle on a daily looks actually like a head and shoulders on the one hour timeframe. You can see this price behavior very nicely. We have the left shoulder here.
(04:34):
Then we have our head here and we have the lower right shoulder here. The right hand side and all of those things happen inside of this engulfing candlestick formation so it really can help understand that we are not only looking at a single candlestick, but actually there is more happening inside the candlestick and this engulfing candle when, when you understand that this is actually a head and shoulders on the lower timeframe, it helps us understand how the momentum is slowly rolling over. During this uptrend market made higher highs and higher lows. Here we have a double top where the market failed to push higher and then it completely rolls over. It’s now making a lower low and a lower high, which indicates already the bearish trend is coming in and then it fully collapses. And you can see on the daily timeframe what looks like a V top on the lower time frame
(05:24):
it’s actually a very nice technical candlestick pattern. When we try to understand candle size and trend strengths, this can also help us a lot. During strong trending markets you will often see that the candlesticks only have one color. They are pushing into one direction very strongly.
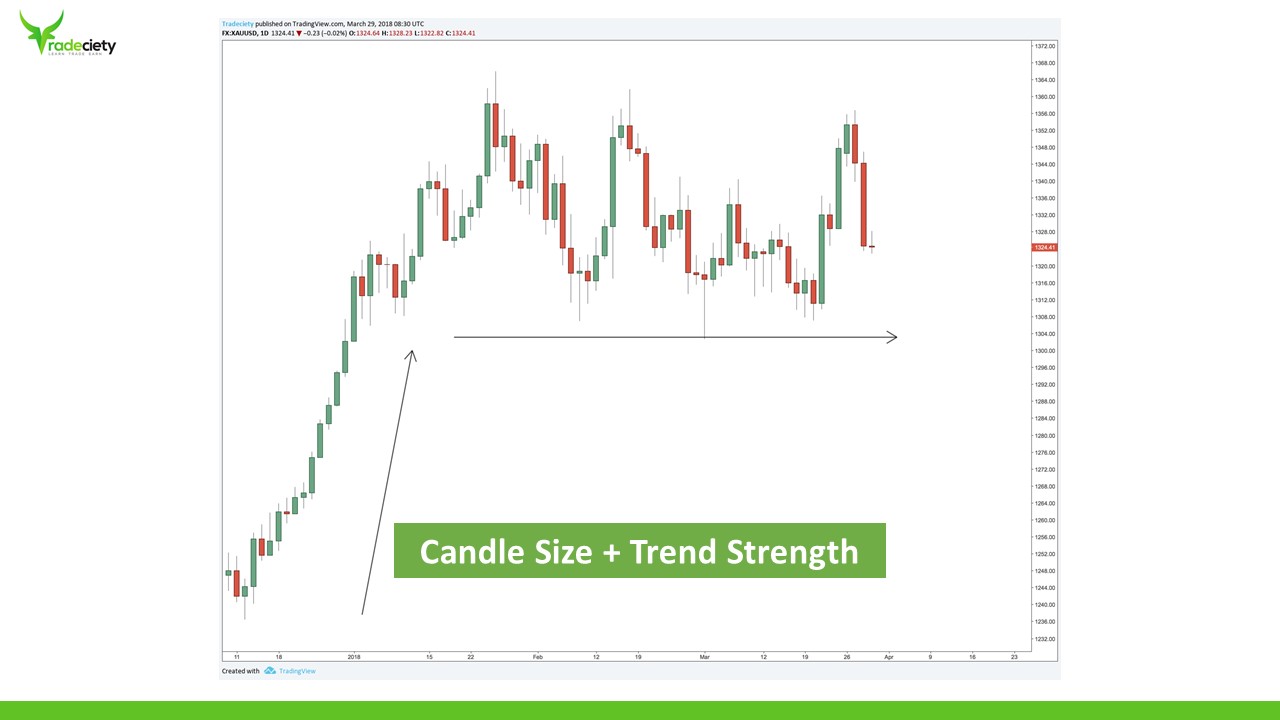
So here, during this up trending phase, you only have bullish candles. The bullish candles mostly close at the very, very top of the candle. And as we’ve seen in the beginning of this video, this means a very strong bullish market. And then here as the market moves into the top, now you can see the candlesticks and the size and the, the ratio changes. Now you suddenly have more bearish candles, you have longer wicks, you have more uncertainty. And this is where the trend really completely died down. So the candlestick size. And also when you see that the ratio between bullish and bearish candle changes, it helps you understand that a trend might be over because the momentum is just fading.
(06:25):
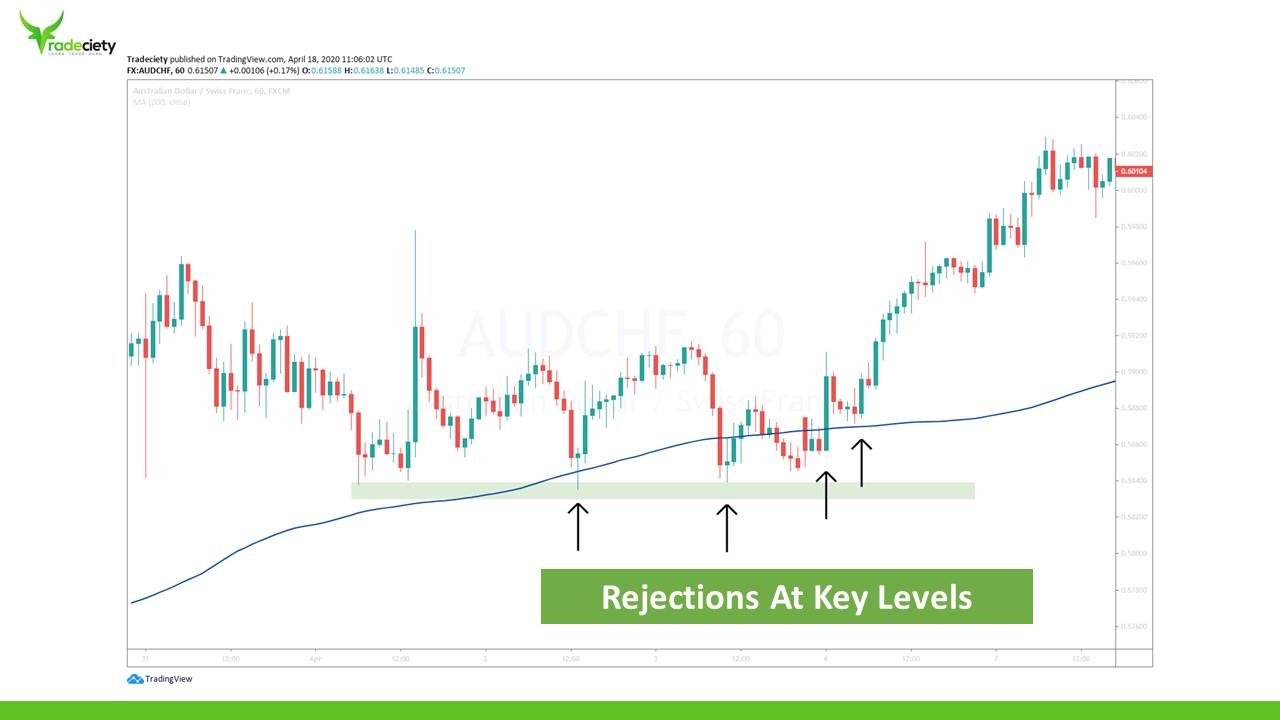
This is going to help us later on as well. Candlesticks can tell you a lot about rejections at key support and resistance levels. So here we are using a long-term moving average. This is the 200 period moving average and also I drew in this support area which was created way back here and then it is used going forward as support level and the way to price traits into those levels can tell us a lot about what is likely going to happen, how are we going to see a breakout or not, whether the level will hold or not. So here on the second time the market is coming back. You can see we have an acceleration first. The candlestick become larger and larger and very, very strong and then as soon as the market reaches the previous low and it reaches the support area, now we go from red candle to green candle.
(07:15):
We also have a have a pin bar here, which shows us that the downtrend is not strong anymore. Now we have a rejection. The bears are not in control anymore. The sellers are not strong and then it reverses to the upside. And then the next time the same thing happens again. We have a smart bearish, a bearish candle larger, larger, even larger. But as soon as the market reaches the previous low, the size changes, we have now a dodgy and now a strong, strong, a bearish or bullish sequence. You may use this information when you see that the market is approaching the level. And once you see that the market and the price action is actually changing, you might go to a lower timeframe to time your bullish entry and then the next time the market comes back to the level, now it doesn’t even reach it.
(08:01):
So now the bearish candles are not even strong enough to push the price that low. And now you suddenly have a huge bullish candle, which we haven’t seen at all during this previous um, range market, which tells us now there are a lot of bias coming into the market. Two or three times the sellers fade to break lower and now the bulls are coming in drive to price higher. And here again strong bullish candles, very weak bearish candles. And then this leads to a complete market turnaround. So we can put all those things together to understand the market is not strong enough to break lower and more bulls are coming into the market that are interested in driving to price higher. So you can see the ratio really changes. Whereas previously we have seen strong bearish candidates, now we are seeing strong bullish candles and the consequences,
(08:49):
then this uptrend. We can also use this knowledge as retest information.

So we have a very strong support level here. The market breaks below the level. It also breaks below to 100 period moving average, a very strong downtrend. And then the market shoots back up into the level very, very strongly. This is a huge candlestick and it looks like the market may fall back into the range. But what happens just underneath this level is very telling. The candles become smaller. Now we have, and even smaller here and we have more bearish candles as well and the market is really stopping just underneath this level here. So this strong candle doesn’t have a follow up and the market really, uh, really just completely dies down. A momentum dies down and there is no attempt, no successful attempt to break higher. And here you can see we have an engulfing candle, a strong bearish candle, which could further confirms there’s,
(09:45):
there’s not a lot of bullish pressure behind this move. The level seems to be holding, the moving average seems to be holding and then the consequence is here, a complete turnaround. So it’s really important and can really help you understand is the level likely to break or not when you just look at candle size and how the candle size changes.
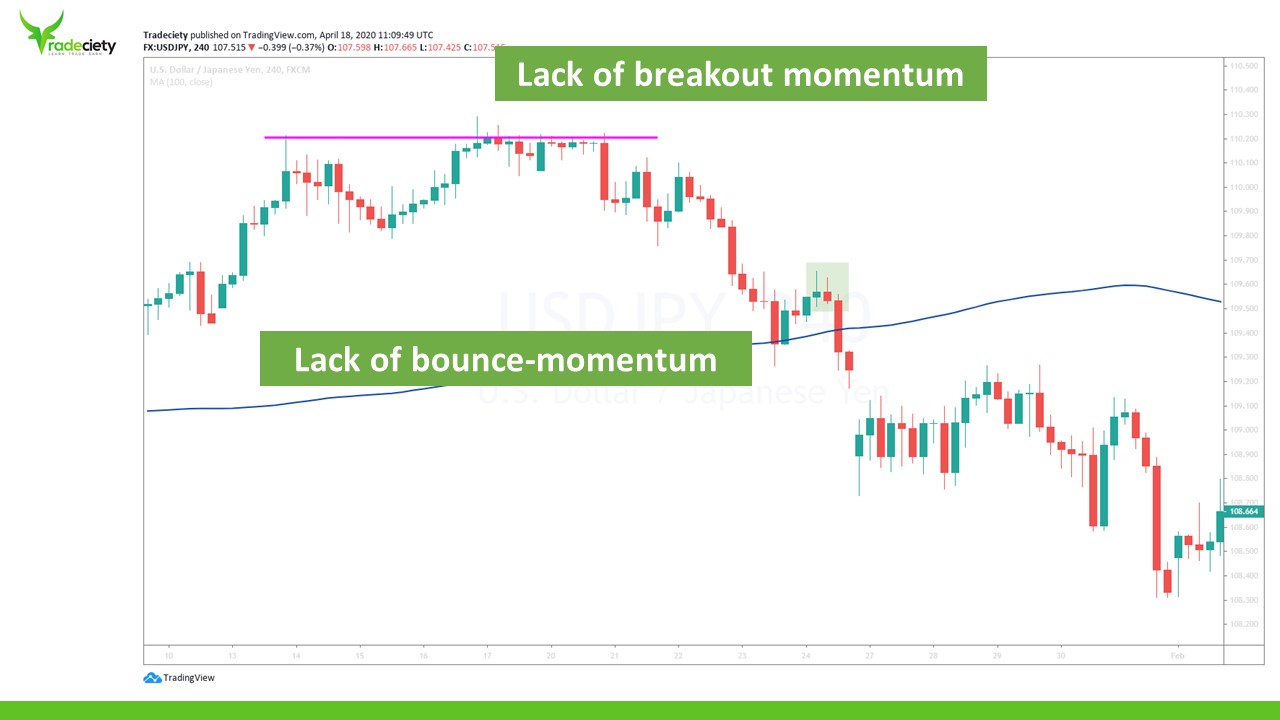
Here we have two very interesting scenarios. First, we have a resistance level here. The market trades back into the level and again, very strong bullish candles then become small. We have a lot of wicks here at the top which shows fed rejections. Although the market is trying to push into the level it’s never succeeding, it’s never able to break and close into a new high. Here you can see we have a lot of doggies, very small tiny candles which show us that there’s not a lot of bullish pressure at all.
(10:33):
The bias are not strong enough. They can really come up with enough momentum and then here, this is the final piece to the puzzle. Now the bulls give completely up. They realize they don’t have the strength here. They break lower. Very, very strong bearish candle. The strongest bearish candle that we have seen here during this whole market snapshot and then the market completely rolls over, starts this downtrend. The market moves back into this long-term period moving average, this is a hundred period moving average, which is a long-term, very important support and resistance level. It looks like first the market is bouncing off the level so it’s not able to break lower. First it, it tries to move higher, but look at what is happening during this little pullback. We have a strong candle and then here the candles become weaker and weaker, very small dodgy candle, another small dodgy candle, and then again the bears take over.
(11:26):
The bias are not strong enough to really start this up trending move. The bears are coming into the market, push a price below the low and then you can see the consequences, this downtrend. So again we can really understand very nicely what is happening during pullbacks. When you look at candle sequence also here below the resistance. A rounding out of momentum is another very important tell of market and price action.
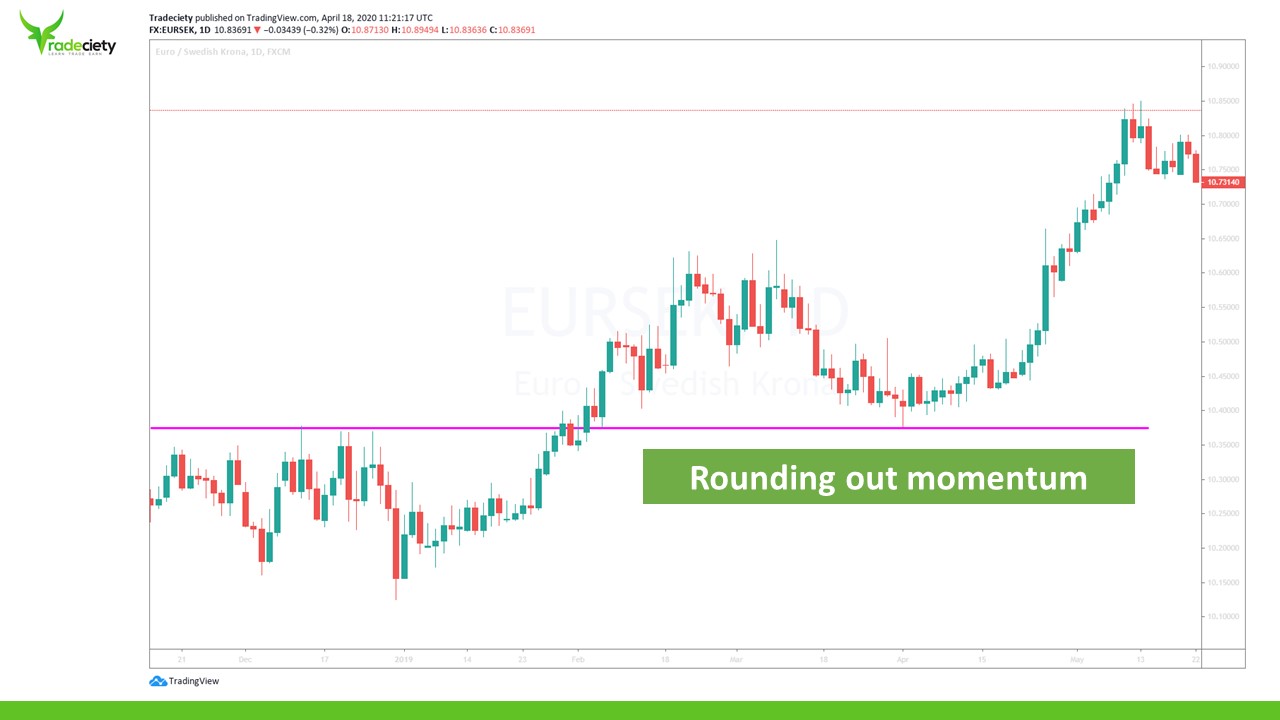
So we have a very strong resistance level that gets broken here. The market comes back into the level and now you see the rounding off momentum. You can see we have strong bearish candles and we have strong bearish candles here. The market is pushing into the level, but what has happened here is very important. The momentum is rounding off. You can see strong push, weaker push, and then at this point you have almost no bearish momentum
(12:17):
at all. Now you can see the market is making higher lows as well and the bulls are taking over so there is no attempt to break this level actually. The bears, the sellers are giving up. They’re not able to bring a price close to the level and instead the bulls are coming in earlier and earlier and driving to price high up and then it leads to a complete explosion and the uptrend is resumed. So at no point was this level challenged, at no point where the seller’s able to push the price back into the range.
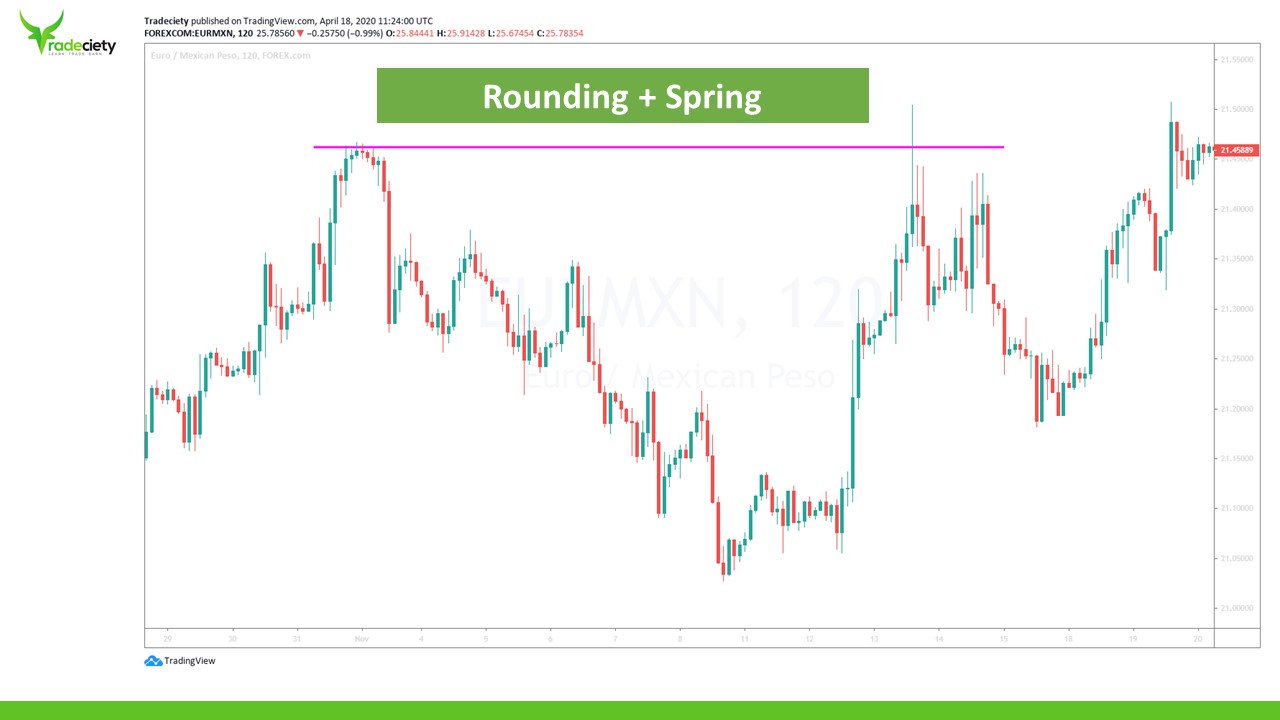
Here we have two of those signals together. First you can see we have the rounding effect where the market jumps higher and has a very, very strong trending market. And then as we reached a top, the candles becomes smaller and smaller and smaller. So we have no momentum. The bears are dying, um, the bulls are dying down, the bulls are leaving the market and then here suddenly we have this acceleration away from the level, very, very strong candlesticks
(13:10):
suddenly when it becomes obvious that this rounding is not going to lead to a higher, um, push. And then you can see the full collapse and then this following downtrend. You can also see that during this pull, pullback phases they start very strongly but then very soon the momentum is fading. You have long wicks, you have rejections, and then the downward resumed strongly. Another pullback strong at first but then the counts become weaker. They round off with a rejection and start a new down trending wave and this happens all the time. This is a very, very common chart pattern that you will see. You need to pay attention to candlestick size, the ratio, how does it change and then here at the right hand side we have the spring pattern. The market comes back into the previous high. It tries to break above it but it fails and you have multiple candlesticks with long wicks and here as well, the market tries to come back and now this time it doesn’t even come close to the previous side, which is already an important tell.
(14:08):
And then the downtrend, here is resumed for a little bit.
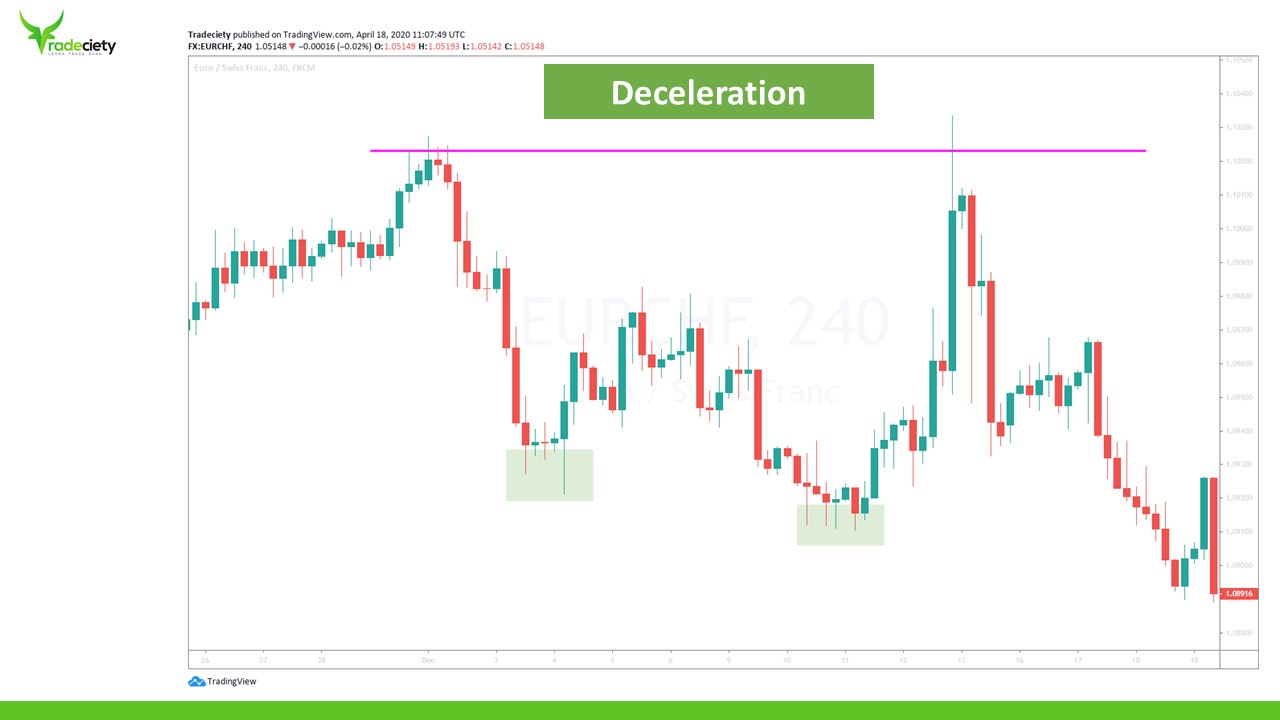
Deceleration. Acceleration. I’ve been talking about this a lot lately in my videos. It’s very important and it can tell you a lot about momentum and price structure. So during this down trending phase, we have very strong bearish candles, but then here we have a small bearish candle. We have three dogies, and then here we have the rejection. The market moves a little bit higher. You can use this information as soon as you see that you have rounding off and you have this outside pin bar that you go to a lower timeframe to time your bullish entries. This is something that we also do in the master class, especially with modern state trading approach. Here we have the exact same principle again. The market moves a little bit lower than the previous low. It rounds off.
(14:54):
We have a lot of wicks to the downside. Whenever you see wicks after a rounding off or during a rounding off, it can tell you a lot about what is happening inside the price structure. Then this new, the uptrend started. Where does the uptrend end, here at the previous high with a very strong rejection after this huge candlestick with a rejection, you have a small bullish candle which shows you that seems like the bulls are really giving up here. They’re not even trying anymore. And then the market completely fully collapses and moves lower.
So I am a really big fan of indicators and indicators can be great too. It’s, but I see very often that people lack of understanding of how to use indicators correctly. So I just want to give you a few example of how to combine indicators and understand what they’re telling you by looking at candlesticks size.
(15:42):
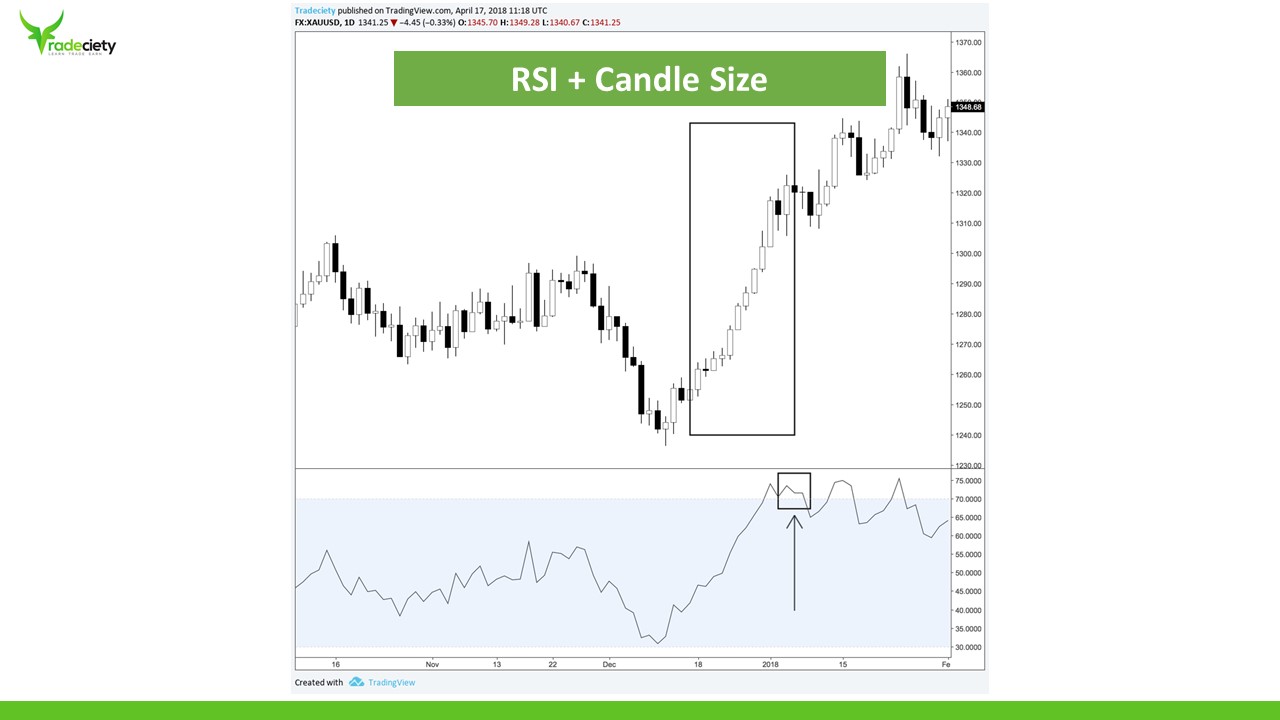
So this is the RSI and the RSI analyzers can list the size and the ratio. So when you look at this example here, you have very, very strong bullish sequence, almost only bullish candles here, very strong bullish candles. The market pushes higher and RSI reaches here a rating of above 70 which means a very strong bullish phase. So the RSI is actually a great information tool and an objective information tool to help you understand what is happening during a market phase. When you see that here for example, when you look at this snapshot, there are roughly equal bullish and bearish candles. There are no trends. You can see that also the RSI is in the middle. Here in this phase, the market is more or less, um, moving lower, quite strongly, not as strong as moving up here, so here we have a rating of maybe 30 or just above 30 and this shows us that the momentum is here to the downside.
(16:40):
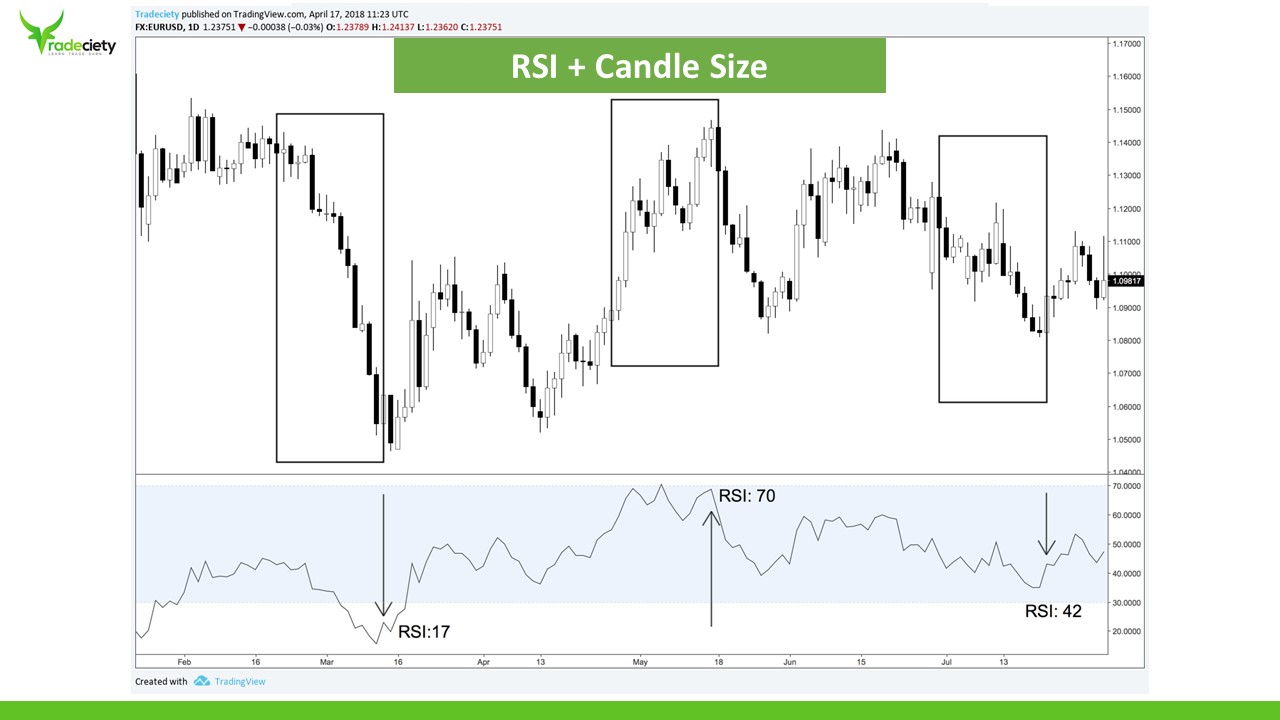
Here we have a few more examples to emphasize the point of the RSI. During a strong down trending market, you can see that very strong bearish candles, the bearish candles are almost always closing at the very low of the candles, not leaving a strong wick. That RSI is reading here at 17 and even lower here. Here you have a strong bearish phase, a strong bullish phase, but there are also some bearish candles in between. The RSI is reaching a level of below 70 here. It is not a very strong market where you would see an RSI of above 80 but it’s reasonably strong. And here we have more or less a sideways phase with a small bearish tendency. So from here to here the market is moving lower but it’s not moving as low as it did here. So here we have a much sure weaker trend and you can see the RSI, it is below 50 which means that you are more or less in a bearish market but it’s only at 42 so it’s not a very strong bearish trend.
(17:40):
So I hope you enjoyed this guide about candlestick trading. I hope you have something to take away from it, that you can apply on your own trading. Be open also to indicate us, really understand what they are telling you. Look into the formula to try to understand how the indicators are dissecting price action. And if you liked this video, if you want to know more about a certain concept, let me know in the comments below. Please leave a thumbs up. Share with your trading friends.


external link:


3 min read
“95% of all traders fail” is the most commonly used trading related statistic around the internet. But no research paper exists that proves this...

3 min read
Trendlines can be great trading tools if used correctly and in this post, I am going to share three powerful trendline strategies with you.

3 min read
Choosing the right trading journal is essential for traders wanting to analyze performance, refine strategies, and improve consistency. In this...