3 min read
Scientist Discovered Why Most Traders Lose Money – 24 Surprising Statistics
“95% of all traders fail” is the most commonly used trading related statistic around the internet. But no research paper exists that proves this...

Trend trading strategies are great because their main concept is easy to understand, although the trading process itself can’t go without strict discipline.
For those unfamiliar, trend trading strategies, also known as trend following strategies, aim for the continuation of the existing trend… and yes, ideally, there is a clear trend – that’s the key prerequisite for this trading approach. In other words, if you see that the price is ascending, you go long. If the price is bearish, you go short. That’s how simple it is… well, in theory.
Even though trend reversals come with many trading opportunities, trend-following traders must be very cautious of them. In the best-case scenario, the trend continues in the same direction for as long as possible to provide great trading opportunities. However, we know currency pairs don’t behave like that, which is why we have to rely on technical indicators to prevent reversals from spoiling our party.
That being said, here are the four trend trading strategies that I like the most:
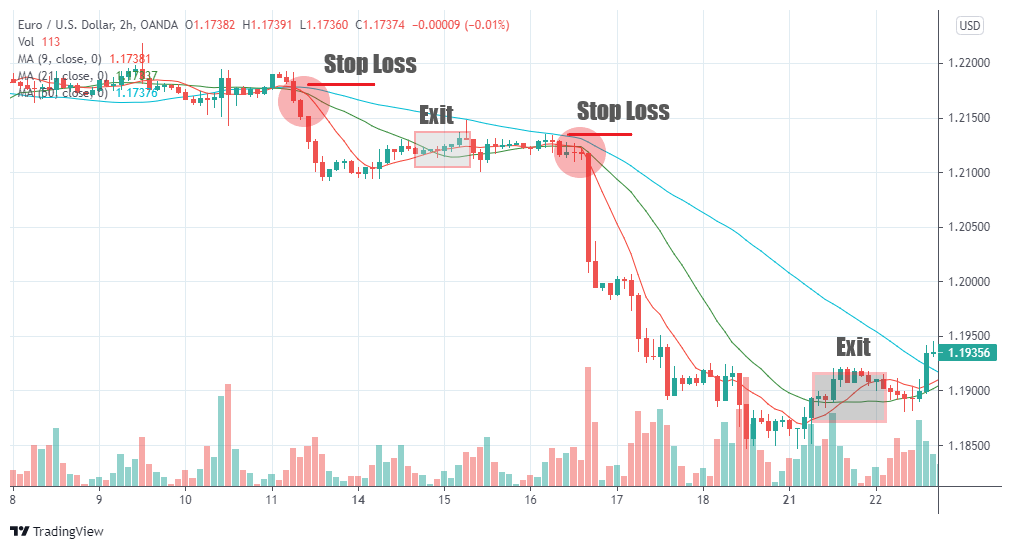
This strategy is suitable for beginners because it’s simple and provides objective signals. Also, it uses the most popular technical indicator, which is the Moving Average (MA). We’ll use three Simple Moving Averages (SMAs). Remember that MAs are lagging indicators, i.e., they reflect the historical price movements rather than magically predicting the future.
For this strategy, I prefer to use three SMAs with periods 9, 21, and 50. You can use another configuration with similar proportions, such as 10, 20, and 50. This strategy usually works well on any timeframe and any market. Thus it can be used by swing traders and day traders alike.
Here is how the strategy works:
Naturally, this is a more simplistic view of a moving average trend trading strategy but the general idea is that the crossing of the moving averages provide directional information and also provide an objective way to visualize momentum.
And don’t forget: always practice on your demo account first, use stop loss orders at all times and apply conservative risk management principles.
For this strategy, we’ll use Bollinger Band indicator (BB), the technical indicator created by John Bollinger about four decades ago. We’ll also add an Exponential Moving Average (EMA) with the period 50, which will play the same role as the 50 MA in our previous strategy.
Some traders prefer to simply go long when the price fluctuates above the BB’s mid-band and go short when the currency pair keeps moving below it. However, we’ll add more confluence factors to get more robust signals.
Here are my rules for the bullish scenario (the vice versa is valid for the bearish market):
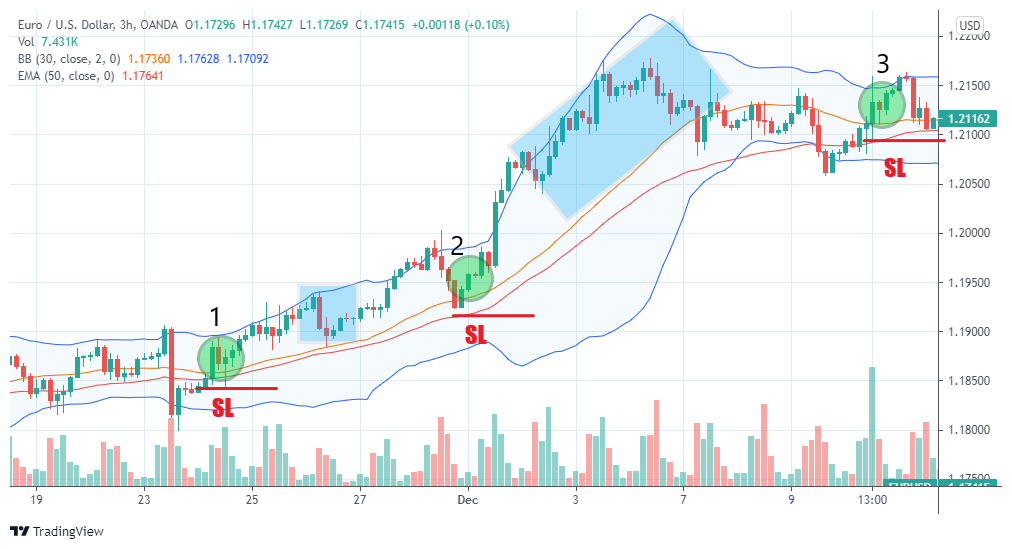
In the screenshot above, the first two bullish signals (1 and 2) proved to be profitable, but the third one (3) failed to satisfy us. This shows that nothing works 100% of the time and it highlights the importance of cutting losses and moderate risk management.
As for the take profit, you could exit the market right after the first pullback from the upper band, but you can wait until the price clearly corrects and gets closer to the mid-band (blue area).
The MACD (Moving Average Convergence Divergence) is one of my favorite technical indicators because it can act both as an oscillator and as a trend indicator.
MACD can be used in several ways, but for this particular strategy, we’re going to look for crossovers. Here is how you should set your chart:
I prefer to use this strategy with any timeframe between M30 and D1.
Again, we use the slow MA to define the general trend direction. Based on our strategy, we should look for bullish opportunities when the price is fluctuating above the 200 MA. In a similar fashion, we’ll consider bearish opportunities when the price is moving below the 200 MA.
Here are the main conditions for opening short positions (for longs, use the opposite rules):

In the example above, we get five bearish signals with our strategy in a relatively short period. And, once again, not all situations would have provided a profitable outcome. We can’t stress the importance of risk management and cutting losses enough in this context. Furthermore, a new trend trading strategy should never be used in a live market environment and always tested on demo first!
Besides using technical indicators, there are some great strategies that rely on chart patterns. For me, the simplest and most powerful trend continuation patterns are the triangles, although not the symmetrical ones.
The ascending and descending triangles suggest that the existing trend will continue in the same direction after a moment of tension between bulls and bears. For the sake of convenience, we’ll discuss the ascending triangle, and you can use the same principles for the descending triangle but obviously with inverted conditions.
In a nutshell, the ascending triangle shows up when the price forms a flat upper resistance line and an ascending lower trendline that is made up of higher highs. The descending triangle is formed from a descending upper line and a flat lower line.
When you spot that the ascending triangle is in the process of formation, it shows you the uptrend finds strong resistance from bears, which is reflected by the flat resistance line. Impatient traders will often get in too soon but waiting for a confirmed breakout may provide a more robust trading approach.
You may set the stop loss in line with the most recent swing low and aim for a take profit that is equal to the distance formed by the first leg of the triangle as shown in the screenshot below:
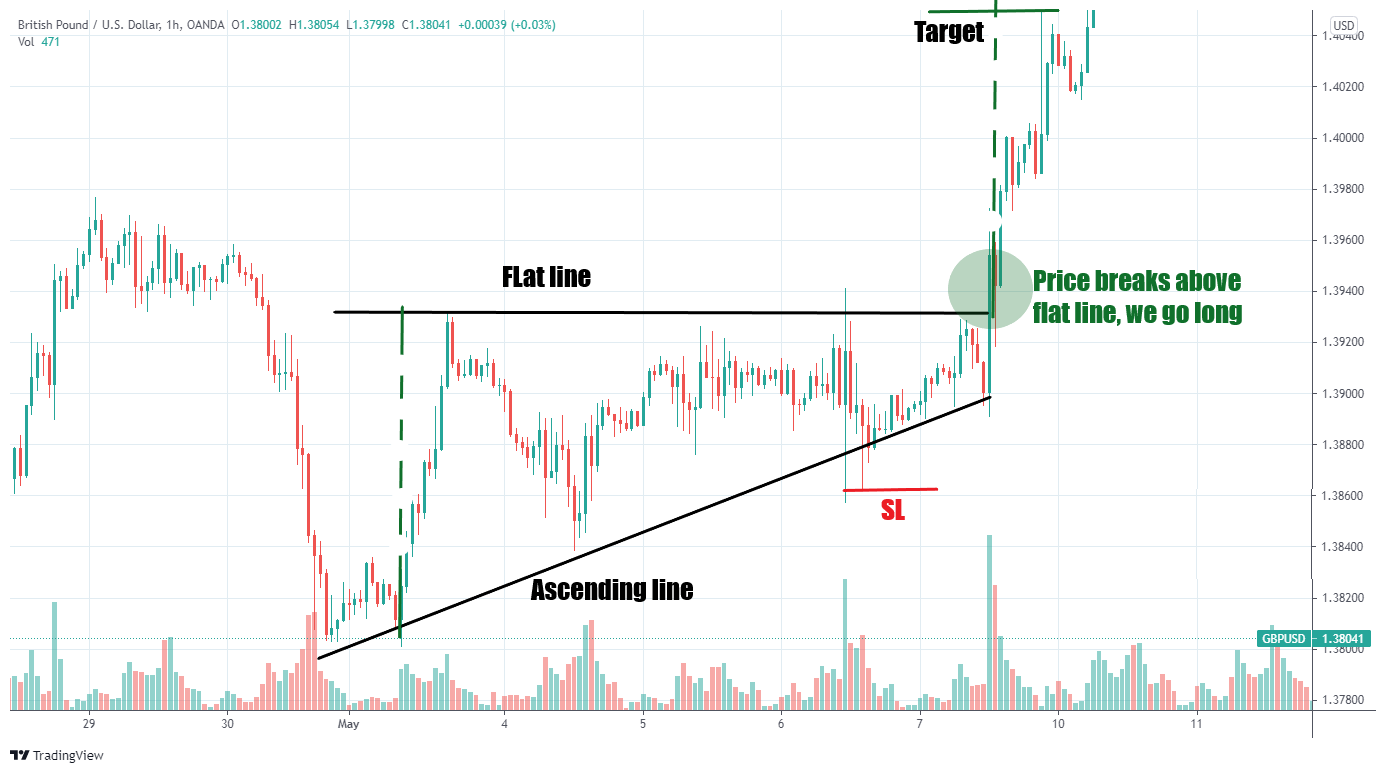
This strategy is simple to implement if you can accurately spot ascending and descending triangles, which is not a big deal. Make sure that the resistance level isn’t cutting through any candlestick bodies – however, cutting through the wicks may be ok.
Of course, you could layer other confluence factors on top of any of the discussed trend trading strategies. For example, a higher timeframe analysis can easily be applied to any of the mentioned strategies and act as an additional rule to filter out specific trading signals.
That’s it for today! I hope you enjoyed these simple yet effective trend trading strategies!


external link:


3 min read
“95% of all traders fail” is the most commonly used trading related statistic around the internet. But no research paper exists that proves this...

3 min read
Trendlines can be great trading tools if used correctly and in this post, I am going to share three powerful trendline strategies with you.

3 min read
Choosing the right trading journal is essential for traders wanting to analyze performance, refine strategies, and improve consistency. In this...