3 min read
Scientist Discovered Why Most Traders Lose Money – 24 Surprising Statistics
“95% of all traders fail” is the most commonly used trading related statistic around the internet. But no research paper exists that proves this...

Let’s talk about trading strategies and in this article, I am sharing 5 trading strategies that I use or have used in my own trading. Each trading strategy can be traded by itself and you could also combine different ones.
Each trading strategy consists of multiple confluence factors to provide robust signals. Of course, one can add more triggers and criteria to this approach.
The first strategy is a cross-over system with an RSI tiebreaker.
I used a 20 and 40 period SMA but you can use any combination. Here some inspiration:
| Moving Averages | Trading Style |
| 10 and 20 | Short-term day trading |
| 20 and 40 | Medium-term trading (best for 1H and 4H) |
| 50 and 100 | Longer-term trading (best for 4H and Daily) |
| 100 and 200 | Swing trading (Daily and Weekly) |
I use a 14 period RSI indicator as a trend tiebreaker. When the RSI is above the 50 level (orange line), you only look for bullish signals. And when the price is below the 50 level, you only scan for bearish cross-overs.
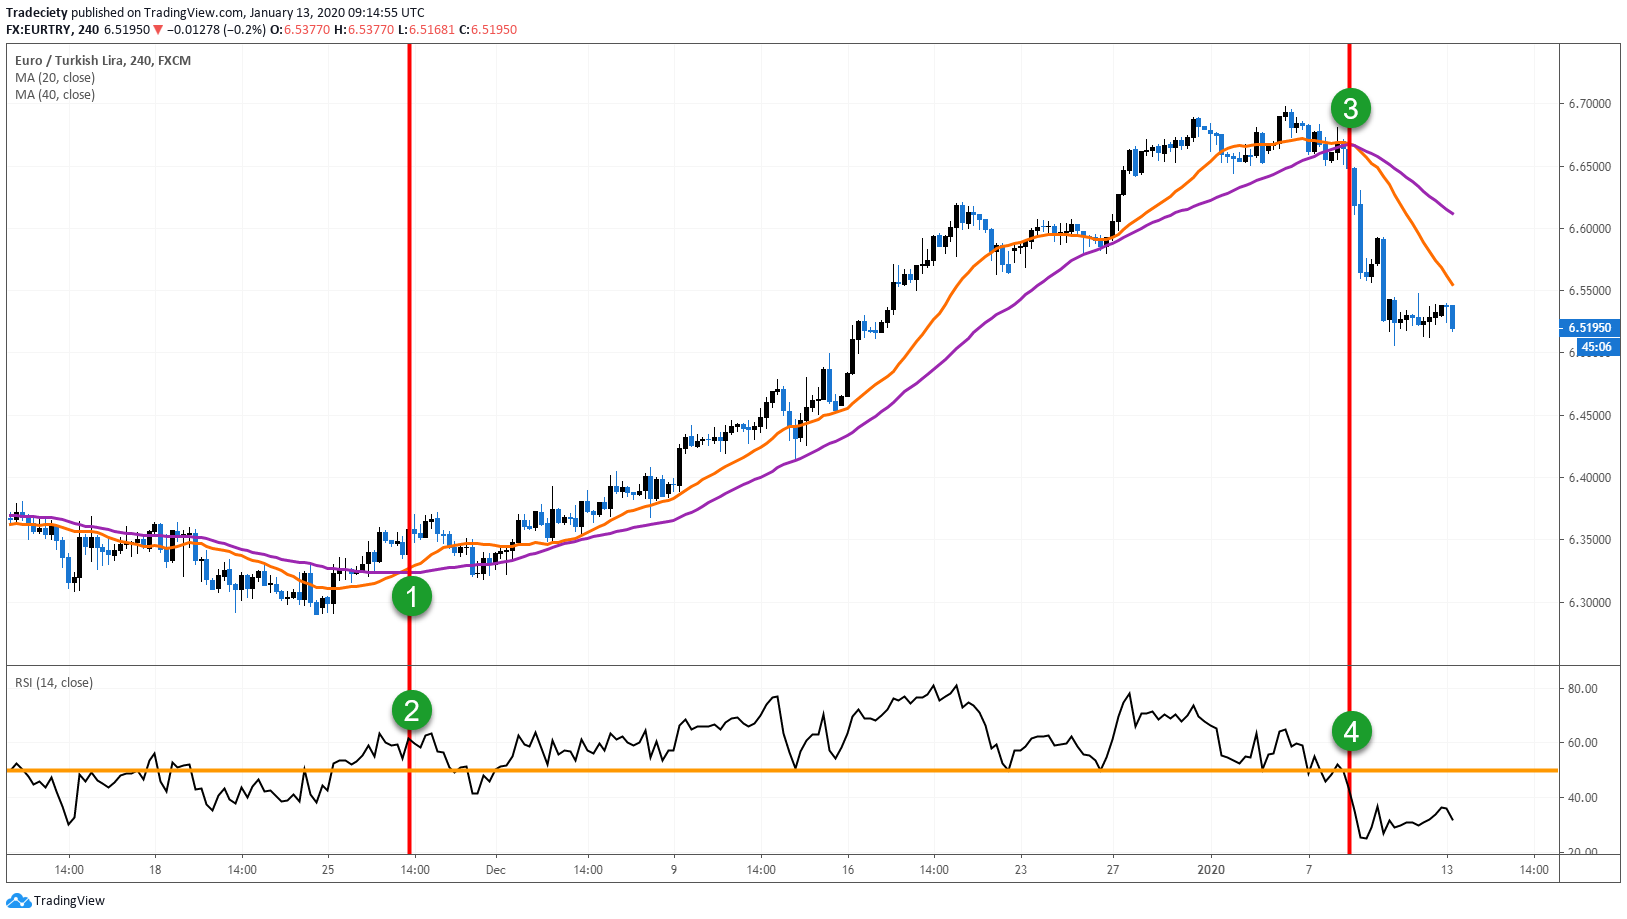
Let’s take a look at the situation below and I will go through points 1 to 4.
1. The short-term moving average crosses above the longer-term MA. This is a bullish signal because it means that the short-term prices are rising over the longer-term prices. It signals bullish momentum.
2. The RSI is trading above the 50 level which means that it would have been OK to follow the bullish cross-over signal. The RSI is, therefore, a filter tool. If the moving averages cross into a bullish signal but the RSI is below the 50 level, a trader would not open any long trades.
3. The next moving average cross-over to the bearish side happened here. Although the moving averages came close to crossing before, you must wait for a confirmed cross.
4. The RSI dipped below 50 with the crossover, confirming the bearish signal.
Of course, you can layer more criteria on top of those two. For example, a trader can add trendline or horizontal breakouts to the strategy. Or even add a longer-term moving average as an additional trend direction filter.
I put together more trade studies for you below.
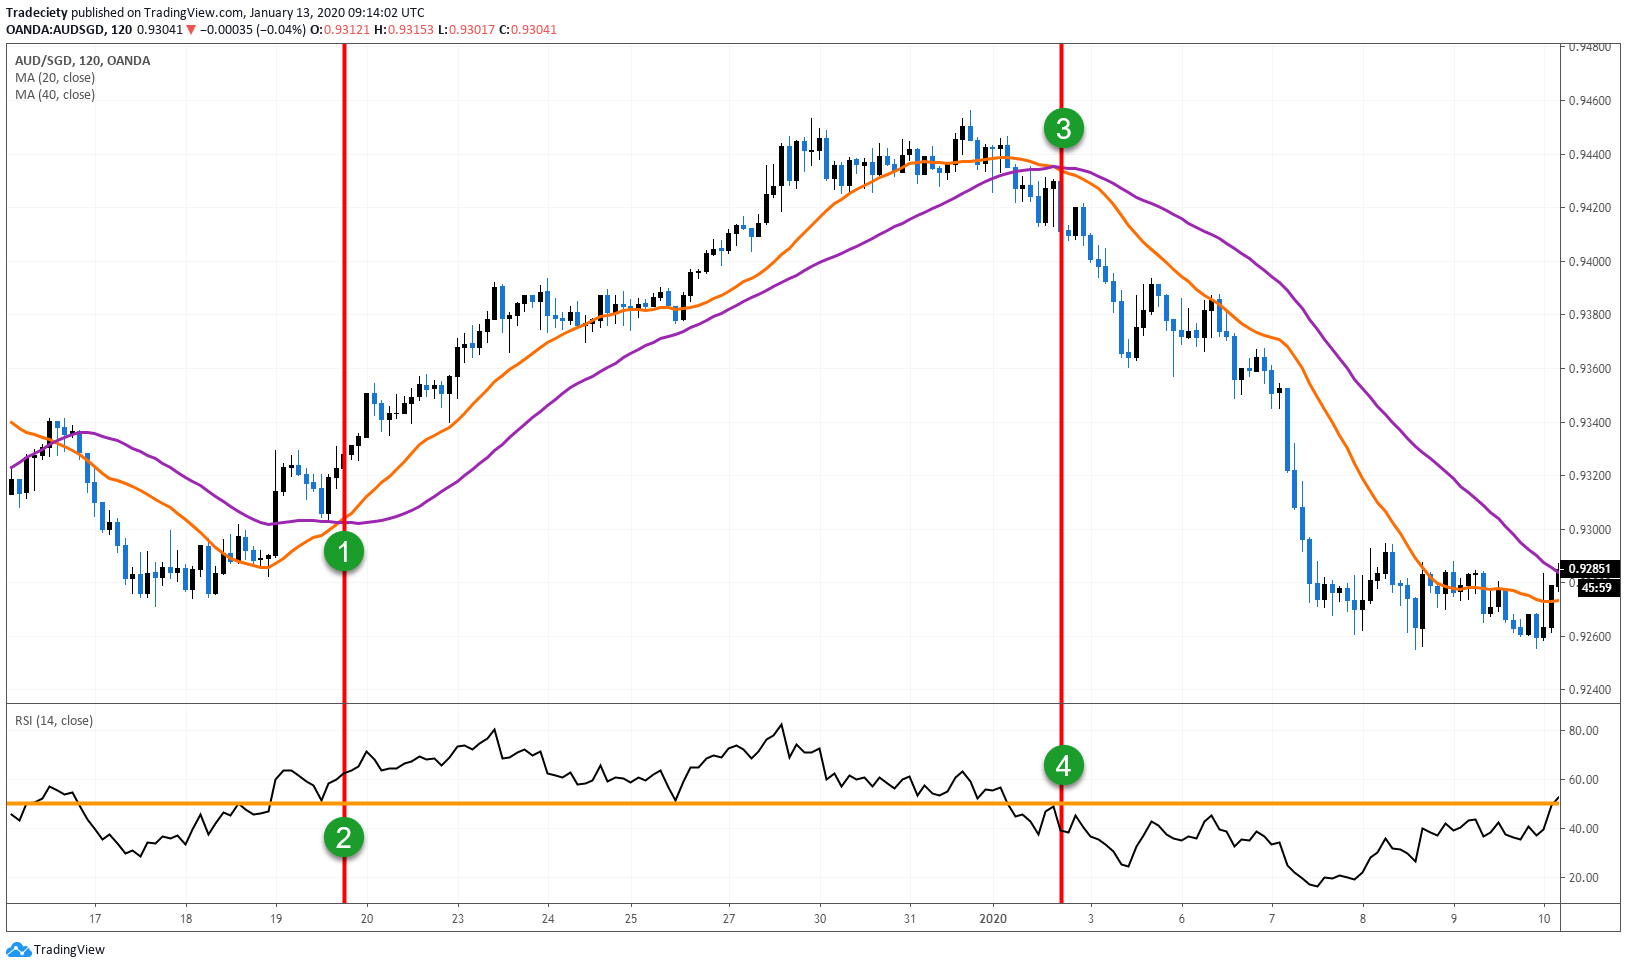
At point (1), the moving averages crossed bullish. The price was trading above the moving averages before already, but you must wait for a cross of the moving averages. When the moving averages crossed, the RSI was already above the 50 level, confirming the bullish trend signal.
By now you can probably already follow the system and understand how a bearish setup was created at points 3 and 4.
I do not recommend to just start trading this approach blindly. Instead, try it out on a demand account and get a feeling for how the components work together. You may want to make alternations or add different tools to this approach.
Also, make sure to consult my latest article about stops, targets, and winrate when it comes to choosing the right parameters for your trading approach.
I used to trade spikes a lot. For that, I set the Bollinger Bands(r) to 2.5 standard deviations to create a wider channel. With a wider channel, a price spike through the channel is more meaningful and a significant event. You could even set it to 3 standard deviations to filter out more price action and find bigger spikes.
A spike alone is not enough and I recommend adding a candlestick filter on top of it. A spike that comes with an engulfing candlestick or a pinbar usually provides more robust trading scenarios.
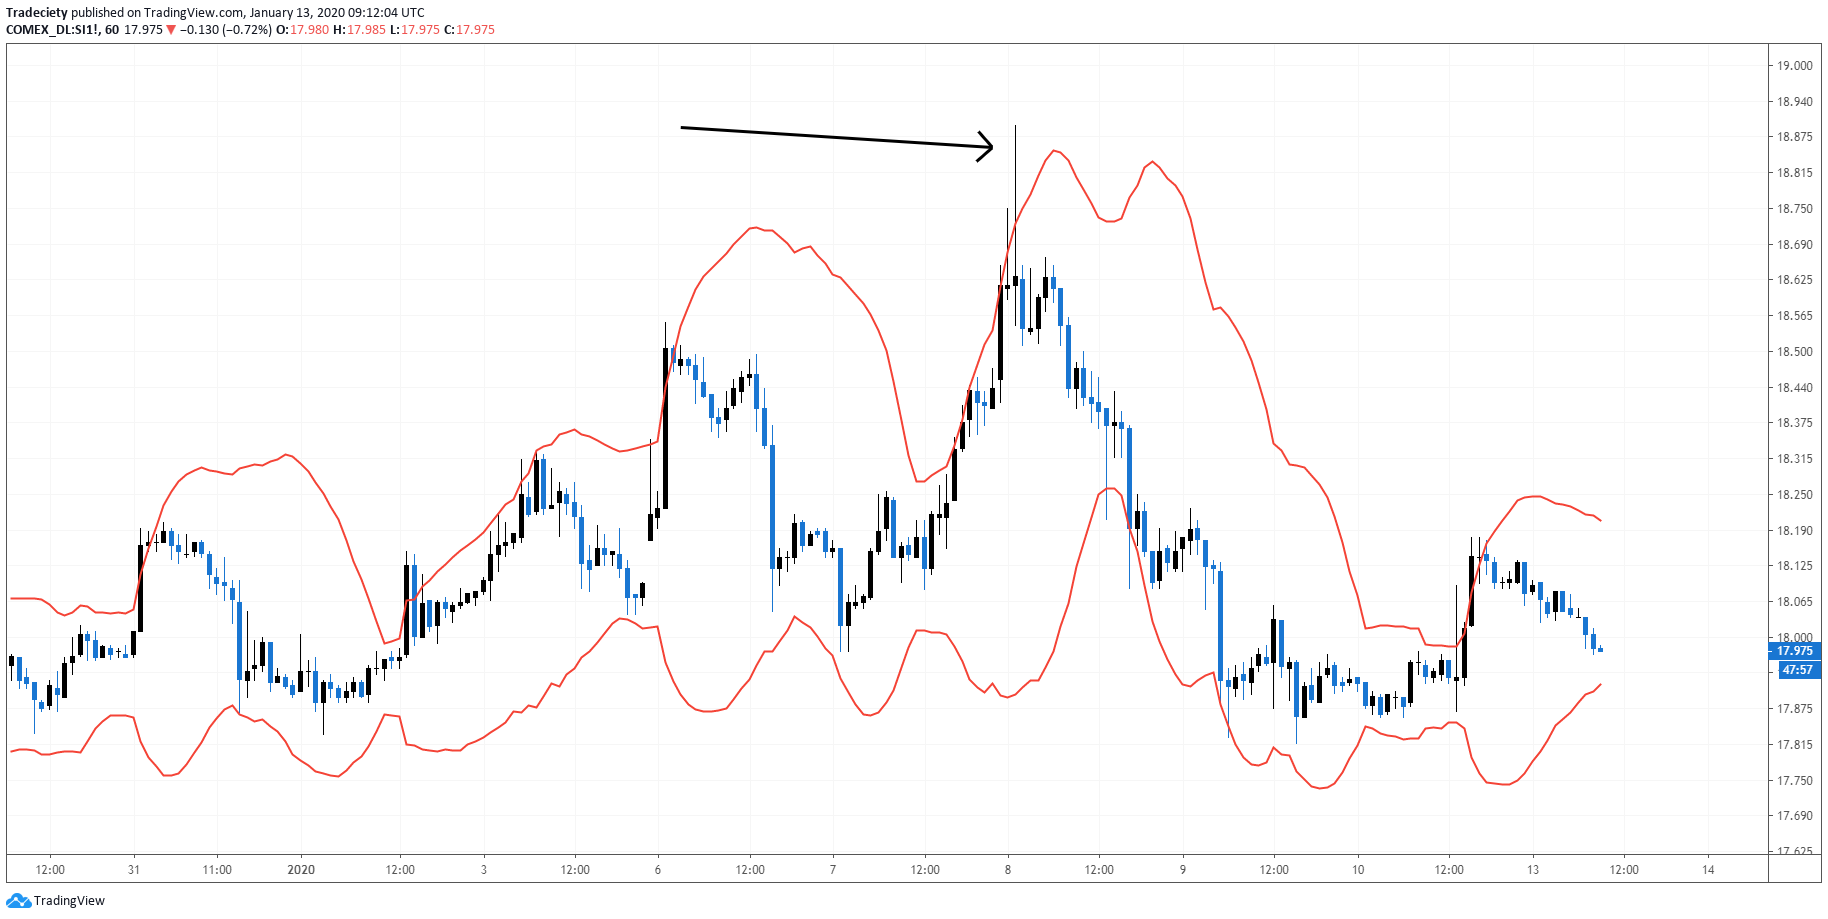
In the example below, the price made a significant spike through the upper band and immediately retracted back inside the channel. The fact that the price closed back inside the channel is another key component. During strong trends, the price will sometimes close outside or very close to the outer bands. You must avoid those situations and wait for a complete rejection.
In this scenario, the spike happened as a pinbar and, therefore, provided at least 2 confluence signals: a channel spike + a candlestick confirmation.
In the scenario below, we can see a spike, a pinbar and also the confluence of a previous support area.
The hardest part when it comes to using multiple confluence factors is passing on trades where you are missing just one. Let’s assume you see a great spike but no other confluence factor. In such scenarios, you must skip the trade even though it may look very tempting. But if you built a system that requires additional confluence signals such as a candlestick pattern and maybe even a signal at a previous support/resistance area, you have to follow the rules and skip the trade. This is where many amateur traders can’t sit on their hands but it is absolutely crucial to only trade when you have a complete trading signal.
Therefore, write down your trading rules and put them where you can see them all the time during your trading. It is a constant reminder of what you are looking for.
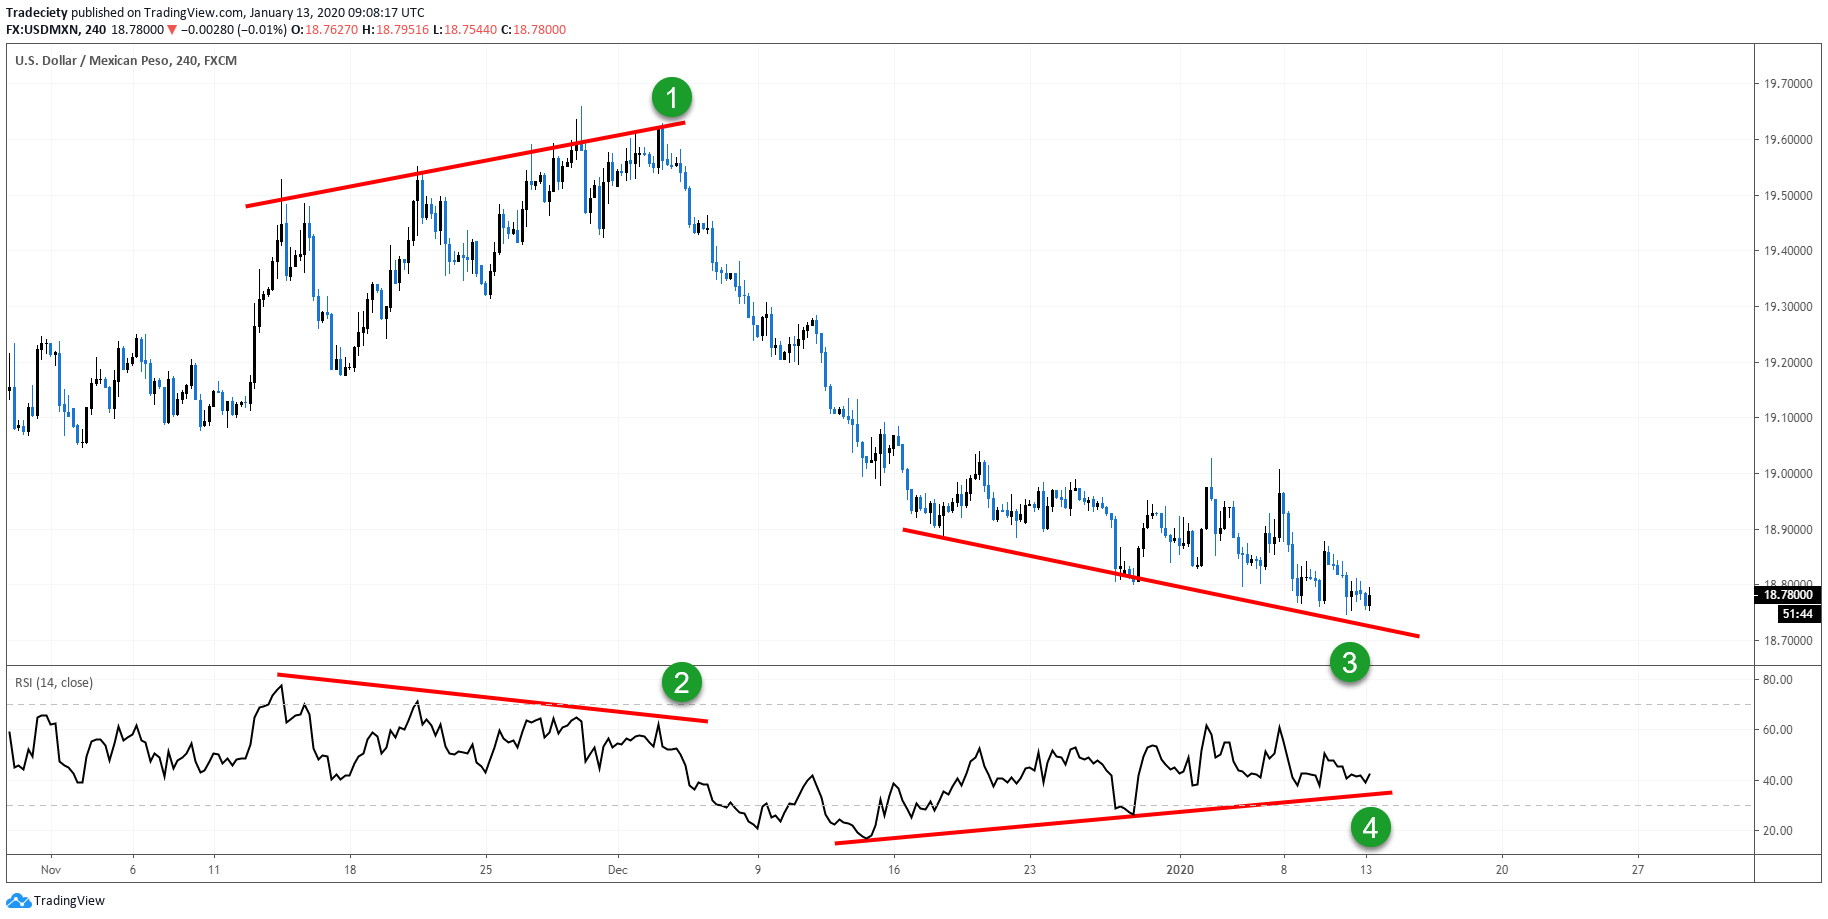
Divergences are one of my favorite tools and I have been using divergences for years in several of my trading strategies. I discussed the concepts of divergences at length in other articles.
In the screenshot below, the price made a quadruple divergence at point 1. The price made 4 consecutive high points (2), but the RSI made 4 consecutive lower lows.
As of writing this, the price made multiple consecutive lower lows (3) and the RSI is making higher lows (4). This indicates that the trend is losing strength.
Of course, this is not enough to enter a trade because the price can keep trending for a long time even though it shows a divergence. As with all trading strategies, we need to add additional confluence factors to a divergence strategy.
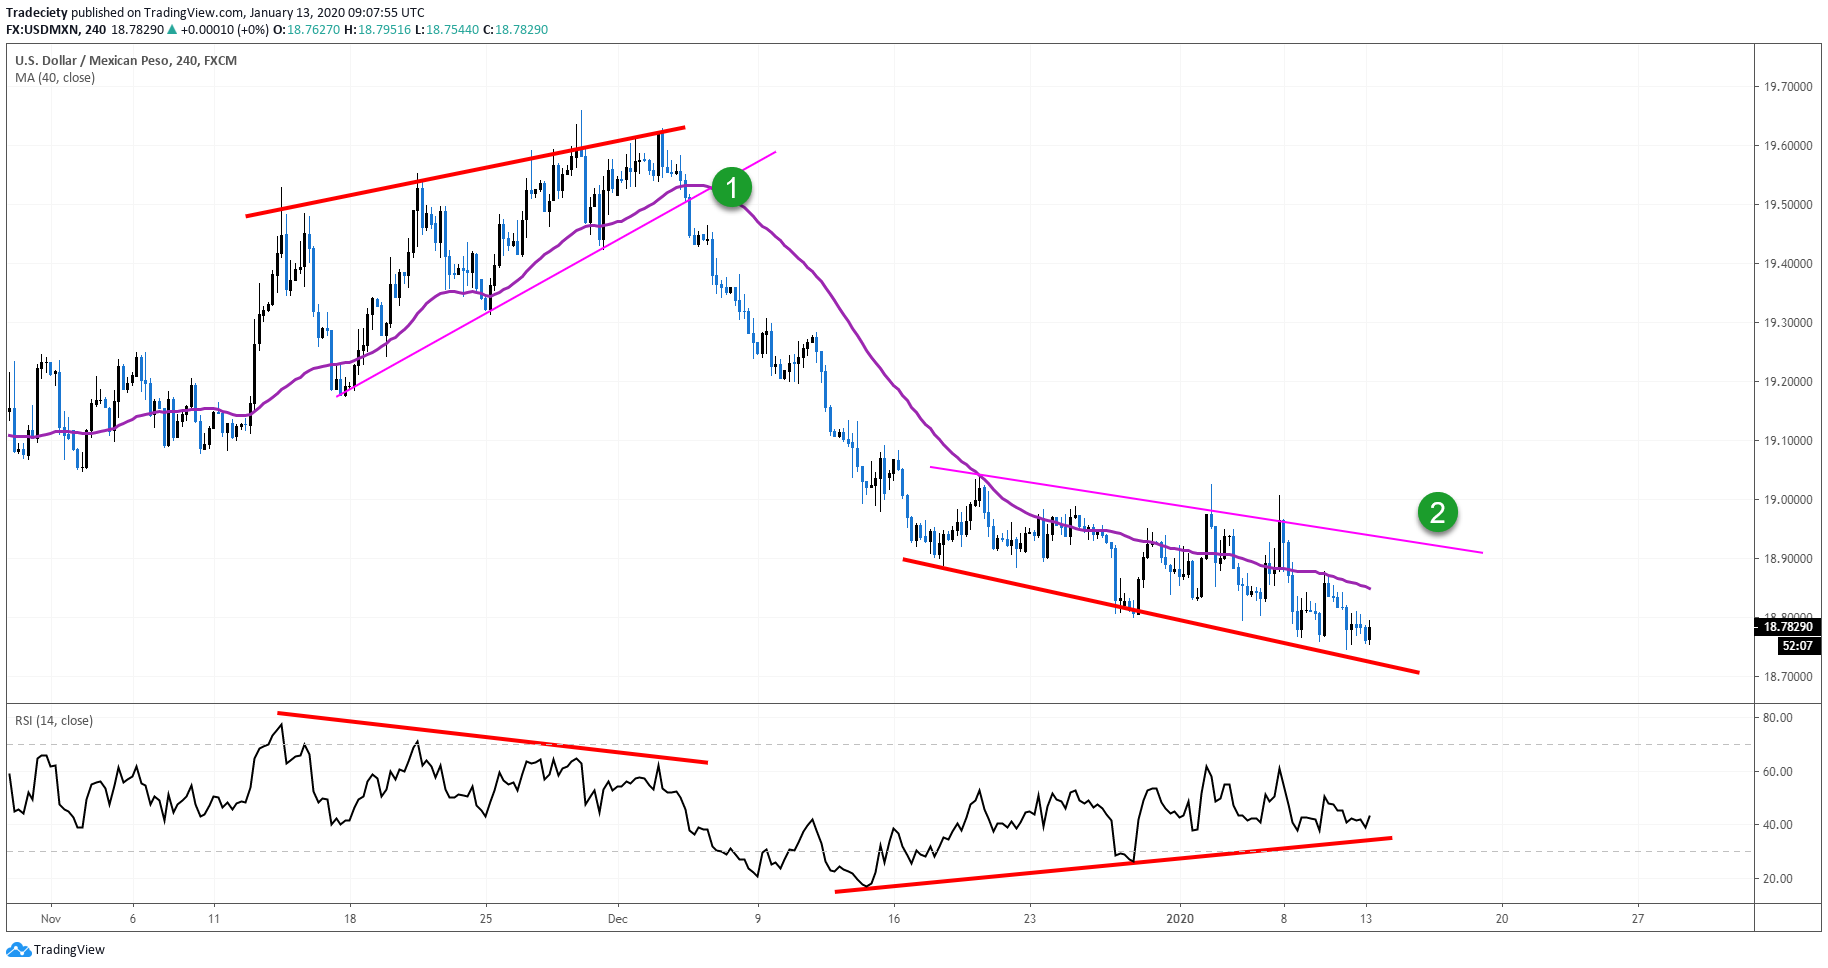
The screenshot below shows the same scenario from above but this time I added a 40-period moving average and trendlines; we will discuss trendlines as strategy 5 in this article.
The length of the moving average matters here a lot and you can see that the price violated the moving average multiple times during the uptrend on the left. Hence, a longer period moving average would have been a better choice for such a volatile market.
The trendline at point (1) worked well and it wasn’t until the trendline was broken that the trend actually turned bearish.
The current trendline at point (2) hasn’t been broken yet and, therefore, no bullish signal was provided. As mentioned earlier, just a divergence by itself is not a strong enough signal and the trendline confluence factor works well in this scenario. Now, a trader would simply wait for a strong breakout of the trendline before looking for buying opportunities.
Horizontal breakouts are among my favorite trading concepts and especially for new and struggling traders, spotting horizontal levels is usually much easier because they are very objective.
A good horizontal level is validated after the second touchpoint and with every subsequent touch, a level gets progressively weaker.
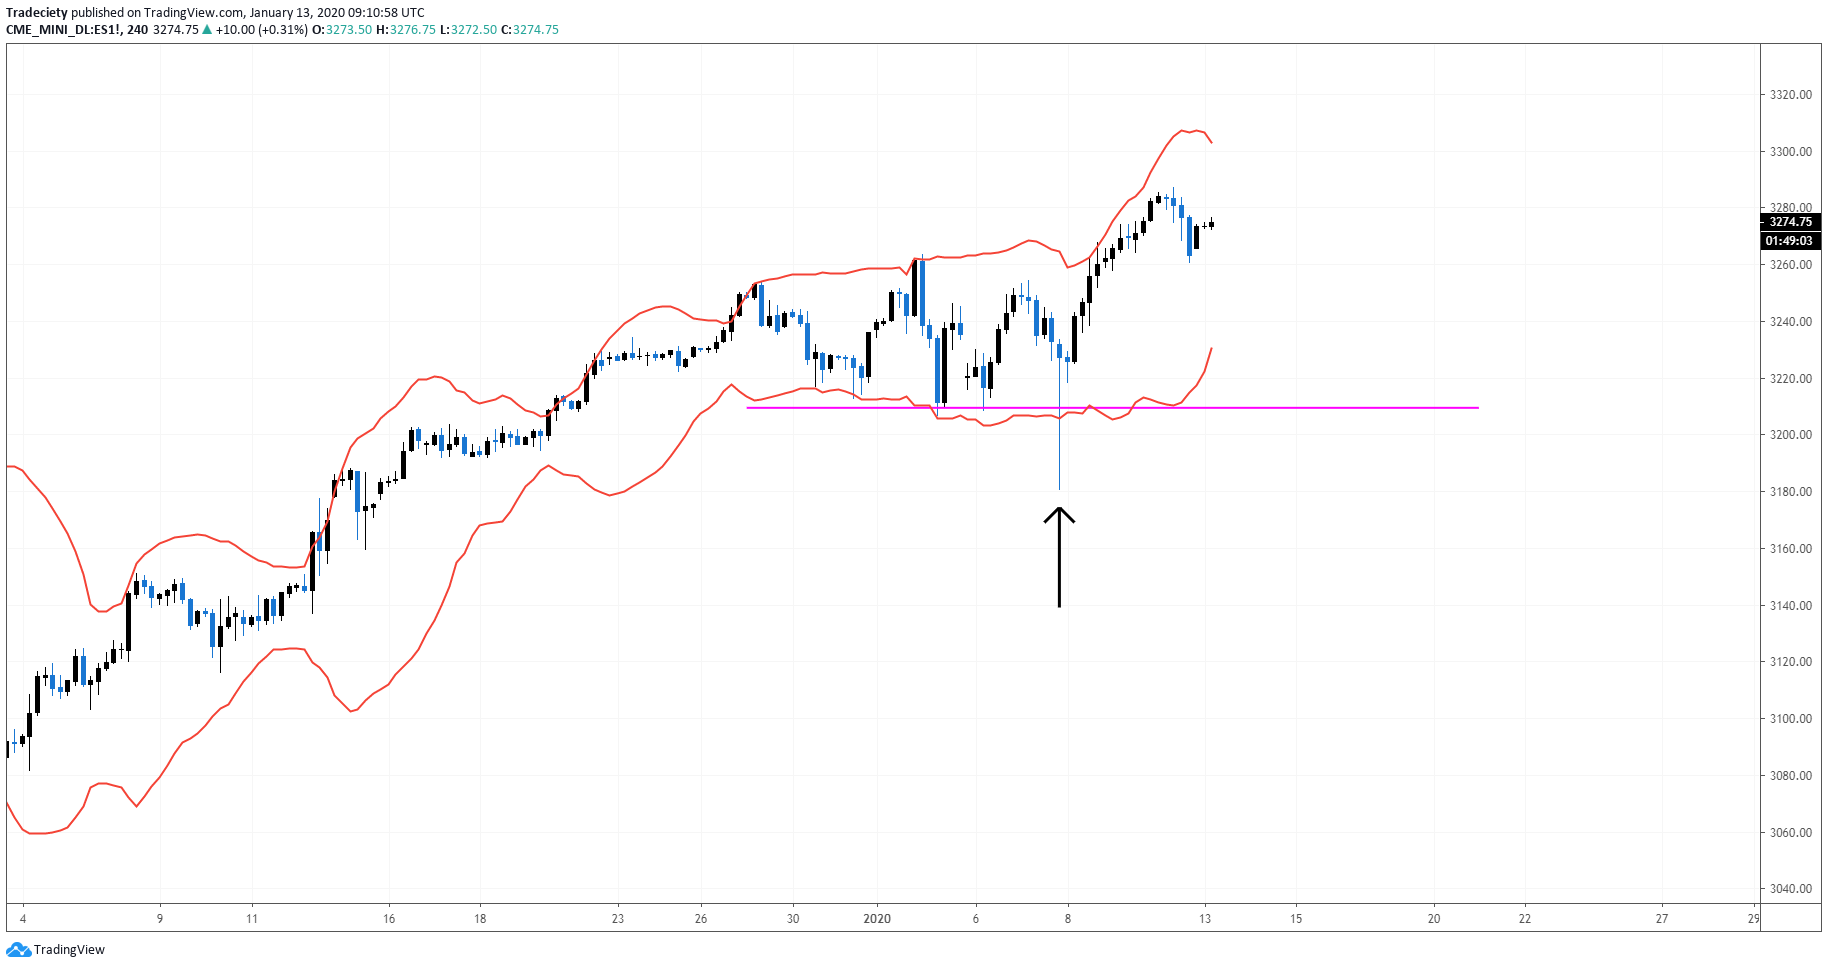
In the screenshot below, the horizontal resistance level at point (1) has around 5 touchpoints. Such a level has a high likelihood of breaking. Even more so, just before the breakout, the price was “sticking to the level” which means that the sellers were not able to push the price lower and the buyers came into the market more and more. In my trading, I call this concept a “lower bounce” and it often foreshadows a high probability breakout.
Once the price has broken out of the sideways range, a trader would wait for short consolidations that allow you to draw horizontal levels at the top. Points (2) and (3) are great examples here. Such consolidation phases are often used to time trend-following entries and I talked about this in the past in my pullback-strategy guide.

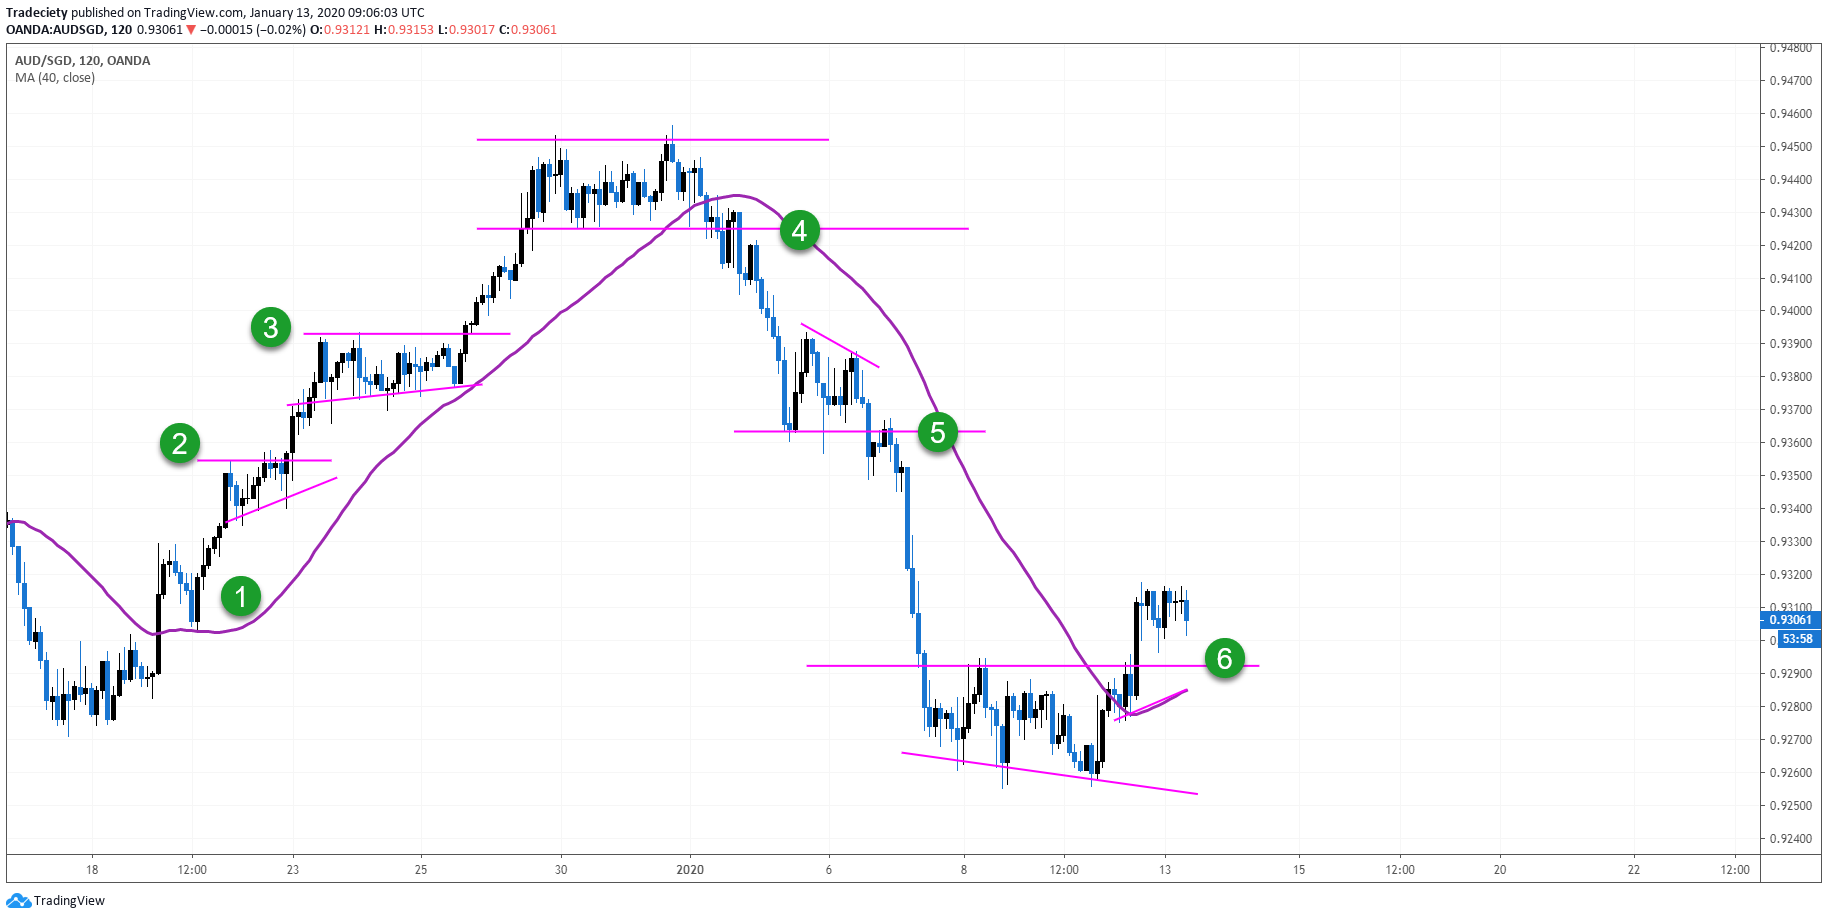
To improve the robustness of trading signals, one could add a moving average to the chart as shown in the screenshot below.
The moving average acts as a trend direction filter and one would only look for trades into the direction of the moving average.
At point (1), the price crosses above the moving average and the trader would start looking for bullish opportunities. Such trend-following scenarios occurred at points (2) and (3) when the price made sideways consolidations where it was possible to draw a horizontal resistance level at the top. The price stalled shortly during those sideways phases and the breakout signaled the continuation.
At point (4), the price crossed below the moving average and it also broke out of a sideways range that market the top of the uptrend. Often, such top patterns also show divergence signals and one could add an RSI indicator as a third confluence factor.
At point (5), the short sideways consolidation with a horizontal support level broke and because the price was below the moving average, the trader would look for bearish opportunities.
At point (6), the market made a bottom pattern with a horizontal resistance level and the breakout happened simultaneously with the cross of the moving average.
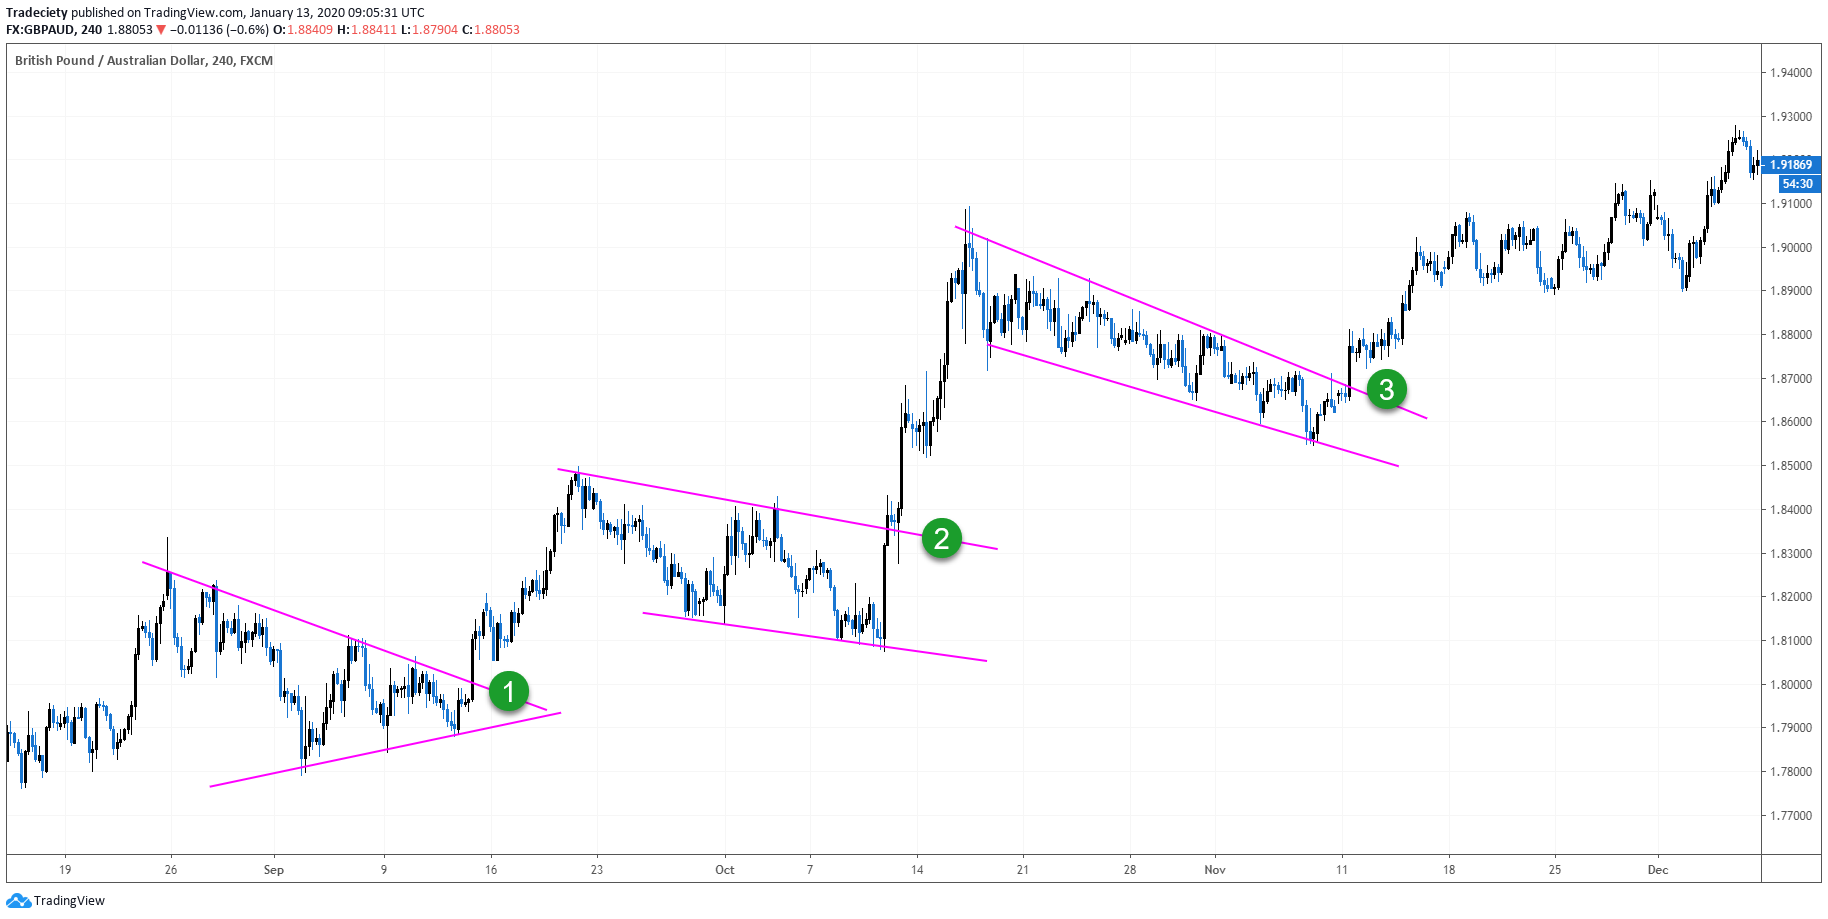
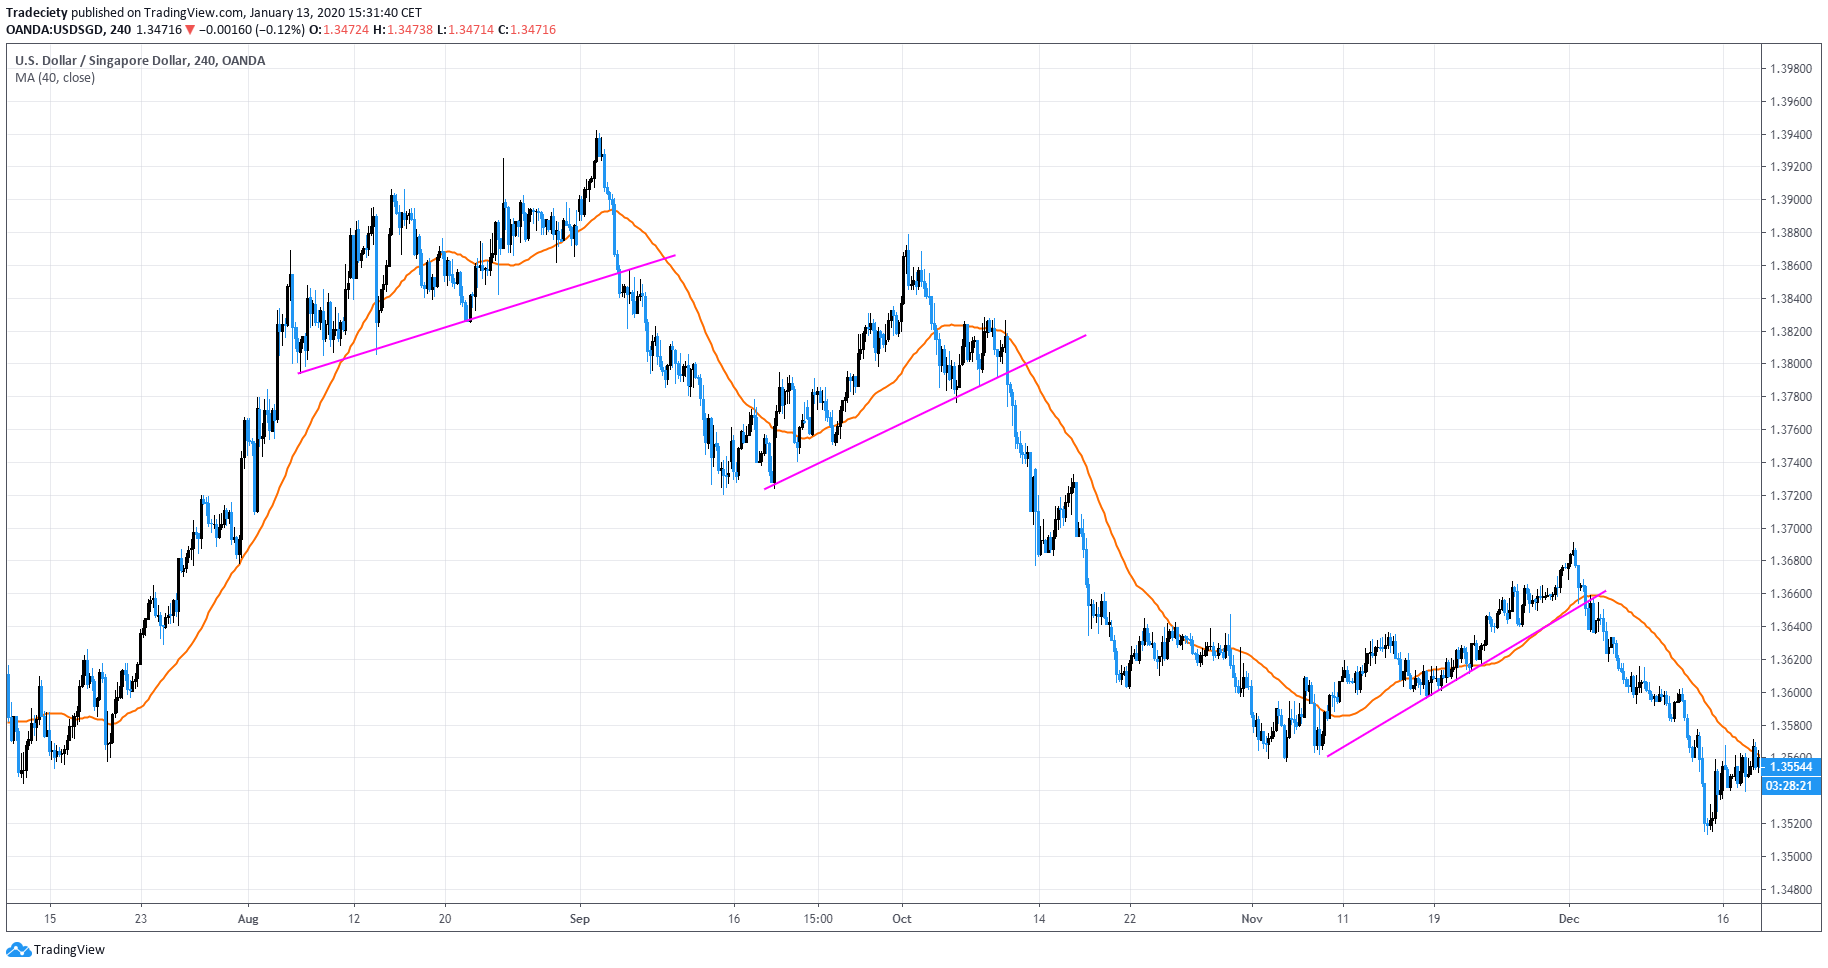
Trendlines can be more subjective than horizontal levels but they also work very well.
The screenshot below shows an overall primary uptrend and within the uptrend, the trader would look buying opportunities.
With the help of trendlines, one can identify consolidations effectively. When you can connect 3 or more highs and find a downward sloping trendline in an upward trend, a bullish breakout often signals a trend continuation.
All three points in the screenshot below show such periods where the sideways consolidation was defined by a downward sloping trendline. And each time, the breakout signaled the continuation.
Moving averages are an ideal filter for trendline strategies. Moving averages work best during trending phases and so do trendlines.
In the screenshot below, I added a 40-period moving average to the chart. For all 3 trendline breaks, the moving average also confirmed the trend direction. Not only was the price trading below the moving average for each signal, but the moving average itself was also pointing downward, confirming the trend direction, once the trendline break happened.
Again, I do not recommend that you copy those trading strategies blindly but use it as an inspiration. Test different ideas, see which one feels natural to you and then explore how you can make it for your own personality and trader profile.


external link:


3 min read
“95% of all traders fail” is the most commonly used trading related statistic around the internet. But no research paper exists that proves this...

3 min read
Trendlines can be great trading tools if used correctly and in this post, I am going to share three powerful trendline strategies with you.

3 min read
Choosing the right trading journal is essential for traders wanting to analyze performance, refine strategies, and improve consistency. In this...