Supply and Demand Trading in 2026
We have been trading supply and demand strategies for over ten years, and they have stood the test of time remarkably well. Supply and demand is...
It’s hard to fly when you can’t properly gauge your altitude. Pilots rely on instruments to measure how high or low they’re flying, particularly in cases where weather may prove challenging or dangerous. We can take this scenario as a metaphor and transfer it over to the currency markets.
In the currency markets, there are so many factors–from monetary and fiscal currents to geopolitics and global trade–that can affect weather conditions. You won’t be able to keep track of every change that occurs (unless it’s your job to do so), but you can measure altitude in relation to price events that either have occurred or are just unfolding.
One way to do this is to set weekly pivot points to contextualize your short-term trades for the week.
The question above begs another question to precede it: high or low relative to what? Price action can be taking place simultaneously higher or lower depending on the context–compared to an indicator, historical price action, fundamental valuations pertaining to the base or quote currency, or a country’s place in the Big Mac index. It can be higher or lower depending on forward valuations, forecasts in the international trade environment, or expectations of central bank actions.
The point here is that there are a lot of possible reference points–and all of them are subject to change as the economy, like the market, is a dynamic beast.
As a forex day trader or swing trader, you may need a reference point that’s a bit more “fixed,” understanding that you’ll adapt to fluctuations as they occur around your fixed reference points.
And that’s why you might consider contextualizing your week using pivot points to help guide your short-term trading decisions. Before we jump into demonstrating application, let’s first go over the basics of pivot points, especially for those who may be less familiar with them.
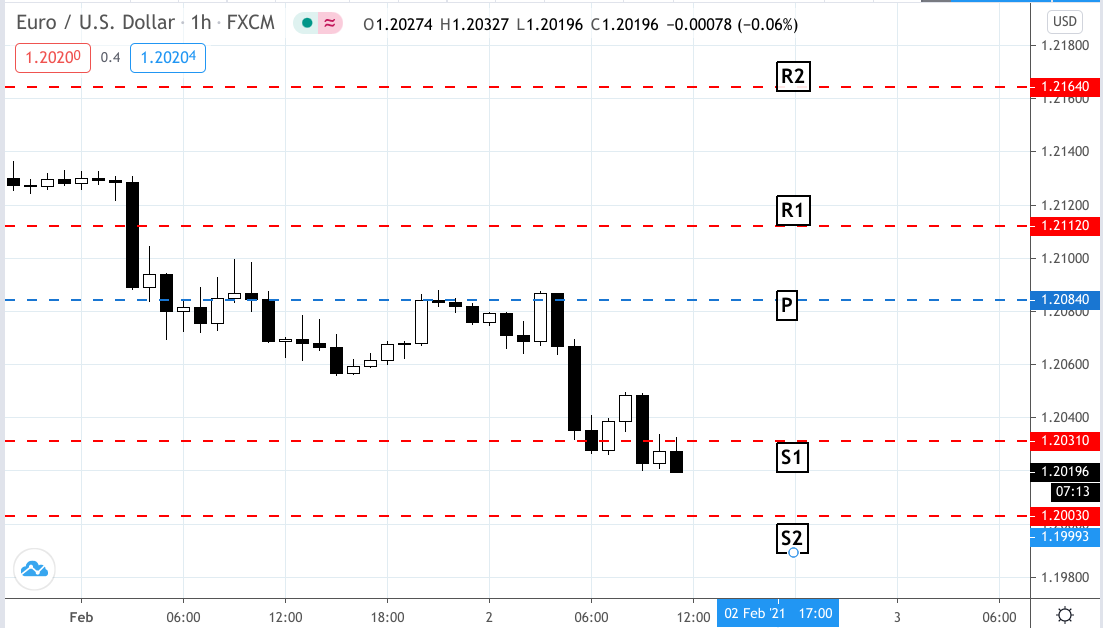
Pivot points are price levels that help traders determine potential support and resistance. It typically consists of two levels of support (S1 and S2), a pivot point (P–a line in the middle that helps indicate bullishness and bearishness), and two lines of resistance (R1 and R2).
A simple interpretation for the middle line (the pivot) is that price action above it constitutes a bullish bias; below it, a bearish bias. Of course, things aren’t that simple, but we’ll get into that later.
For now, here’s what it looks like:
R2 (resistance 2)
R1 (resistance 1)
P (pivot point)
S1 (support 1)
S2 (support 2)
And here’s how we calculate it:
Second resistance: R2 = P + (R1-S1)
First resistance: R1 = (2 * P) – Low
Pivot point: P = (High + Low + Close)/3
First support: S1 = (2 * P) – High
Second support: S2 = P – (R1 – S1)
Now that we know what pivot points look like and how to calculate them, how do we interpret them and why should we use “weekly” pivot points?
Remember when you made your first set of short-term trades. If you were a day trader, you were probably trading on a smaller time frame, from 1-minute to 15-minute charts. If that was the case, perhaps, as a newbie, you weren’t aware of the bigger technical picture. Unless you were looking at daily to monthly charts, you were trading in a relative time vacuum. So, if price–on your 5-minute chart–approached, say, strong historical resistance going back weeks or months, then there’d be nothing to explain why the market dropped so hard while you were long.
In short, you want to have some kind of large context to “frame” your upper and lower limits. By setting up your pivot points for the week, you can trade within the larger range of potential overbought or oversold limits for the week.
It’s like taking an altitude measurement, where you might get a sense of whether you’re trading at too high a level, or whether you’re about to hit the ground at which point price might bounce back hard.
There are many ways to interpret and use pivot points. The approach we’d like to introduce is based on an SFO article (originally published in December 2004) by technical analyst and trader John Seekinger titled Take a Two-Dimensional Approach. Here are a few tips:
Analytical tips:
Tactical tips:
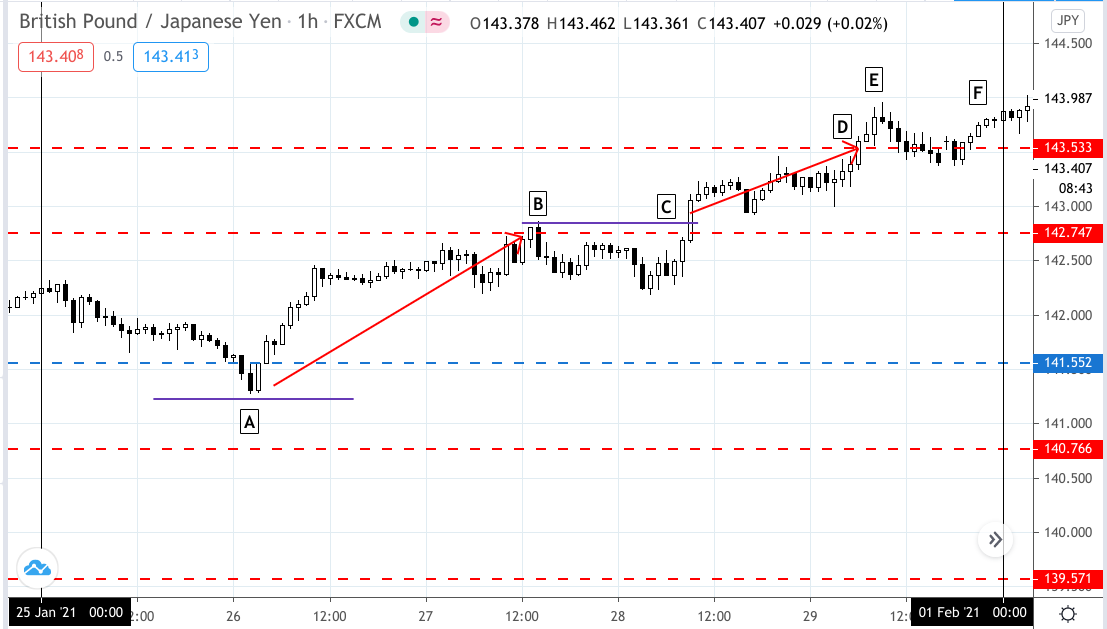
As we said earlier, your chart patterns take precedence over the pivot levels. In the case above, [A] marked support from the previous week’s pattern (not shown in the chart). The trader initiated a long position on the GBPJPY. The profit target was at R1 shown at [B]. But then another pattern breakout occurred at [C], so a new long position was initiated, using R2 at [D] as the second target. R2 is considered in this particular interpretation to be “oversold.” So traders may have looked for a shorting opportunity at [E]. However, the week ended [F] meaning that the following week will have a new set of pivot points. Therefore, no trade was initiated.
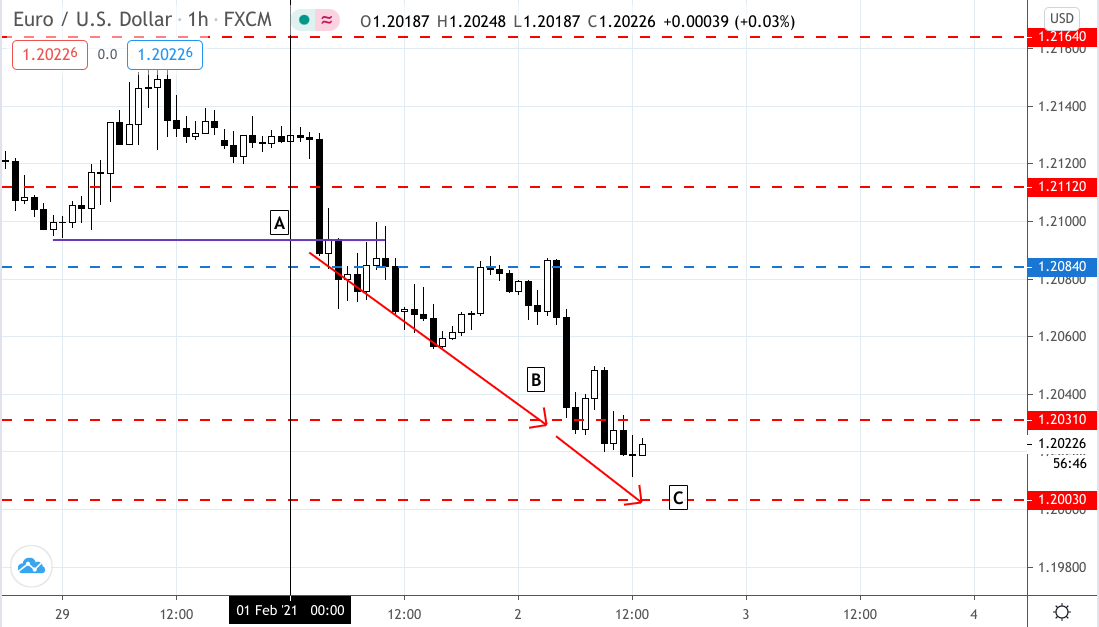
A breakout toward the downside occurred at [A]. Clearly, the momentum was bearish and the Euro appears to be rapidly declining against the USD. A trader who opened two positions might use [B] at S1 as the first target and [C] at S2 as the second position.
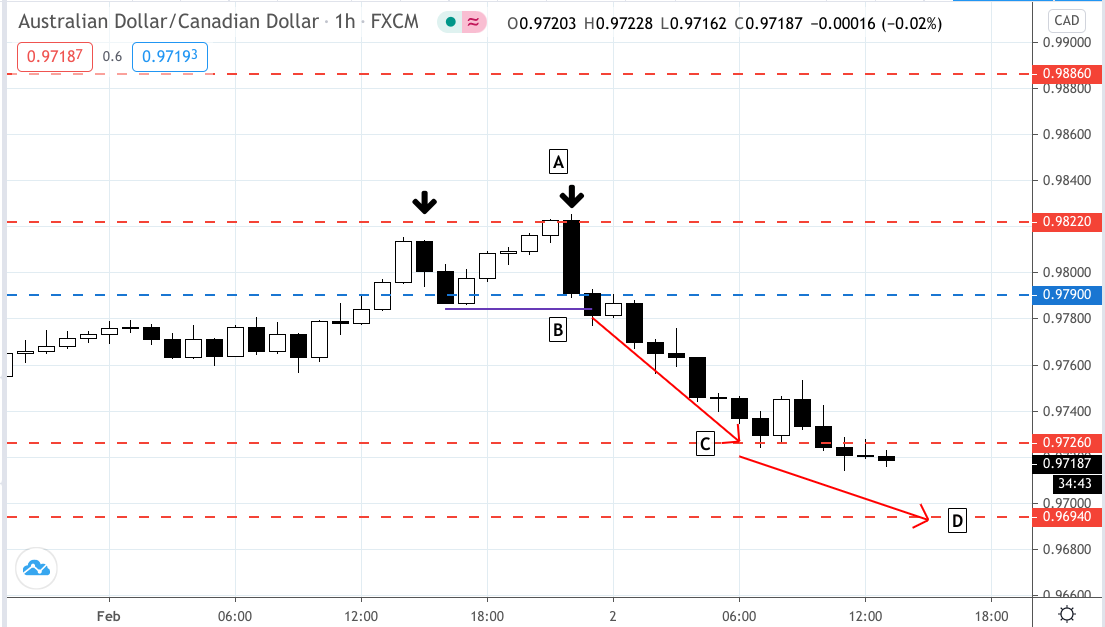
We see a short-term double top at [A]. Typically, you’d measure your profit target by calculating the height of the pattern and subtracting it from the downside breakout at [B]. However, because we see the S1 level at [C] and the S2 level at [D], both can be used as potential “take profit” levels.
Pivot levels provide reference points, and using them on a weekly scale can help you measure the proverbial altitude of price action over the entire week. Pivot points can help you gauge not only potential overbought and oversold areas, but also profit targets and entry levels. As we’ve demonstrated above, chart patterns take priority over pivot levels when it comes to trade signals. Pivot points are fixed, so be sure you’re monitoring the larger technical and fundamental context so that you can adjust to trading conditions, using your pivot points as a fixed point of reference. Happy trading.
external link:


We have been trading supply and demand strategies for over ten years, and they have stood the test of time remarkably well. Supply and demand is...

3 min read
Choosing the right trading journal is essential for traders wanting to analyze performance, refine strategies, and improve consistency. In this...

3 min read
“95% of all traders fail” is the most commonly used trading related statistic around the internet. But no research paper exists that proves this...