3 min read
Scientist Discovered Why Most Traders Lose Money – 24 Surprising Statistics
“95% of all traders fail” is the most commonly used trading related statistic around the internet. But no research paper exists that proves this...

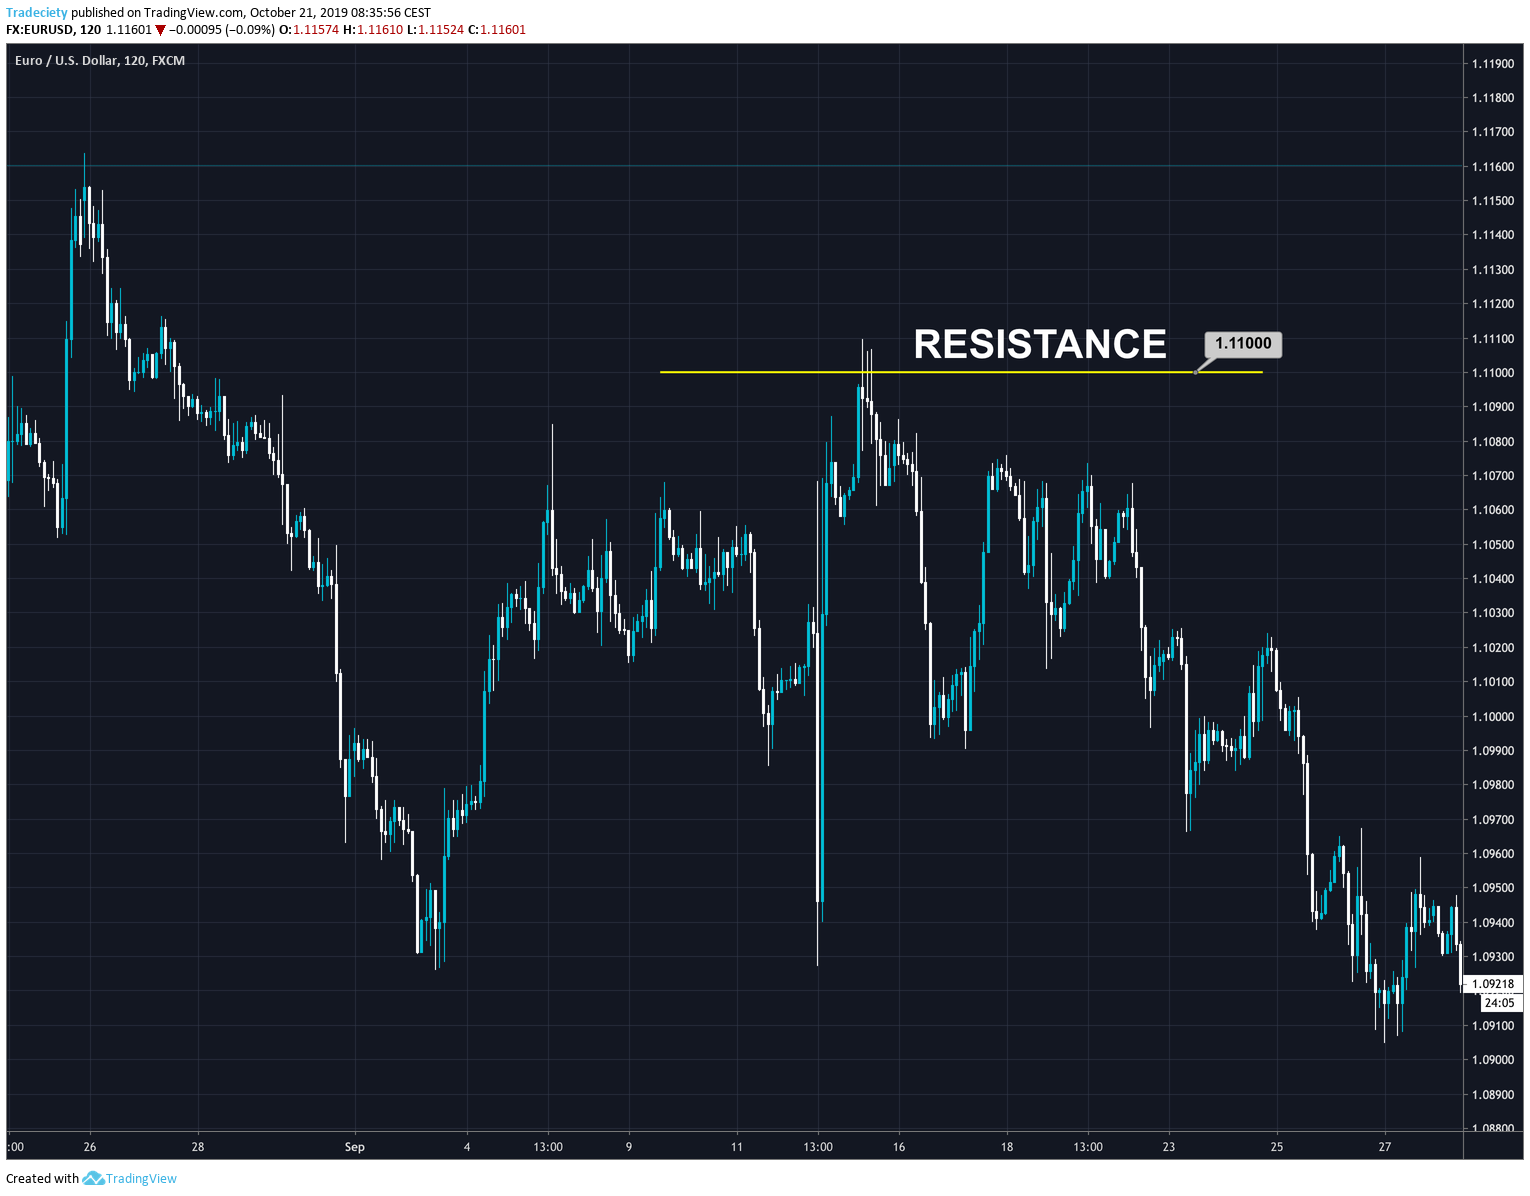
Support and resistance levels are basically historical prices where a large number of orders accumulate to prevent a prevailing trend from continuing. Think for a second, if the EUR/USD has risen to 1.1100 and there is a huge volume of sell orders placed at 1.1100, and if the volume of sell orders equals the volume of buy orders, then the price will find an equilibrium. If there are more sellers than buyers, the price will not only stop going up, soon the market price might turn and start a bearish retracement, right? This is what happened in the scenario below.
If there are any time-tested method of trading Forex is finding pivot zones in a price chart and planning your trades around these levels. When a pivot level restricts bulls (buyers) from pushing the price further up, it is known as resistance and if the price is having difficulty crossing below a pivot level, it is called a support. What you need to note down is that a pivot level can act as both support and resistance. In fact, often supports turn into resistances, and vice versa.
Now, why Forex traders tend to concentrate a large number of orders around key historical price levels is up for debate. However, the most reasonable answer that can explain this phenomenon would be the concept of self-fulfilling prophecy. That’s why key Fibonacci retracement levels, Big Round Numbers (BRN) or even a dynamic price level based on Moving Averages (MAs) often end up acting as pivot levels and provide support and resistance to Forex prices.
If you knew there is a high probability that the bullish trend of a Forex pair will stop at a certain point ahead of time, how can you benefit from that information? The answer to that question and the possibilities of exploiting such valued information are endless.
You can reduce your exposure or simply close your trade and exit the market with some profit. If you are not in the market, you can look for opportunities to short the pair or wait for the price to break the resistance and ride the bullish momentum again. Hence, knowing how to identify support and resistance can add an immensely useful tool in your trading arsenal.
Moreover, as you already know precisely at what price level the market would likely to stop momentarily, you can get away with setting some tight stop losses, while giving enough breathing room to your trades to become profitable and doing so can immensely improve the reward to risk ratios of your trades.
Knowing how to identify potential support and resistance can revolutionize how you interpret the market and formulate strategies to improve your trading performance. Let’s take a look at some of the most common and effective strategies to find support and resistance in the global currency market.
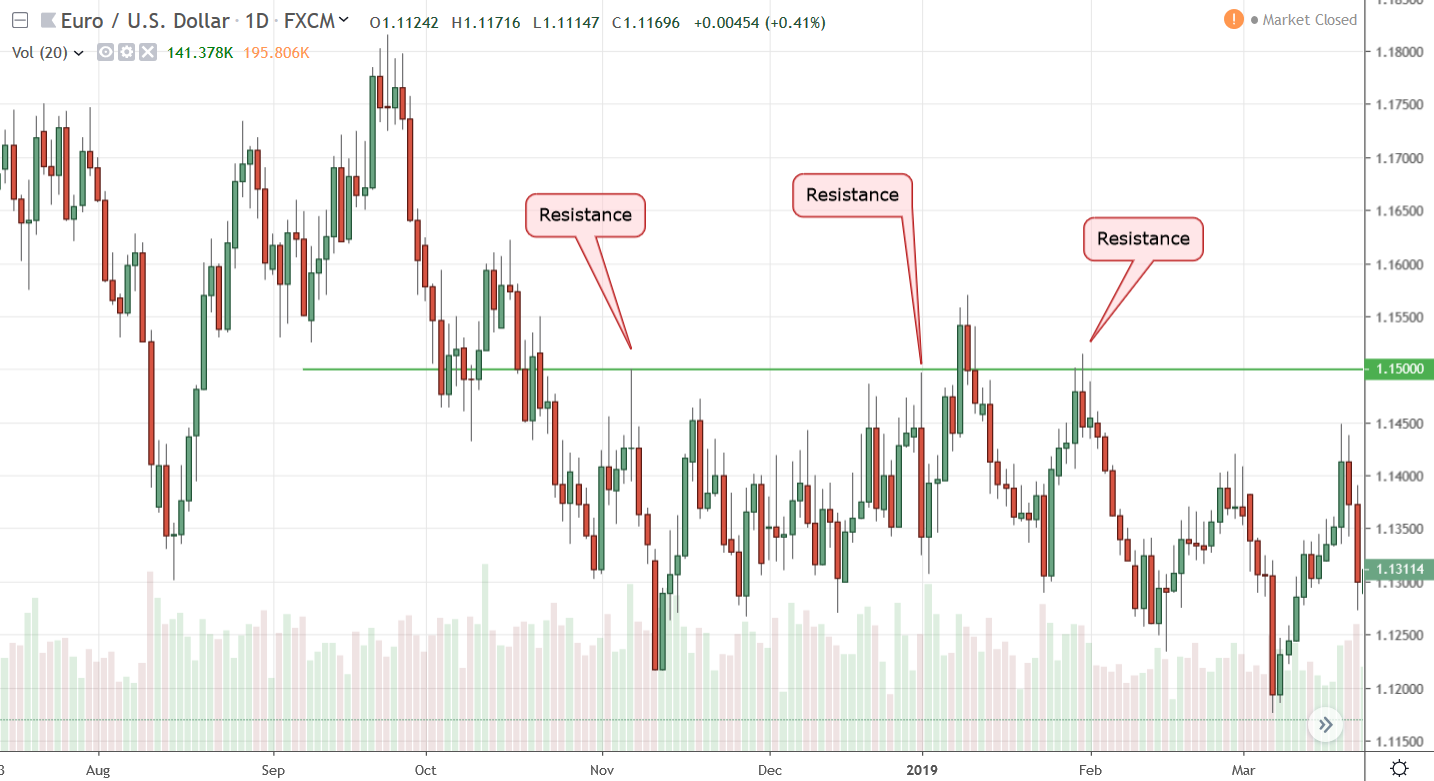
Figure 1: The EURUSD Finds Major Resistance Near the 1.1500 Level
In figure 1, we can see that after November 2018, the EURUSD found a strong resistance near the 1.1500 level three times in the daily time frame. On the first occasion, it formed a large bearish shadow after reaching the 1.1500 level and ended up forming a bearish pin bar that signaled additional bearish momentum in the next few days. On the second occasion, it formed a large Bearish Outside Bar (BEOB). On the third occasion, it formed a small bearish pin bar. While the EURUSD managed to break above the 1.1500 level once since November 2018, the bullish momentum faded quickly and within two days, the pair resumed bearishness.
If you simply drew a horizontal line at the round number 1.1500 on November 7, 2018, and placed three short orders near it, over the last year, two out of your three trades may have been winners.
Historical support and resistance zones work because traders psychologically anchor their decision based on past experiences, and while enough orders accumulate around these levels, it ends up becoming a self-fulfilling prophecy.
Pivot points are mathematical computation levels based on the previous day’s high, low, and closing prices. Pivot points are very popular with floor traders, and since a lot of large professional and institutional traders use these arbitrary levels in their trading, these levels often act as major support and resistance levels. These levels are important, especially, if you are a day trader and trade using time frames lower than 24-hour periods, such as 60-minute or even 5-minute charts.
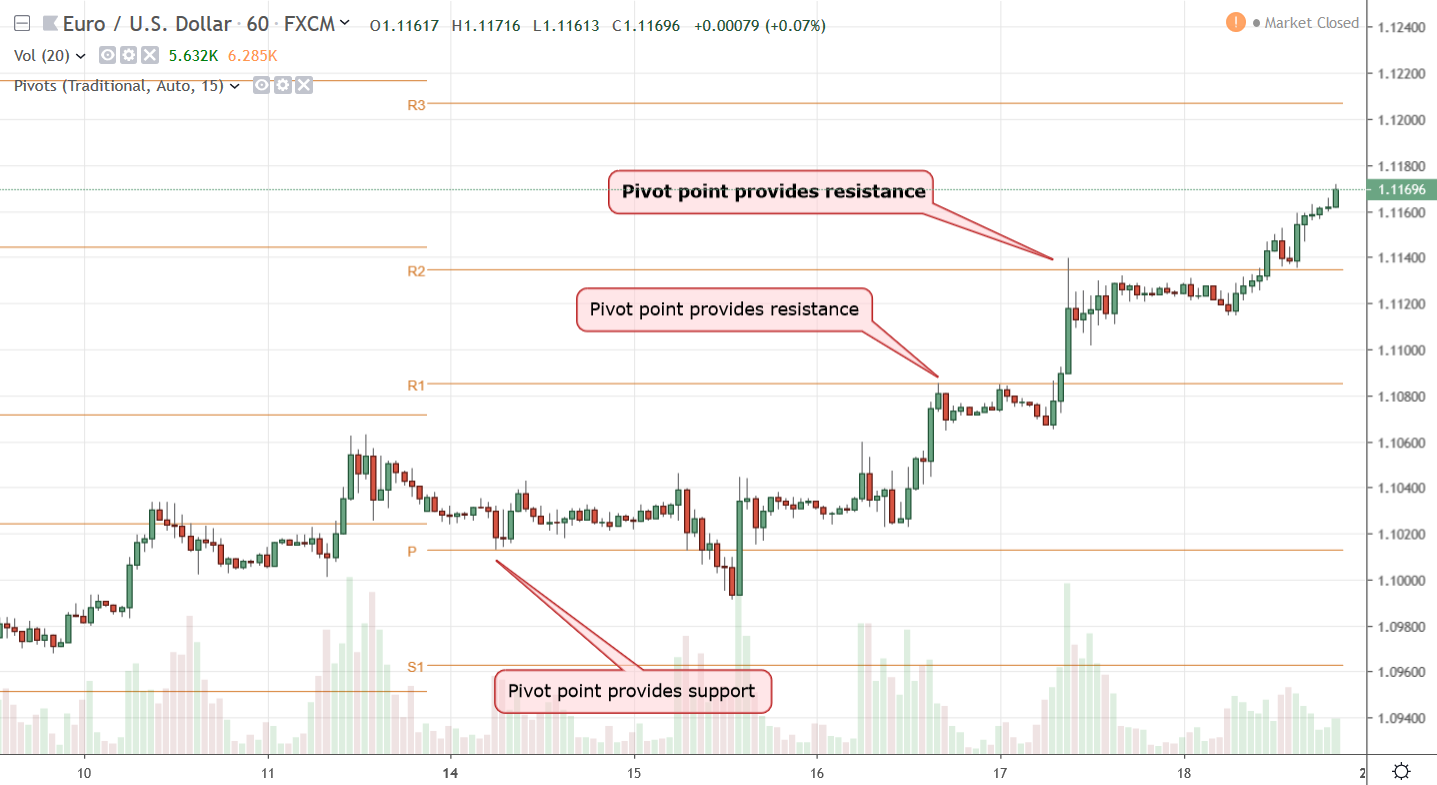
Figure 2: EURUSD Finds Support and Resistance Near Pivot Points
In figure 2, we have used a built-in pivot point indicator to draw the S1-S3, R1-R3, and Pivot Point on a EURUSD chart. While these pivot points are based on the previous day’s high, low, and closing prices, these are only relevant for today’s market. Zooming into the 60-minute chart, we can see the EURUSD turned bearish early in the day but soon found support. When it turned bullish in the evening, the R1 and R2 levels provided momentary resistance to the bullish momentum.
You would often find that S1-S3 levels are providing support and causing the market to turn bullish. On the other hand, R1-R3 levels may cause the bullish trend to end and start a bearish reversal. Hence, knowing daily pivot points as a day trader can help you plan your trades as well as set entry and exit points more efficiently.
Even wondered why that shirt you bought had a price tag of $39.99 instead of $40.00? Marketing professionals have long exploited how we humans perceive prices and how charging a cent less can have an impact on your purchasing behavior. While marketers exploit human psychology by not offering round figure prices on products, in the Forex market, the traders do flock around big round numbers and place their orders.
If you are a large bank or hedge fund and want to buy the EURUSD if it falls to 1.1000, would you place an order randomly at 1.0087 or would you place the order at 1.1000? Typically, the answer would be the big round number.
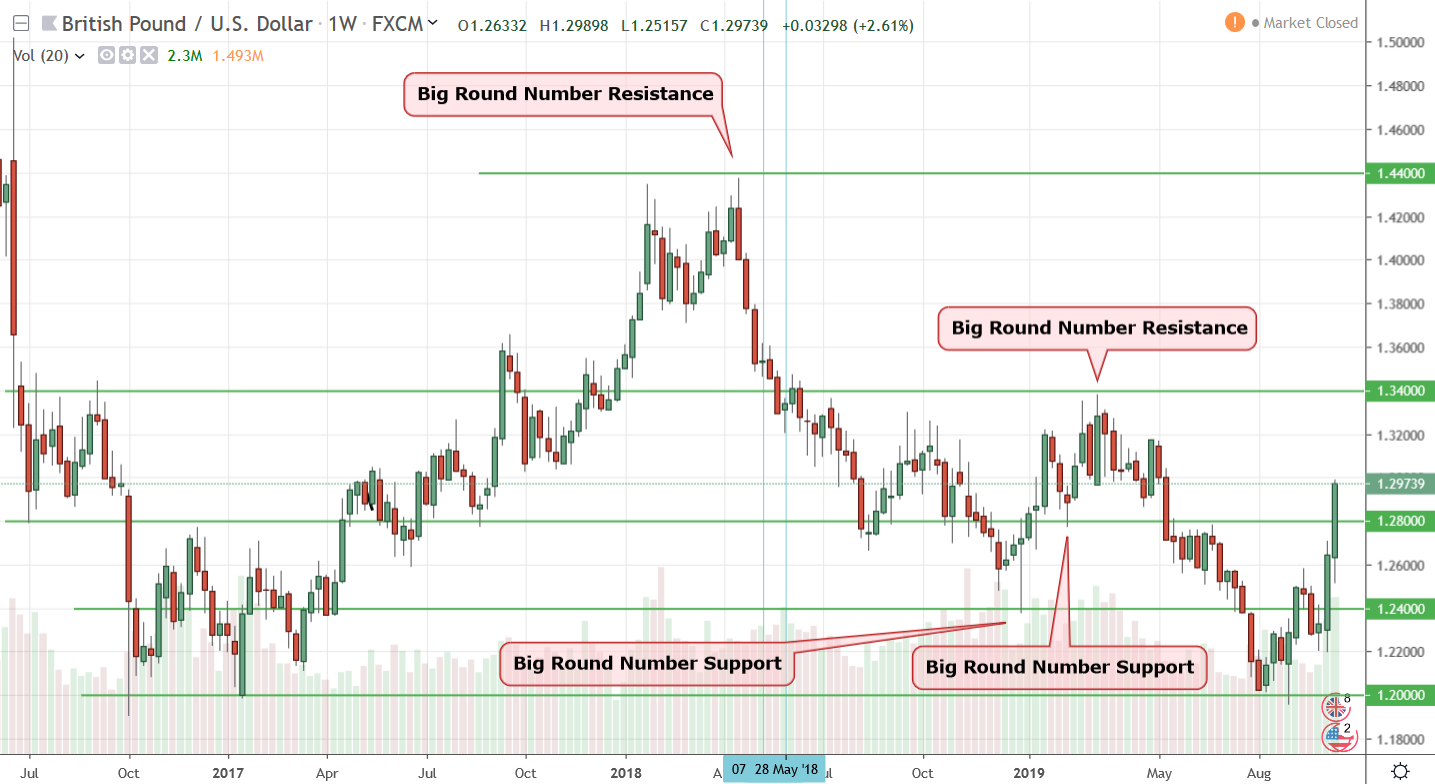
Figure 3: Big Round Numbers Provide Major Support and Resistance to GBPUSD on the Weekly Chart
In figure 3, we can see a weekly chart of the GBPUSD. Based on the historical price action, we have drawn four major support and resistance levels on the chart. As you can see, the Big Round Numbers like 1.2000, 1.2400, 1.3400, 1.4400 all acted as major pivot zones, providing support and resistance to falling and rising prices, respectively.
If you are new to trading and do not know how to correctly draw horizontal support and resistance levels, always round up to the next Big Round Number.
Fibonacci numbers are found in nature and Forex traders have come up with clever ways to implement these ratios to find support and resistance levels in the market. As you can draw the Fibonacci levels based on the high and low of a major price swing, these often act as major pivot zones that can predict the end of the retracement and where the market might resume the prevailing trend.
While retracement levels can help you enter the market, Fibonacci extension levels can help you identify potential profit targets. During a bullish market, Fibonacci retracement levels act as support, where you should enter the market and extension levels act as potential resistance above the high of the Fibonacci swing, where you should exit the market by taking some profits off the table. During a downtrend, you guessed it right, the Fibonacci retracement levels act as resistance and the extension levels act as support.

Figure 4: USDJPY Finds Support and Resistance Near Fibonacci Retracement and Extension Levels
In figure 4, we can see the USDJPY had a bullish swing. Based on the high and low of this bullish swing, we have drawn the Fibonacci retracement levels. As you can see, the USDJPY bearish retracement stopped near the 50% Fibonacci level. Consequently, it resumed the trend and reversed near the 261.8% Fibonacci extension point, which is based on the High, Low and Retracement levels of the initial bullish swing.
One of the problems of using Fibonacci retracement levels for finding support and resistance is not knowing beforehand that at which level the retracement will end, or will the retracement turn into a reversal itself! Hence, using a confluence of technical indicators to confirm the end of the retracement is vital when you are using these levels to anticipate support and resistance levels.
Similarly, there is no way to know if the trend will extend to 161.8% Fibonacci extension to run up to 261.8% or higher. Hence, you should not exit a profitable trade just because the market has reached a certain arbitrary Fibonacci extension level. Instead, try to look for overbought or oversold market conditions or divergence using Oscillators near these Fibonacci extension levels before taking profit and exiting the market.
Moving averages are some of the most popular technical indicators used by Forex traders. The sheer popularity of some long-term moving averages makes them ideal candidates for dynamic support and resistance levels in the market.
Among day traders, short-term period moving averages like the EMA 5 and 13 are very popular as both of these are from the Fibonacci sequence of numbers. If you are a swing trader, sticking to EMA 50, 100, and 200 would likely be more appropriate as traders use these longer-term moving averages to identify momentum over days and weeks.

Figure 5: Exponential Moving Averages Acting as Support and Resistance to USDCHF
In figure 5, we can see a weekly chart of USDCHF with three different exponential moving averages plotted on the chart – the EMA 13, 50, and 100. As you can see, the EMA 13 provided short-term resistance during a sustained downtrend. However, even though the EMA 50 and 100 were trailing the price way above the downtrend, once the price retraced up, the EMA 100 acted as a resistance. Soon, the downturn found support near the EMA 50, creating a momentary price channel.
When there are no obvious historical support and resistance on a chart, using popular moving averages like the 50 and 100 periods EMAs can provide Forex traders with some very useful dynamic support and resistance levels.
While you should definitely not blindly trade such major support and resistance zones and should have a combined strategy that uses secondary confirmations, like a signal from a technical indicator or a candlestick pattern, simply knowing where to look for trend continuation or reversal can improve your win rate.
Keep in mind that incorporating different types of support and resistance also comes with some drawbacks. One of the major problems of having too many pivot zones on a chart would mean that you would be always uncertain about how far a trend will run as a cluttered chart will make it difficult to let your profits run. Hence, it is always best to use one or two ways of identifying support and resistance levels and using different strategies to plan your trades around these levels.
Also, the whole point of using support and resistance levels is to improve your money management by efficiently entering and exiting the market more effectively. Support and resistance levels should be taken into consideration in a way that helps you identify trades that require small stop loss and large profit targets. So, if you want to enter a long trade, make sure the entry has a short distance from a support level. By contrast, the next resistance level should be much higher to allow your trade a free run.
If you can learn to successfully identify major support and resistance levels and plan your trades around these levels, it will help you dramatically improve your reward to risk ratio, as well as win rate.


external link:


3 min read
“95% of all traders fail” is the most commonly used trading related statistic around the internet. But no research paper exists that proves this...

3 min read
Trendlines can be great trading tools if used correctly and in this post, I am going to share three powerful trendline strategies with you.

3 min read
Choosing the right trading journal is essential for traders wanting to analyze performance, refine strategies, and improve consistency. In this...