Supply and Demand Trading in 2026
We have been trading supply and demand strategies for over ten years, and they have stood the test of time remarkably well. Supply and demand is...

Most traders spend all their time and energy trying to find the best entry. But then once they are in a trade, they are completely lost and they don’t know how to handle the trades. This leads to a lack of confidence, impulsive decisions, leaving money on the table by reacting emotionally and just making errors that traders will regret later. Knowing how to set targets in trading is very important, but often overlooked.
A trader that has a precise strategy for their targets can trade with more confidence by eliminating guesswork. In this article, I explain the eight best techniques on how to set targets the right way.
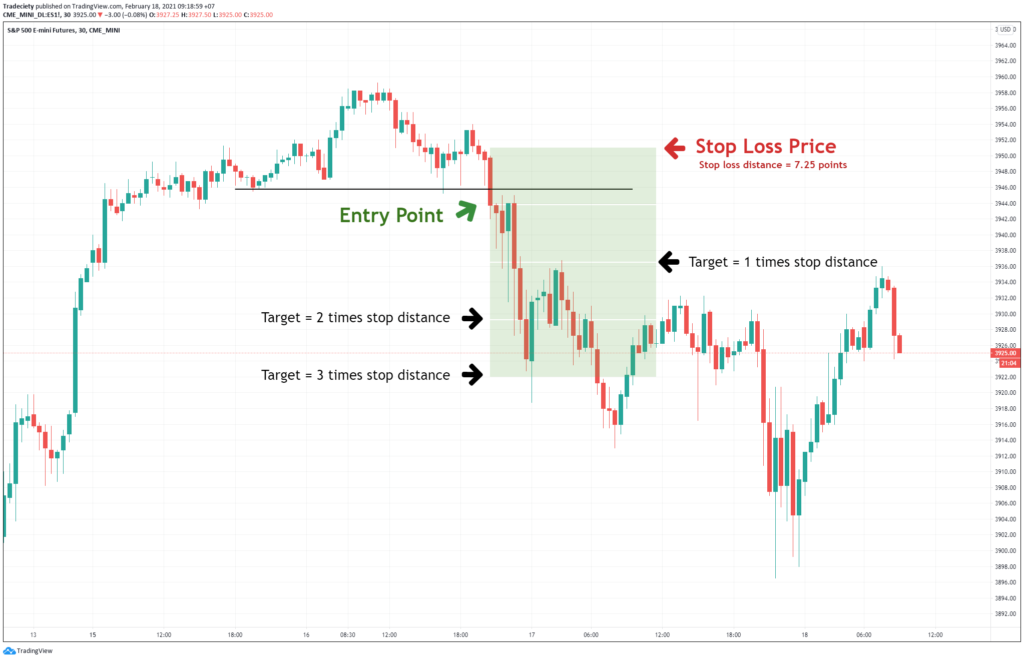
The simplest target technique is the fixed reward:risk ratio and the process is the following:
1) Measure the distance between the entry and the stop loss. In the example below, the distance is 7.25 points.
2) Multiply the stop distance by a factor of 1, 2, or 3 – depending on the target distance and the desired reward:risk ratio.
You see, it is a very simple technique to implement a consistent target strategy.
A high reward:risk ratio is not necessarily better and I talked about the trade-off between winrate and reward:risk ratio before. The greater the reward:risk ratio, the lower the winrate will be. Especially new and struggling traders are better off choosing a smaller target with a lower reward:risk ratio because it allows them to have a higher winrate and, thus, build confidence faster.
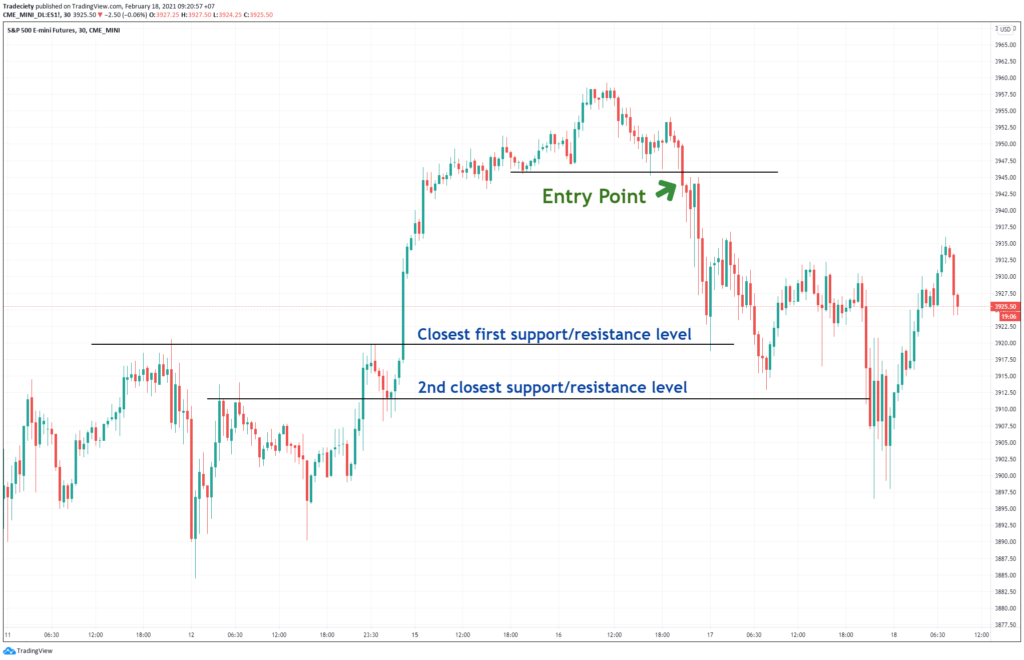
A very popular target strategy utilizes the most recent support and resistance levels. Support and resistance levels are major obstacles for the price and it makes sense to choose your target so that the price does not have to push through a big support or resistance level because it will increase the likelihood of the price not making it to your target.
Generally, traders look left to find the most recent important support or resistance level and then place the target a few points above it. This is important. In the example below, you want to place the target a few points above the support level in case of a short trade because it will mitigate some of the risks that price action could bounce off the level.
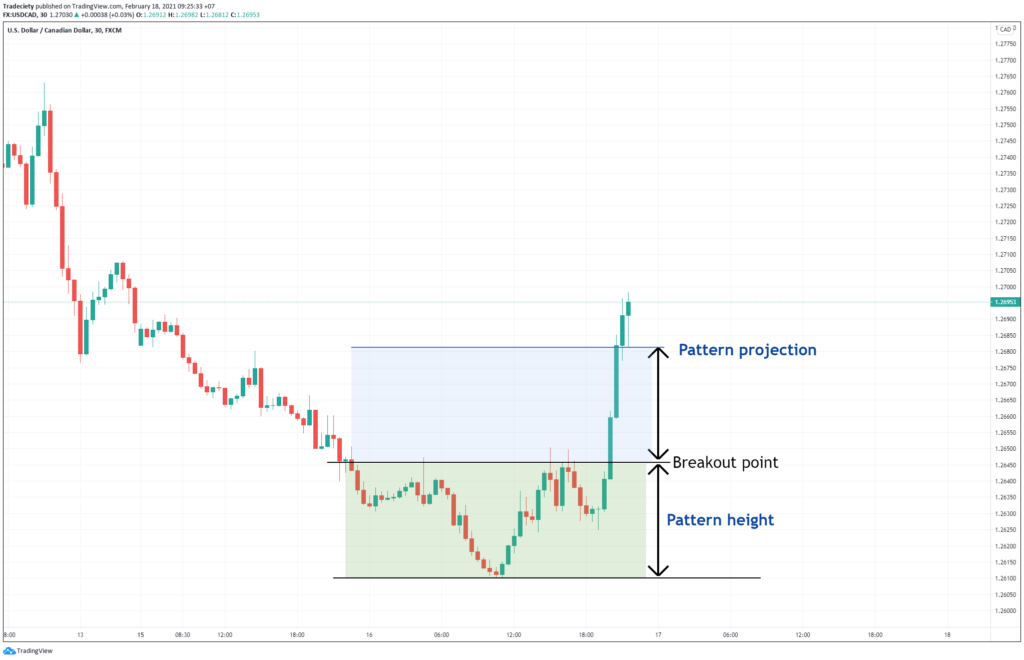
Pattern projections or measured moves, how some traders call this approach, uses the pattern height to determine how far the price may move after a successful breakout.
In the example below, we can identify an inverse Head and Shoulders chart pattern. We first measure the height from the lowest point to the highest point of the pattern. Then, we project the distance higher.
If you opt for this target strategy, it is important that you measure the distance from the absolute lowest to the absolute highest point of the pattern to get the correct distance.
Some traders also multiply the pattern height by factors of 0.75, 1.25, 1.5 or even 2. Again, the farther your target away, the less likely it is for the price to hit it. If you are starting out with a new strategy, I would always recommend using conservative targets because it will help you build confidence much faster with a higher winrate.
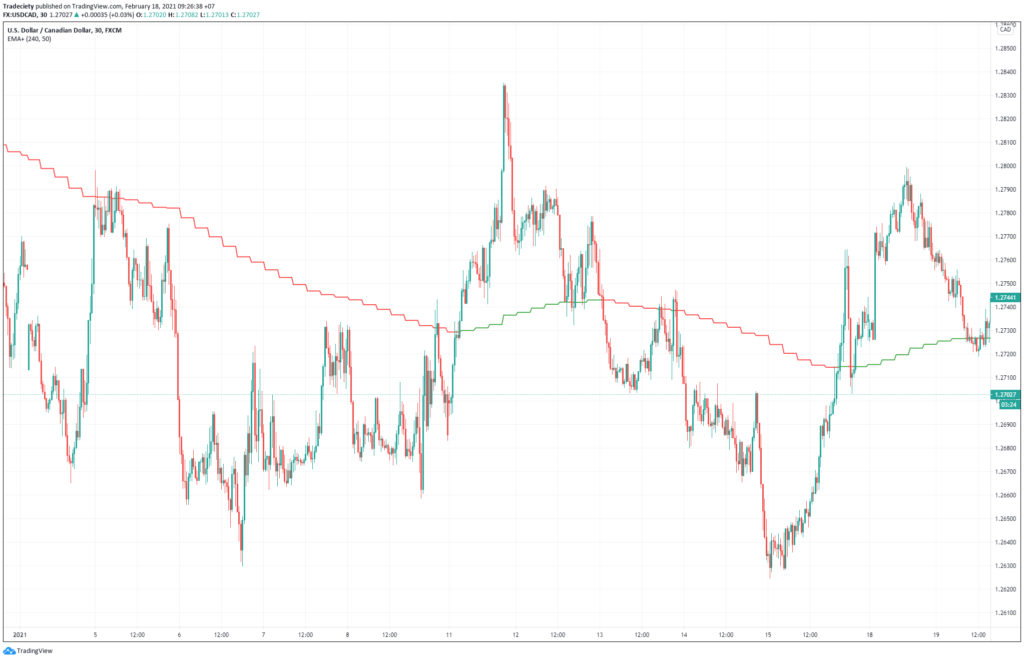
This technique works especially well in Forex trading because of the mean-reverting nature of the Forex market.
What is the one thing that ALWAYS happens in the screenshot below? The price is always coming back to the central moving average and the price is continuously trading around it. In this example, we look at a 30min chart and the moving average is the 50 period MA from the 4H timeframe.
The higher timeframe moving average target strategy is best used for kind of a reversal trading approach where you are looking for trading opportunities back into the higher timeframe MA.
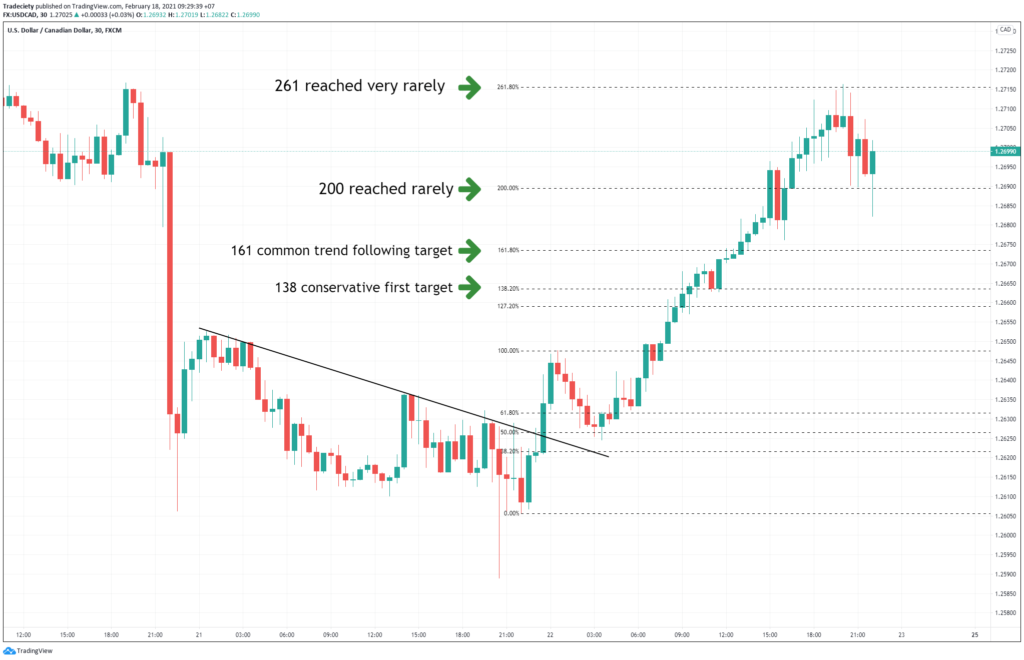
I have talked about Fibonacci extensions in length in the past for various trading ideas. But you can also use them as targets in your trading.
Once you have identified an A-B-C breakout and pullback situation, you draw your Fibonacci tool from the bottom to the top of the breakout move. After finding a C retracement level, you may choose from one of the Fibonacci extension levels as your target.
Generally, the 138 and the 161 Fibonacci extension levels are the closest ones and the extensions most commonly used as targets.
The 200 and 261 levels are rarely reached by the price and it requires a strong trend to get to those extreme Fibonacci extension levels.
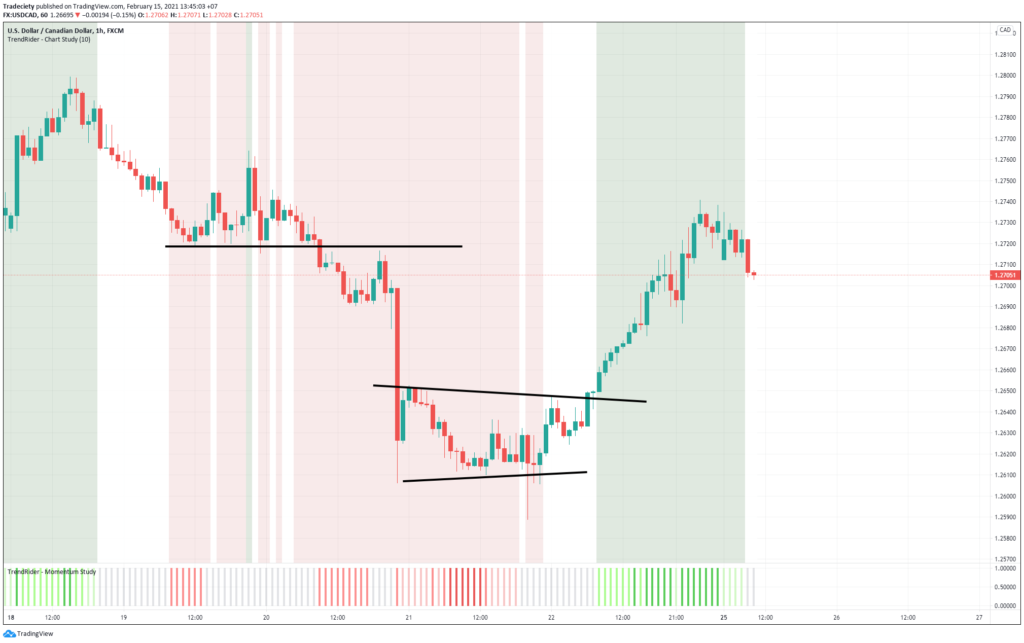
We on Tradeciety created the Trend Rider indicator and as the name suggests it is an indicator best used to ride trends. In the example below, I highlighted two breakout trades.
In both cases, the Trend Rider background color is used to ride trades in trending markets. As long as the background stays red during a short, it still may confirm the bearish momentum. And when the background turns white, then the downtrend may be over. The same is true for bull markets and a green Trend Rider background.
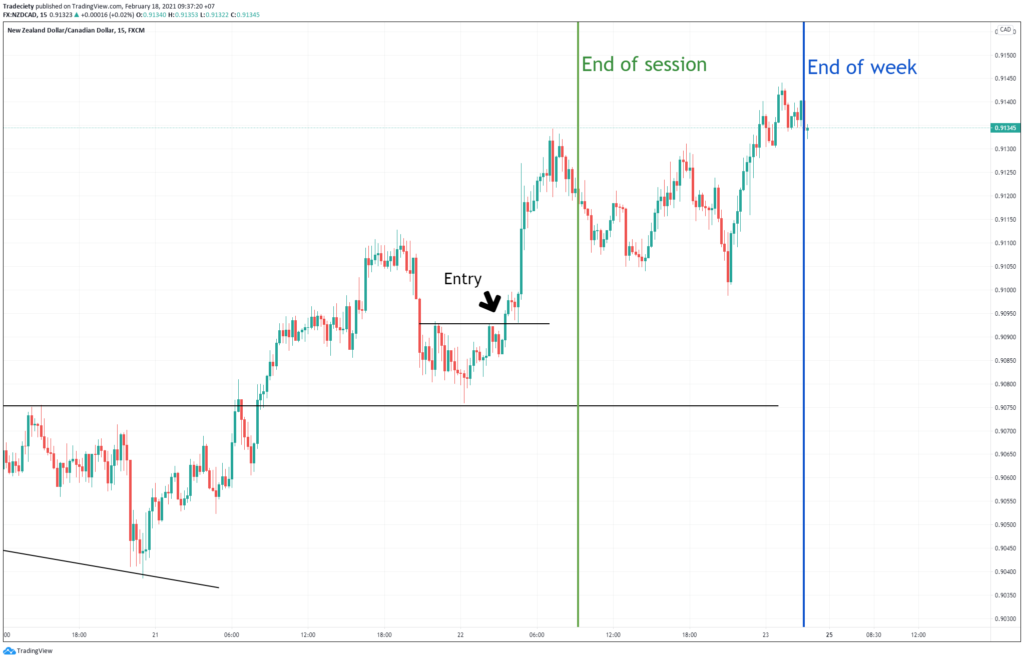
Time-based targets can be combined with other target strategies. Day traders, for example, often use an end-of-day (session) target strategy and they exit all their open positions by the end of the trading day to avoid any overnight risk.
Swing traders often utilize an end od week target strategy to exit all trades on Friday night to avoid the risks that come from holding trades over the weekend and being exposed to gap risk.
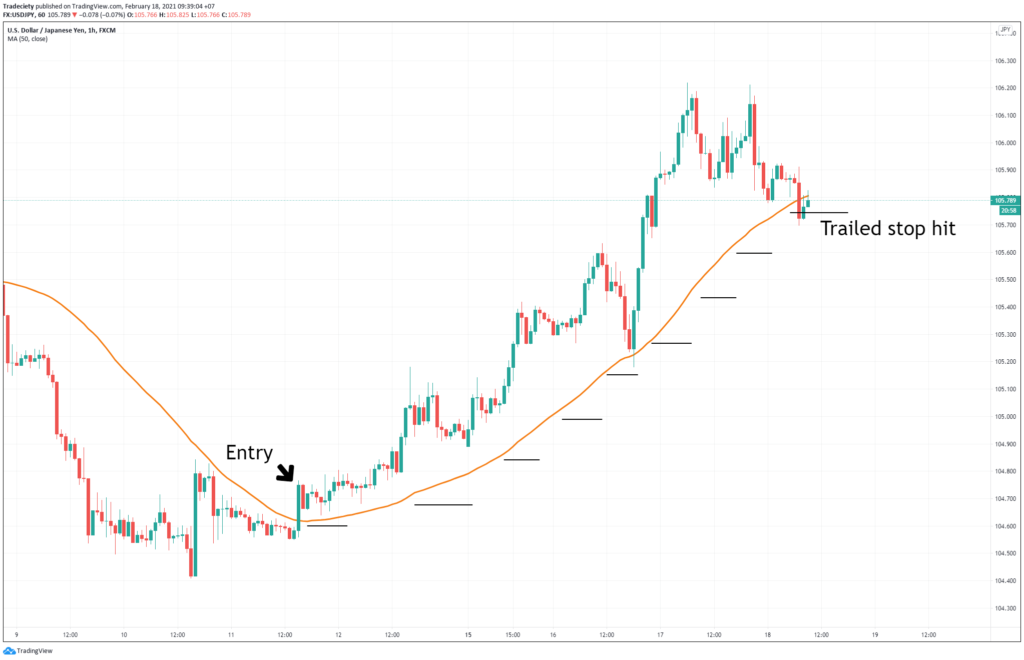
Similar to the time-based target, a trailing stop loss technique can also be combined with other target strategies. But generally, traders who utilize the trailing stop loss approach are looking to ride their winning trades for as long as possible and have an open-ended target strategy which means that they don’t use a target at all and just trail the stop loss behind the price to maximize the profits in trending markets.
Usually, traders choose moving averages as their tools for stop loss trailing. In the example below, I used a 50 period moving average and the trader would trail the stop loss behind the moving average. And never RIGHT at the moving average to avoid getting kicked out during regular pullbacks.
There are a few pros and cons to consider though:
Thus, I would only recommend adopting a trailing stop loss strategy for traders that are experienced and don’t have any issues with their emotions and have a solid foundation for their trading mindset.
As I said in the beginning, there is no better or worse target strategy and it totally depends on the trader which target strategy will work best. I would recommend just picking a few, try them out one by one, and see which one feels the most natural to you.
Then, implement it in your trading, track your results and keep improving your approach. Also, let me know in the comments below which target approach you find the most interesting.
external link:


We have been trading supply and demand strategies for over ten years, and they have stood the test of time remarkably well. Supply and demand is...

3 min read
Choosing the right trading journal is essential for traders wanting to analyze performance, refine strategies, and improve consistency. In this...

3 min read
“95% of all traders fail” is the most commonly used trading related statistic around the internet. But no research paper exists that proves this...