Supply and Demand Trading in 2026
We have been trading supply and demand strategies for over ten years, and they have stood the test of time remarkably well. Supply and demand is...

Do you often change your trading approach because you don’t know what works and what doesn’t? Are you still looking for a way to analyze charts effectively? You are unsure about how to use the right trading tools?
Most traders do not follow a professional approach and just flip through timeframes and constantly change their tools without really knowing what to look for and how to find trades. They hunt for signals and want consistent results without having a consistent approach.
In this article I want to help you make sense of price charts in a clear and structured way. I am introducing 8 ways how you could make sense of any chart. You do not have to use all at once, but pick one, two or three and try to combine them. Don’t jump around but see what makes sense to you and then stick to it.
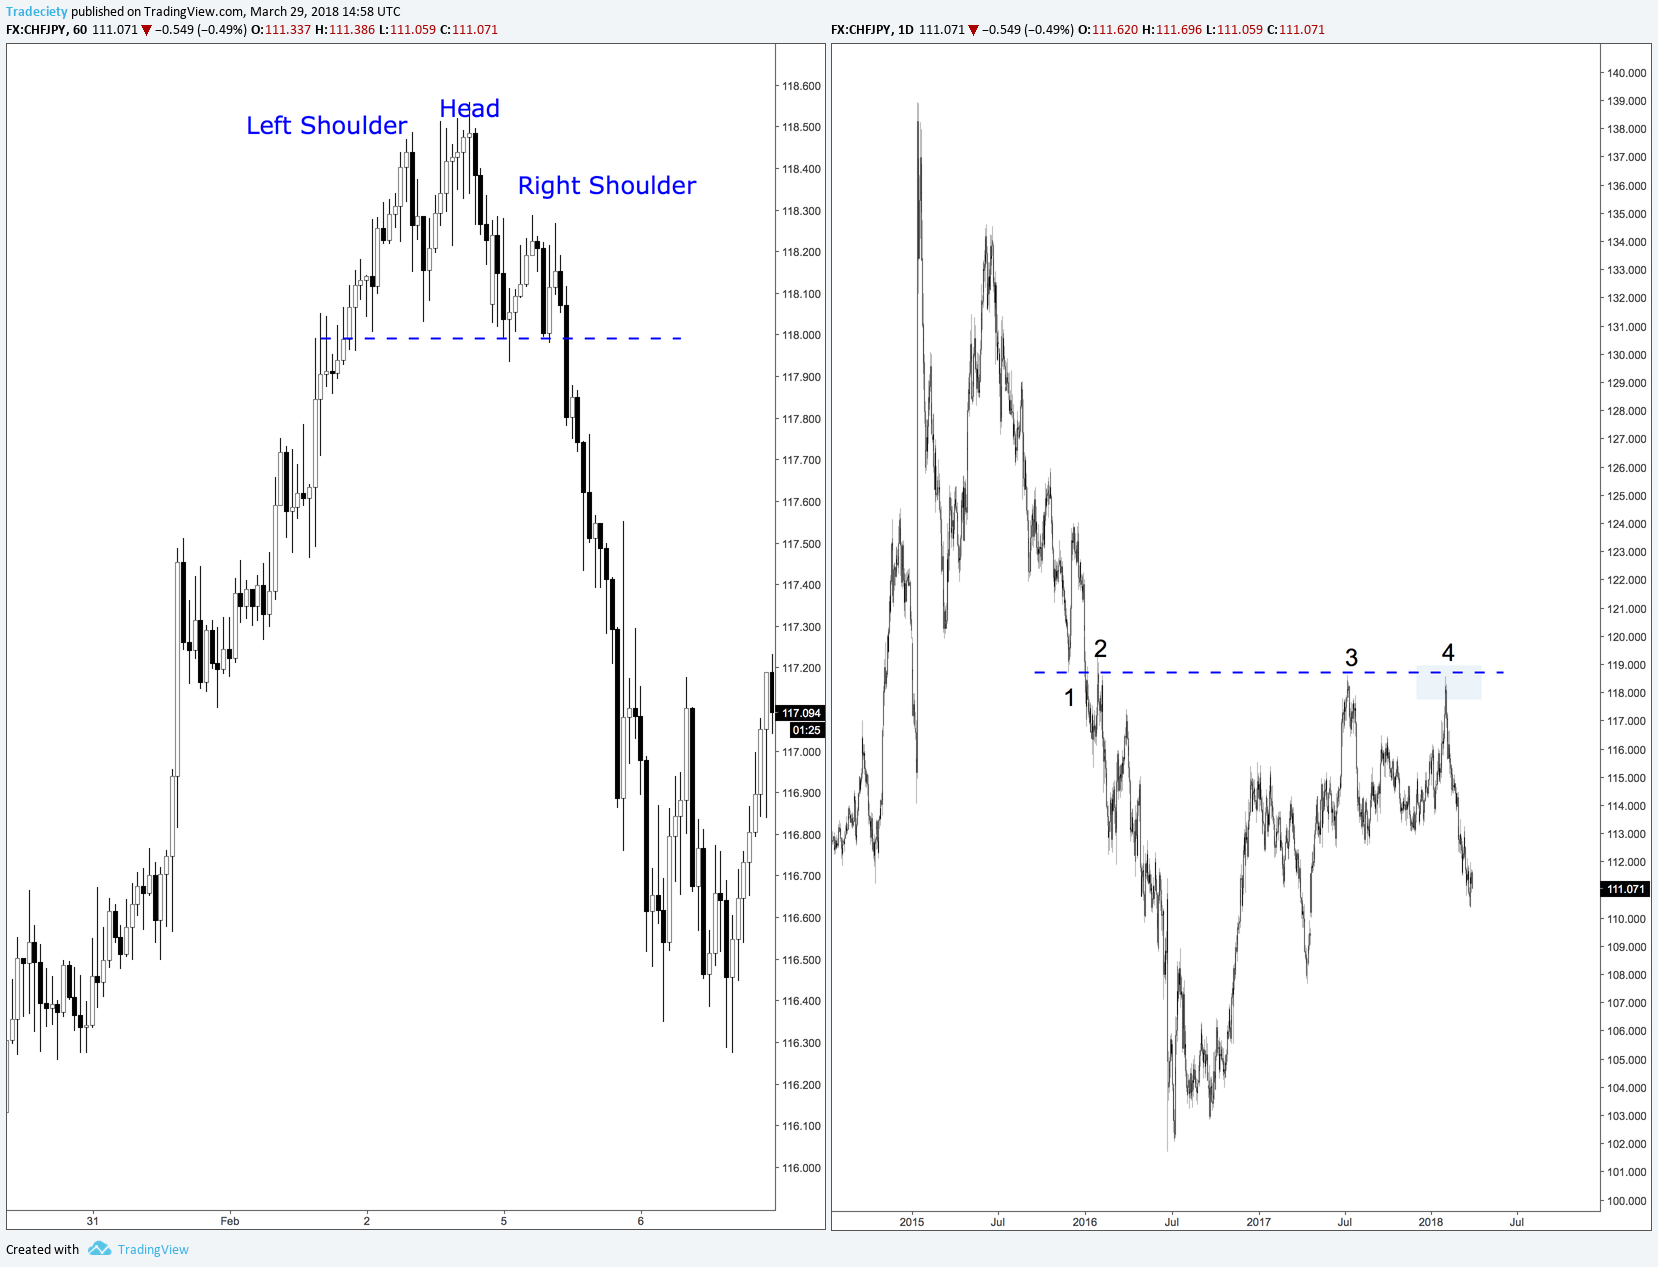
If you usually trade the 4H or 1H charts, start your analysis on the Daily or Weekly chart to get some perspective. What looks like a strong trend on the 1H chart, can easily be just a range move on the 4H chart. Furthermore, traders who do not look at the higher time-frames often risk overlooking important price areas and support and resistance levels which then create problems for their trades on the lower timeframes.
Furthermore, the way our price charts are zoomed and scaled depending on our screens can have a significant impact. Zooming out and taking a bird’s eye view can often provide a very different picture.
The left Head and Shoulders pattern on the 1H timeframe happened at the resistance level at point (4) on the right Daily timeframe. Taking a higher timeframe perspective, you can often find confluence factors for your trade timing.
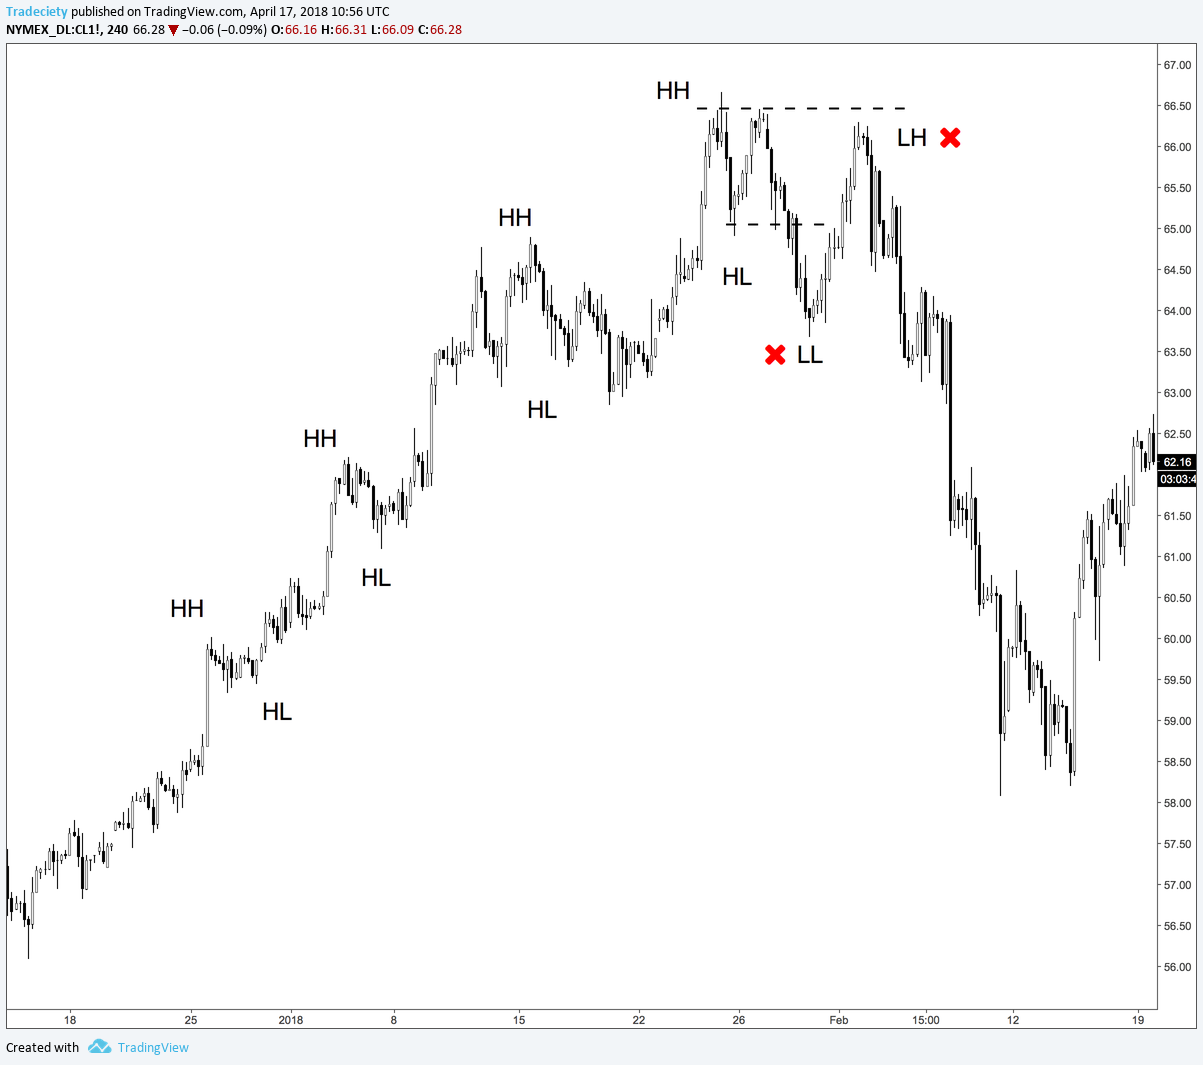
Being aware of highs and lows is crucial for a number of reasons.
First, they are being watched by almost all types of traders whether they are purely technical or trade fundamentals. And even the financial media often refers to major highs and lows.
Second, traders use highs and lows to time their entries, especially when it comes to breakout and trend following trading. Stop placement and target setting is usually also done by considering previous highs and lows.
Furthermore, all technical chart patterns can be described just using highs and lows and, thus, being a trader who can interpret the way highs and lows shape on your charts can help you avoid the template thinking.
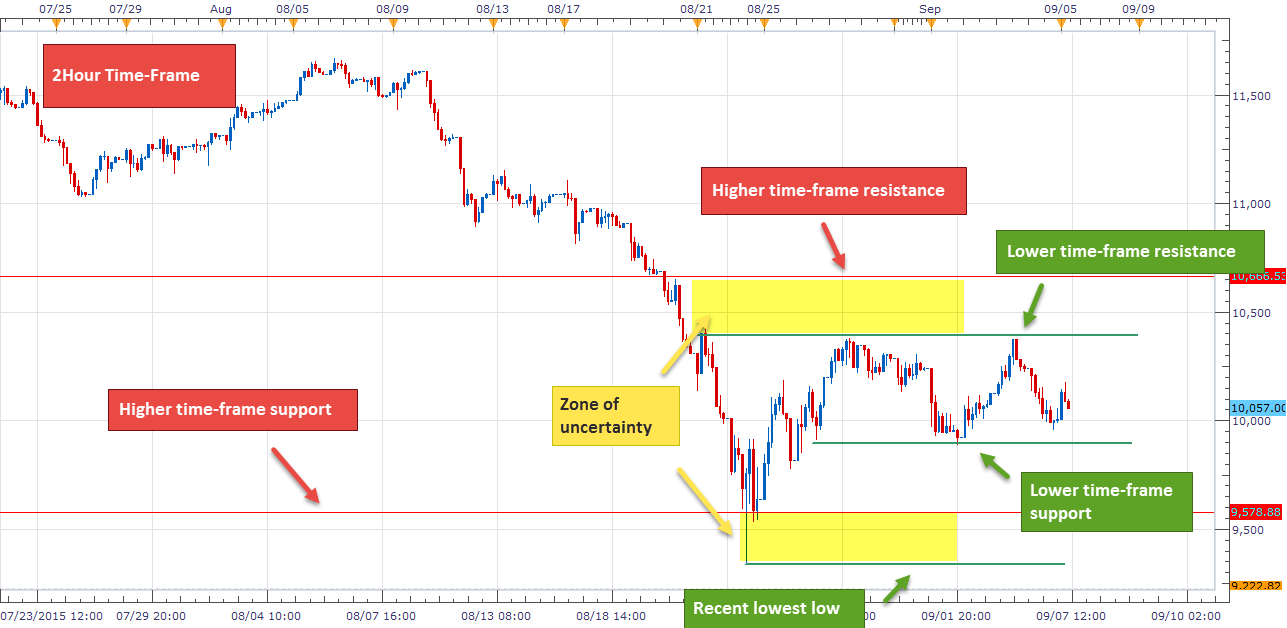
Many traders get lost drawing too many support and resistance levels at every possible price level. Instead, just focus on the most important turning points and always keep your charts fresh and only use the most recent price history.
Focus just on the most important and the most obvious levels close to current price and do not obsess about every little reaction. Paralysis by analysis is an issue that many traders face because they draw too many lines.
click to enlarge
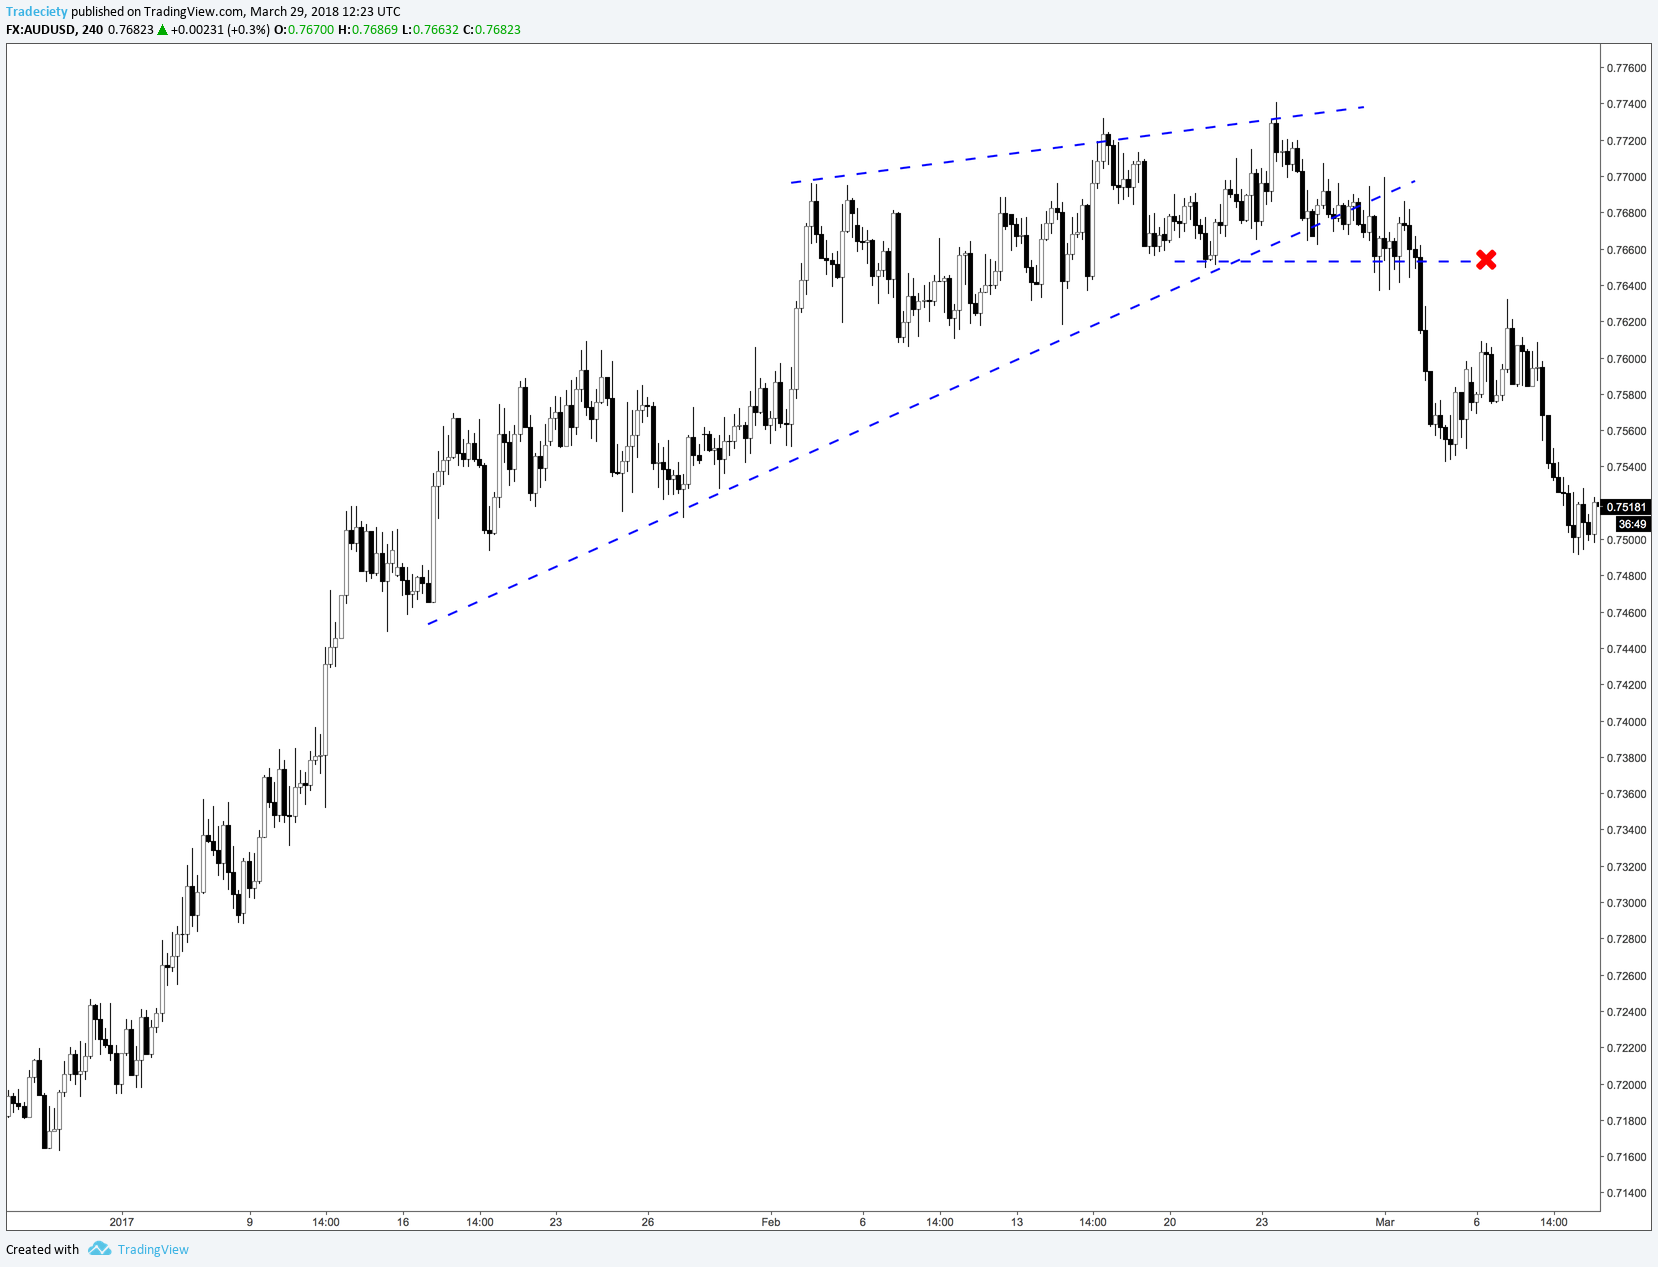
Channels and trendlines are similar to support and resistance and they are also the building blocks of many chart patterns such as the triangle or wedges – one we can see below.
Trendlines can be used to analyze trend strength when we look at how strong a trendline rises or falls. When price pulls away from a trendline or fails to move away from it, those can be important tells about the trend strength as well.
A break of a trendline can often foreshadow a new trend direction when the price fails to continue the previous trend direction.
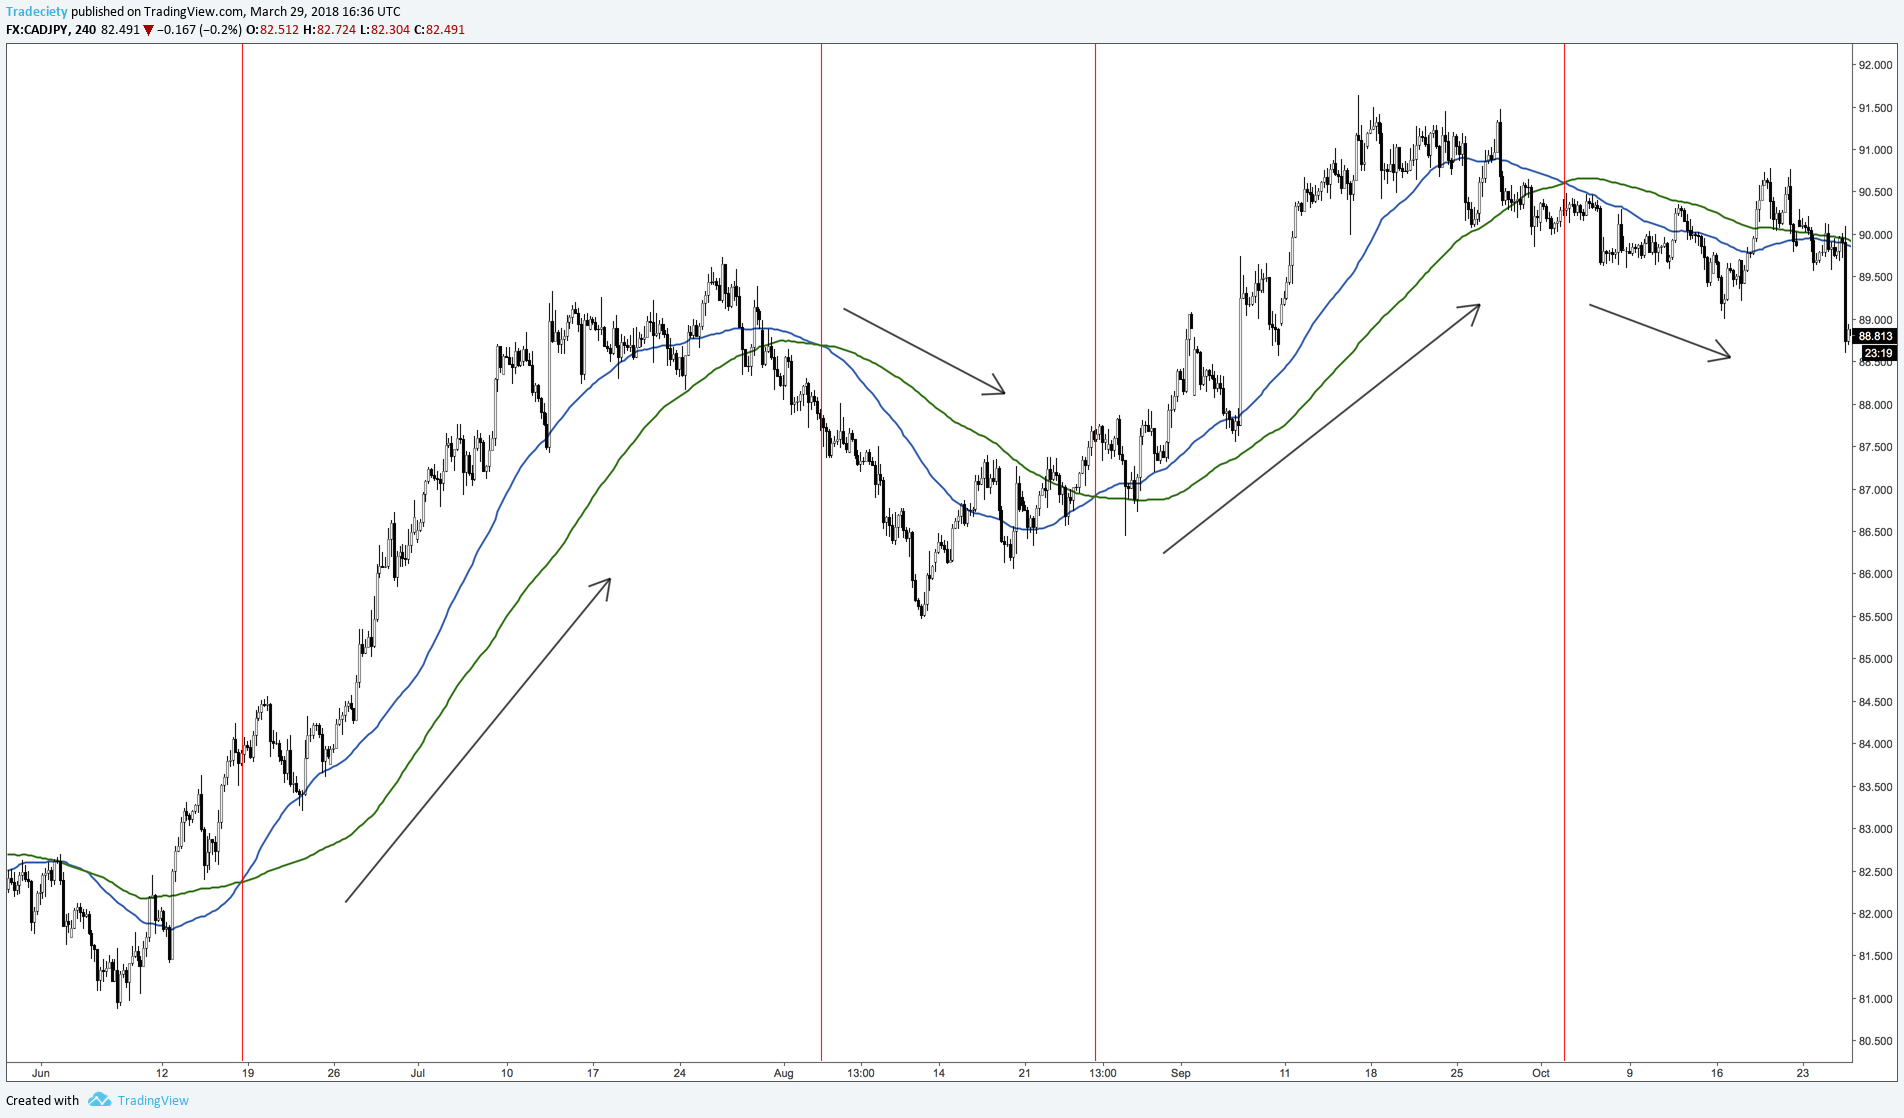
Moving averages are a wonderful tool and they can be used in many different ways.
First, you should identify on which side of the moving average the price is on. When the price is above a moving average it can signal more bullish sentiment and vice versa. Many strategies use moving averages as such a directional filter.
Second, analyze how far price is away from the moving average. The further away price is away from a moving average, the stronger the trend usually.
A break of a moving average or a cross-over are important momentum signals that can foreshadow a change in trend direction and are used by many traders.
Moving averages can act as support and resistance as well. Some markets respond more to different moving averages and being aware of it, can help your analysis.
click to enlarge
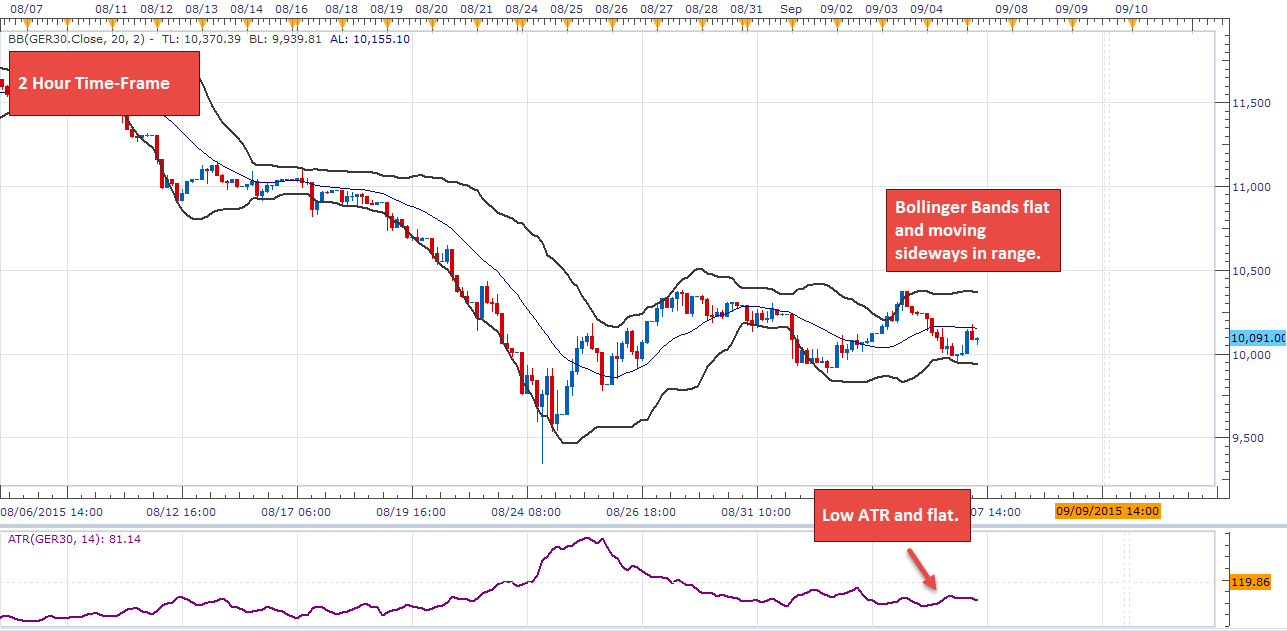
Understanding volatility is important to make sense of current sentiment and to adapt with your trading approach to the changing market conditions. There are three ways to interpret volatility:
1) Price information: Do you see lots of large candles with relatively long wicks or are the candle bodies and wicks relatively small? The long the candles and the wicks, the higher the volatility.
2) ATR indicator: The ATR indicator analyzes price information. A high ATR means that the past price range was relatively high (large candle bodies and large wicks). A low ATR means that price didn’t move as much during the duration of a candle.
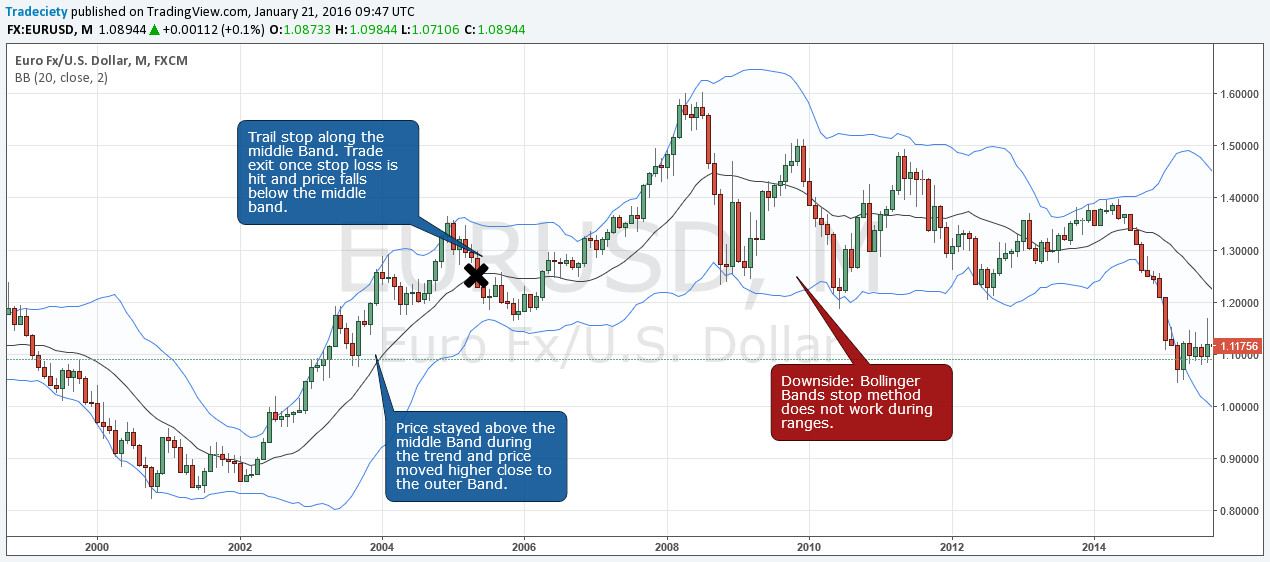
3) Bollinger Bands®. Widening Bollinger Bands show rising volatility, whereas narrow Bollinger Bands show lower volatility. The relation of price and the outer Bands is also important – if price can stay outside the outer Bands, it can signal a strong trend.
Traders generally use volatility to manage their trades and orders. When volatility is high, a wider stop and target are usually used because the market swings more. When the market is calm and volatility is low, traders would then use a narrower stop and target because the price does not move as much.
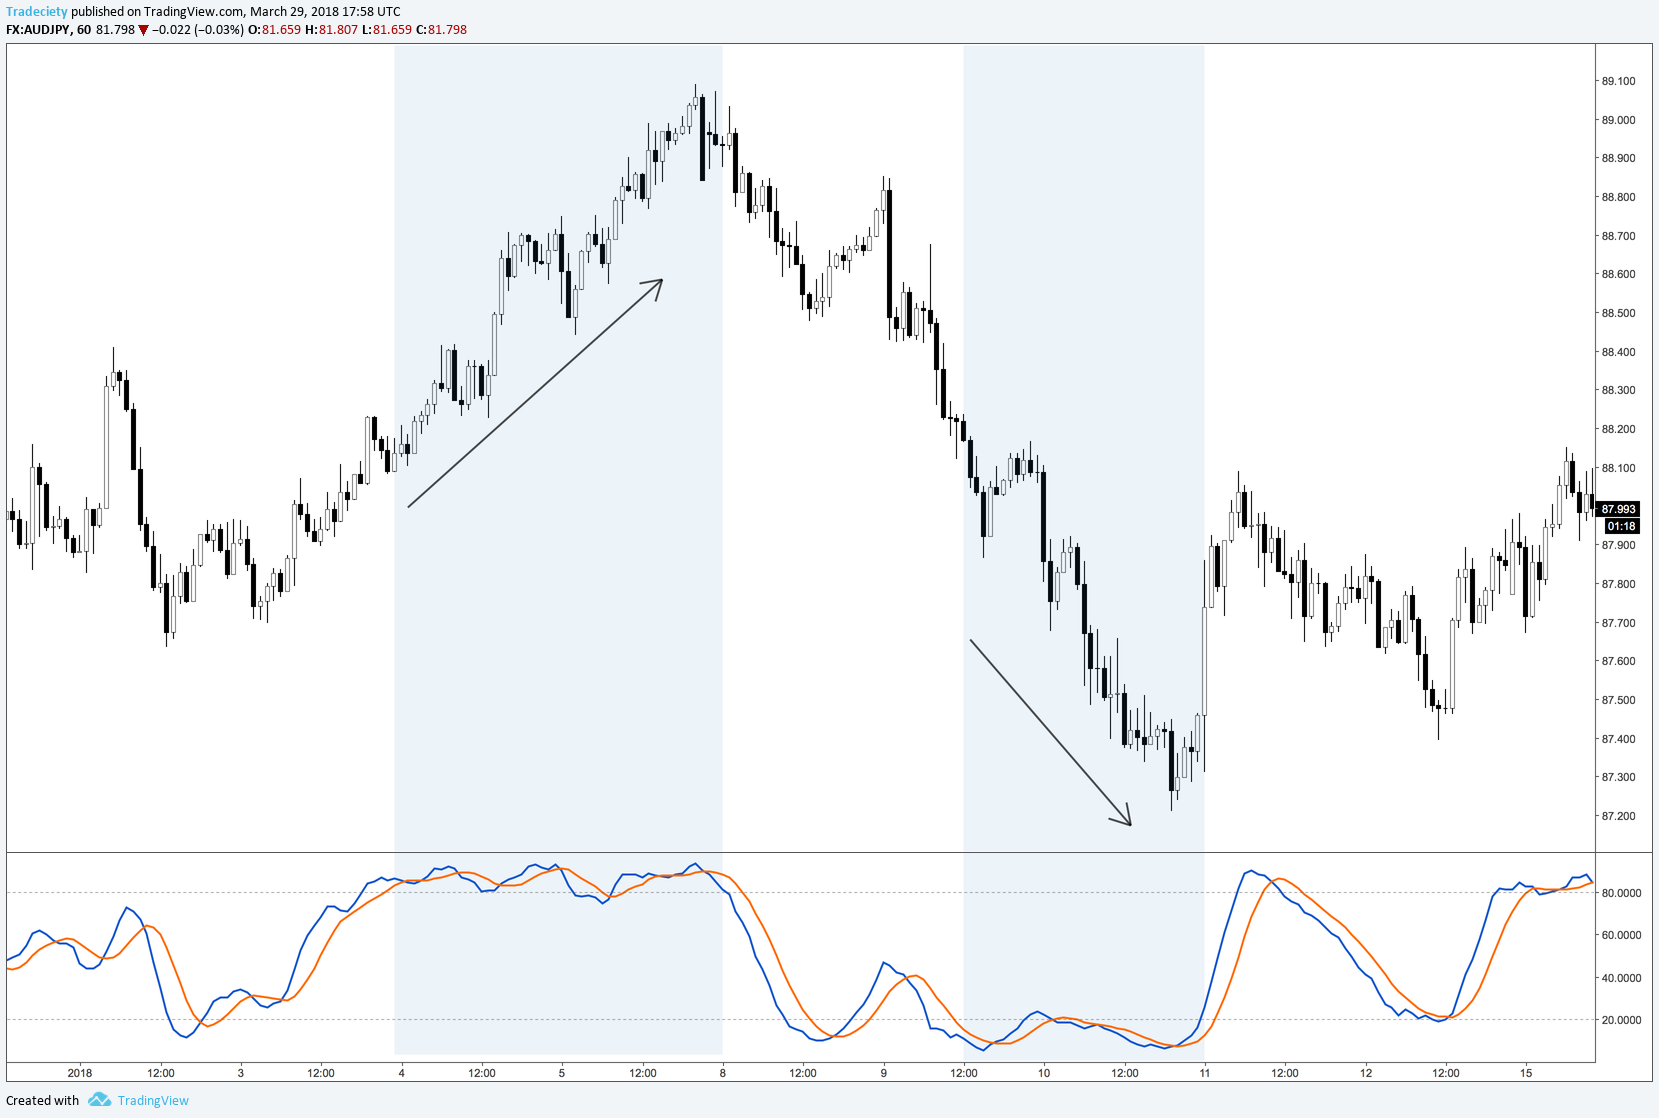
Understanding the strength of a price move and a trend is very important to estimate whether the trend is likely to continue, if support and resistance levels are likely to break or if a reversal could be coming soon if momentum is declining. We must understand momentum to make decisions about staying in a trade, getting out or adding to the position.
To interpret momentum, there are three tools that can help you:
1) RSI indicator. The RSI indicator compares bullish and bearish strength. A high RSI signals that past price action was (very) bullish and a low RSI means that bears are in control.
2) The ADX indicator. The ADX is probably among the most commonly used trend strength indicators. An ADX below 25 is signaling a range market. An ADX between 25 and 50 is indicating a trending market and an ADX reading above 50 is signaling a strong trend.
3) The Stochastic indicator. Although people believe that the Stochastic is a range indicator, it also provides information about momentum. If the Stochastic stays above 80 or below 20 for a long time, it can signal strong momentum and a strong trend. Contrary to popular believe the Stochastic does not show overbought or oversold price levels but it is a trend indicator.
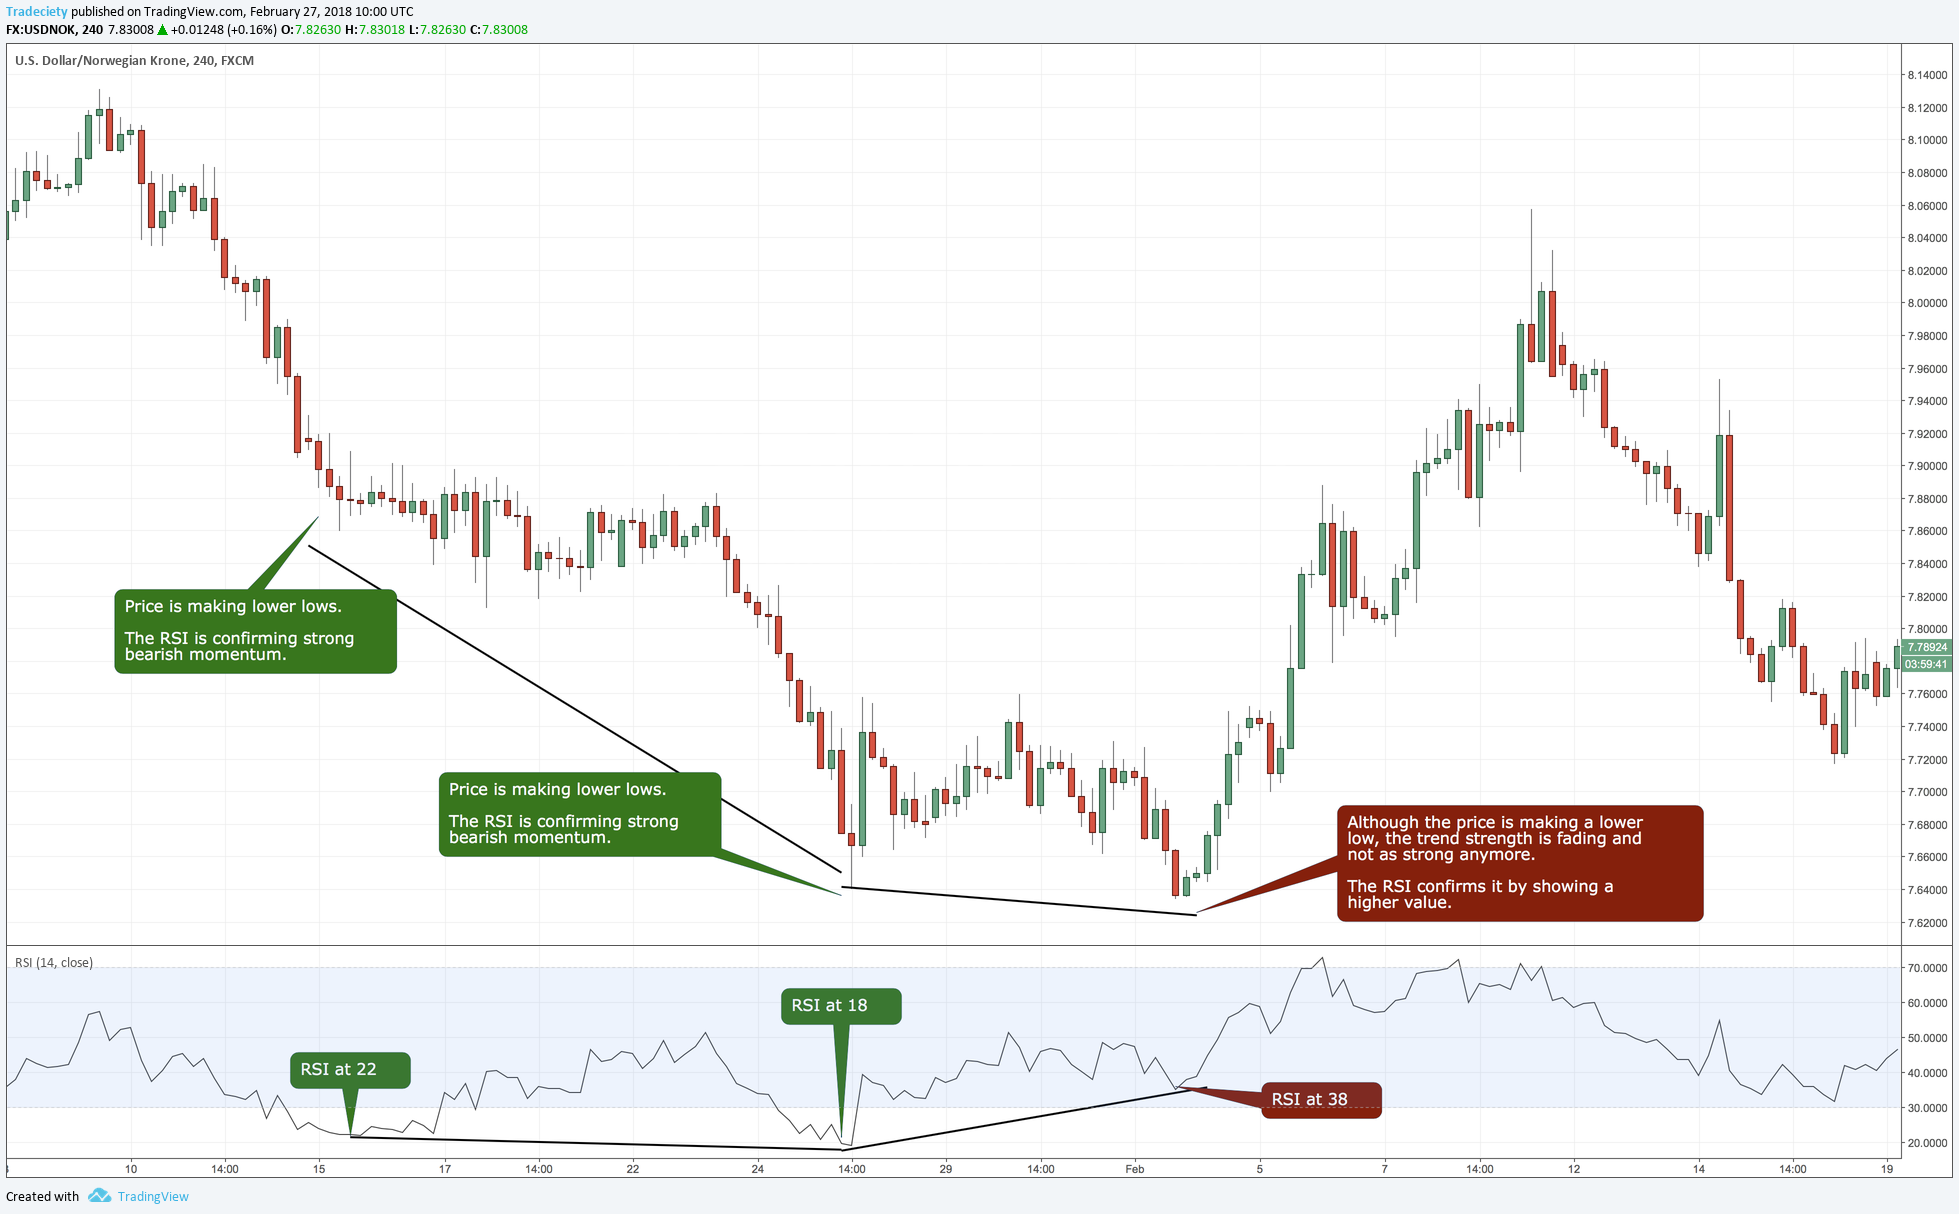
Divergences are a powerful concept because they provide information that are often not visible at first glance.
A divergence can signal that price is losing momentum, even though the price is making higher highs and lower lows. When the price moves become weaker and the price has problems continuing the trend direction, the divergence will pick up the clues and signal a potential end or a pause of a trend.
The screenshot below shows that although the price continued the downtrend, the RSI already found that the strength of the move was fading. When the RSI shows 38 during the last low point, compared to 18 during the previous low, the divergence signaled the trend reversal.
Now it is up to you to use this knowledge to make educated trading decisions. As I said in the beginning, try combining two or three concepts and build rules around it to make sense of charts, time trades and improve your edge.
external link:


We have been trading supply and demand strategies for over ten years, and they have stood the test of time remarkably well. Supply and demand is...

3 min read
Choosing the right trading journal is essential for traders wanting to analyze performance, refine strategies, and improve consistency. In this...

3 min read
“95% of all traders fail” is the most commonly used trading related statistic around the internet. But no research paper exists that proves this...