3 min read
Scientist Discovered Why Most Traders Lose Money – 24 Surprising Statistics
“95% of all traders fail” is the most commonly used trading related statistic around the internet. But no research paper exists that proves this...
When it comes to trading price actions, finding opportunities in the market by looking for candlestick patterns is one of the best ways to go about it. Candlesticks represent price and they show all data points at one glance. Candlestick trading strategies involve determining the timing of market entry based on high probability patterns and managing the trade according to some predetermined rules that conform to your money management policy.
Since Japanese rice traders developed the Candlestick by incorporating open, high, low and closing prices, traders have identified a number of patterns that offer high probability trading opportunities. Candlestick patterns come in different sizes and shapes. There are single period candlestick patterns like the pin bars, but also, you can find patterns that involve more than two bars, like the Three White Soldiers.
However, not all patterns offer the best win rate in Forex. We have identified eight major candlestick patterns that actually work in Forex. Let’s take a look at how you can benefit from identifying these patterns and develop trading strategies around them.
Pin bars are the most effective ways to trade candlesticks as these formations tend to create high probability price action trading setups. A pin bar forms when the price goes up or down during a single time period, but the closing price remains within the previous bar.
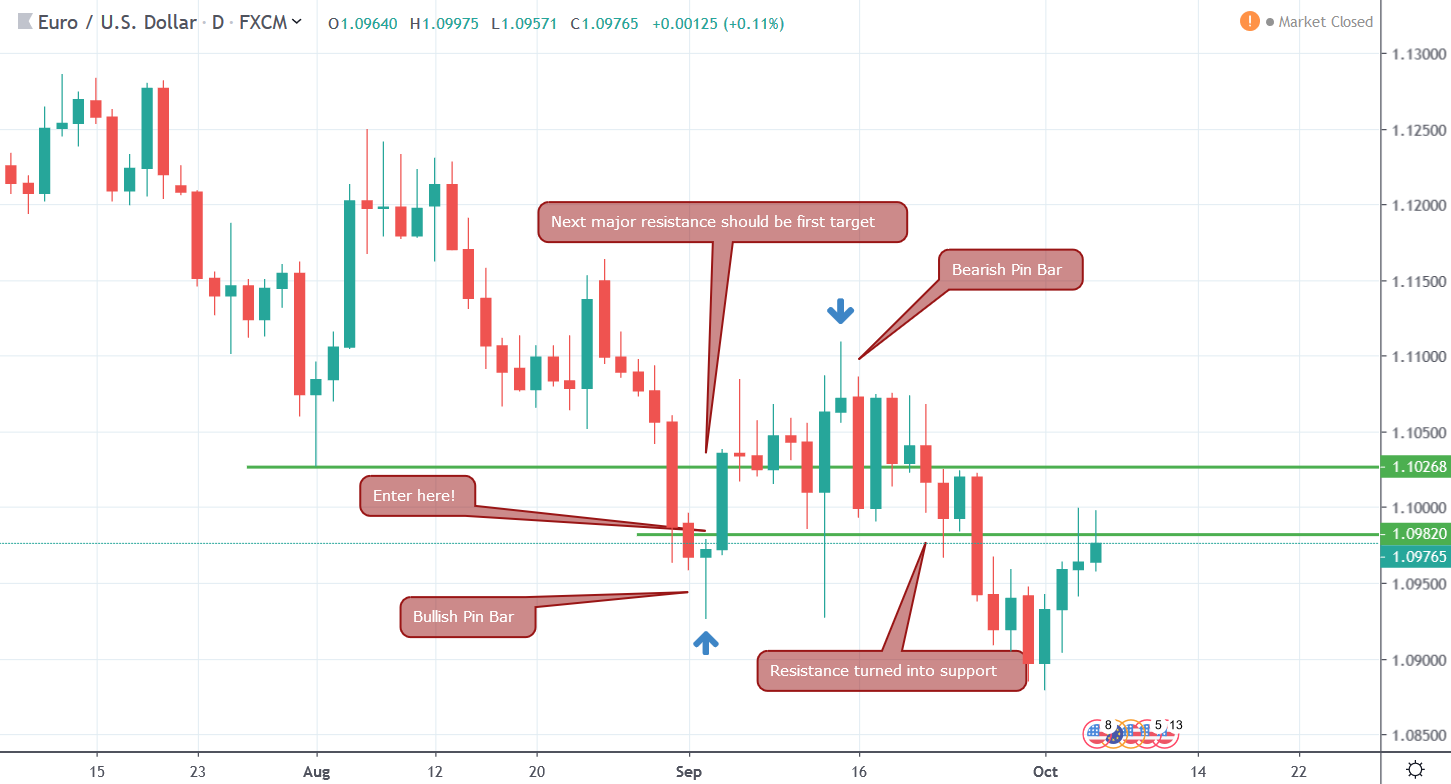
Figure 1: Pin Bar Trading Strategy
In Figure 1, we have identified two pin bars, a bullish one and a bearish one. The way you trade pin bars is you wait for the asset’s price to break above or below the high or low, respectively. At that point, you enter the market.
Pinbar setups are triggered once the price of the next candlestick breaks above the body of the pinbar. Once your order is triggered, you can look for next support and resistance levels to find your primary profit target. If you are a short-term trader, you can simply target a reward to risk ratio of 3:1 or any other ratio that suits you.
However, when you find pin bars forming at the extreme high or low of a sustained trend, it would signal a complete reversal of the prevailing trend. Hence, trailing your open position based on ATR or X-bar stop losses could be a good strategy as it would maximize your profit in the long-run.
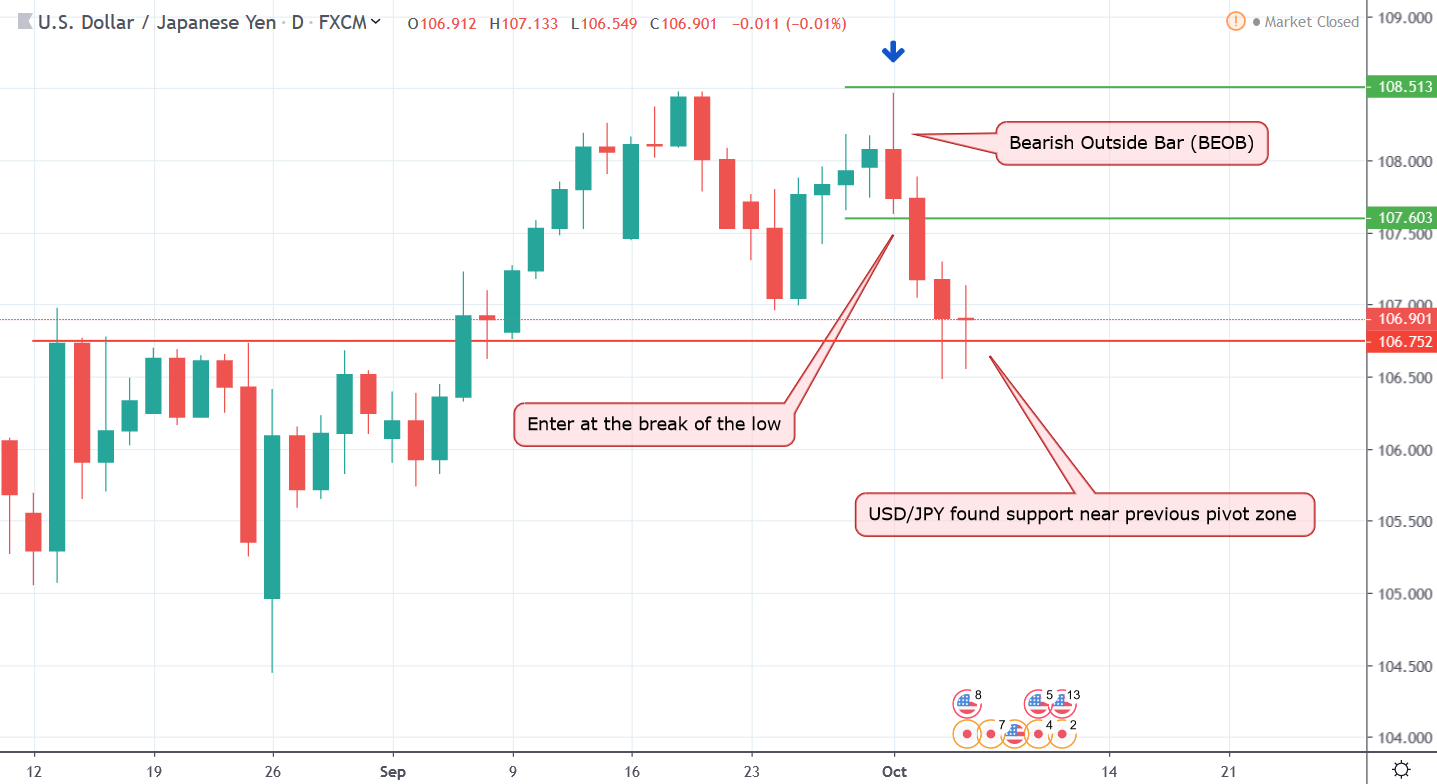
Just like pin bars, bullish and bearish engulfing candlestick patterns also signal a reversal of the prevailing trend. In the western trading industry, these patterns are better known as Bullish Outside Bars (BUOB) and Bearish Outside Bars (BEOB). If you see a bar has higher highs and higher lows compared to the previous bar, it is an outside bar. If the closing price is lower than the opening price, then it is a BEOB and if the closing price is higher than the opening price, you guessed it right, it is a BUOB.

Figure 2: Bearish Outside Bar Triggered Downtrend
In figure 2, we can see a large bearish candlestick has engulfed the previous, smaller, bullish candlestick. By definition, it is a Bearish Outside Bar (BEOB). If you have placed a sell stop order few pips below the low of the BEOB candlestick and targeted the next pivot zone, it would have turned out to be a winning trade with a decent reward to risk ratio.
While it is best to look for Engulfing candlestick patterns at the top or bottom of a trend for reversal signals, you can also trade these during a more range-bound market. Engulfing candlesticks often breaks above or below a range and you can catch some nice breakout trades with these patterns.
Since Engulfing candles are usually longer than pin bars, the size of your stop loss needs to be rather high. One way to mitigate this problem is by drawing Fibonacci retracements based on the high and low of the engulfing bar itself and setting a stop loss at a certain Fibonacci level.
Most candlestick trading strategies are either suited for trend reversal or trend continuation. However, inside bars are those rare gems that can signal both, depending on where in the chart they form. An inside bar is like the opposite of an engulfing bar. Its high and low are shorter than the previous bar and it sits inside the previous bar’s high and low.
However, keep in mind that trading these means you need to wait for the asset’s price to break above or below the high or low of the previous (longer) bar’s high and low, respectively.
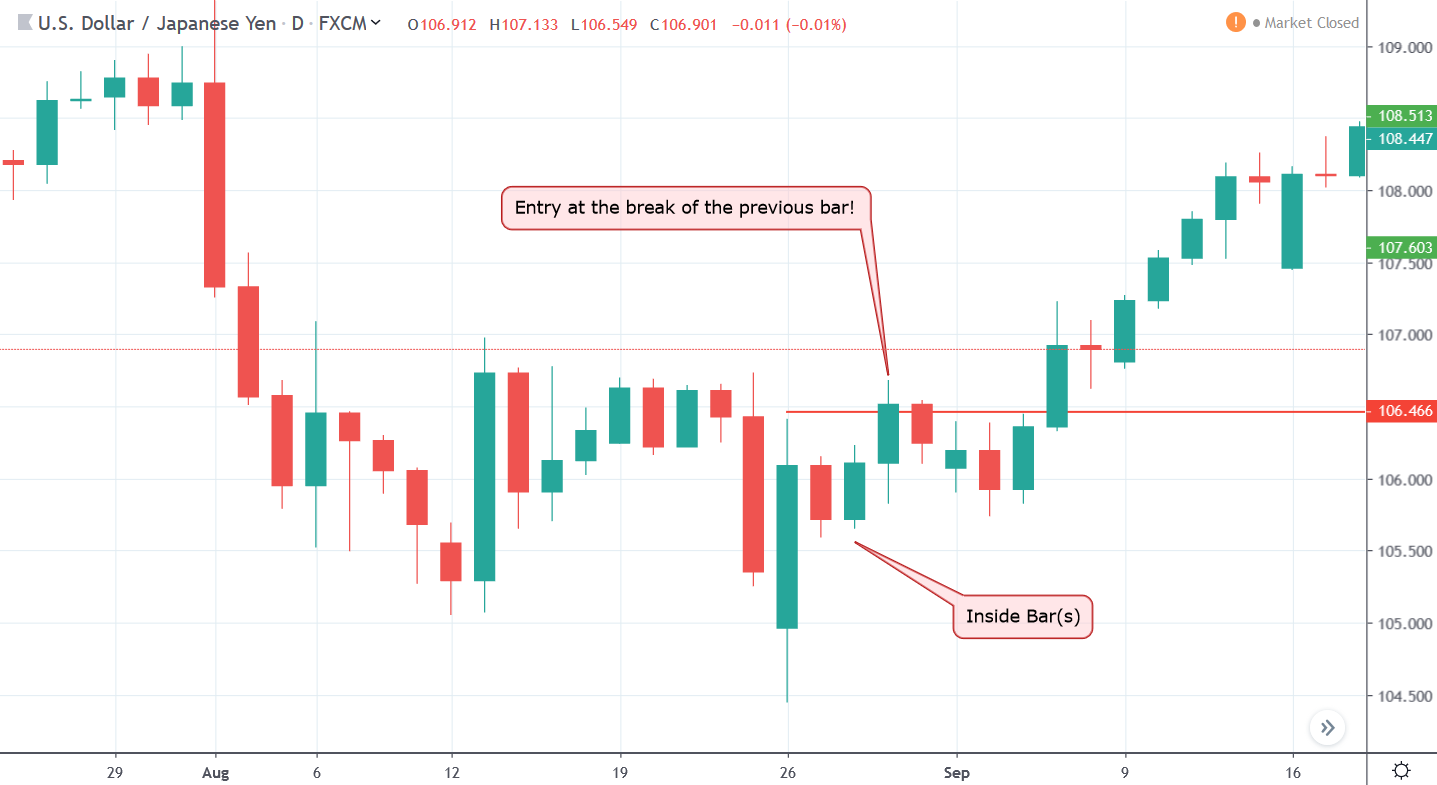
Figure 3: Inside bars Can Signal Both Reversal and Trend Continuation
In figure 3, we can see that after the large bullish bar, two smaller bars formed within the high and low of the previous large bar. Inside bars like these can range from a single bar to several and it really does not matter if these inside bars are bullish or bearish. As long as these smaller bars do not cross the high or low of the larger bar, this would be considered as a valid inside bar pattern.
Once you see price breaking above the high of the larger bar, which is often called a Mother bar, it would signal a start of a momentum trade. In figure 3, the break above the high of the mother bar triggered a bullish trend.
However, if you find these inside bar patterns during a strong trend, it can also signal trend continuation. In either case, you should set your stop loss above or below the mother bar. If your money management strategy requires a smaller stop loss, aggressively setting the stop loss above or below the range of inside bars can also be a good strategy. However, it is rather risky and if you are a beginner trader, sticking to set stop loss around the mother bar would be preferable.
A Doji is formed when the opening and closing prices are almost the same. Well, the official definition is that both the opening and closing price has to be the same. However, the difference can be a pip or two, but no more, and you can still consider it as a Doji.
There are several variants of Doji based on which way the price moved first then reversed. For example, if the high and low are situated at equal distance from the open and closing prices, it is called a Star Doji. If the price goes up and down but returns to close at the opening price, it will be considered as Gravestone and Dragonfly Doji, respectively. These two patterns look like the letter T and an inverse letter T and considered bullish and bearish signals.
When you see a Doji formation, it screams indecision in the market. But you should also consider the location of the Doji bar. If a Doji forms during a strong trend, it can signal trend continuation if the price breaks above the Doji.
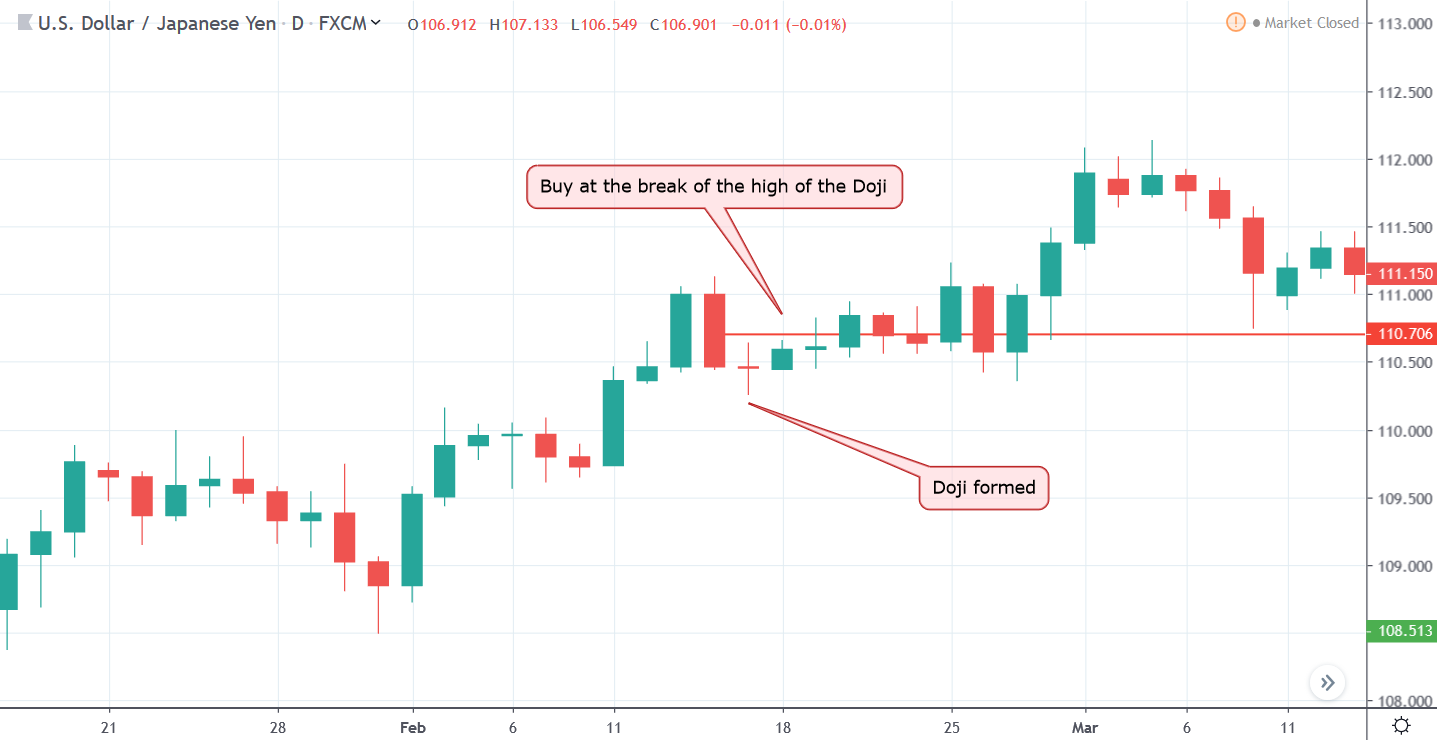
Figure 4: Doji Signals Indecision, but You Should Focus on Which Way It Breaks
In figure 4, a Doji formed during an uptrend and signaled temporary equilibrium in the market. However, as soon as the asset’s price broke above the high of the Doji, the uptrend continued.
If you have placed a buy stop order a few pips above the high of the Doji Sar bar, you could have increased your long exposure or entered the market for the first time. Regardless, since Doji bars are rather small in size, you can always get away with setting a tight stop loss and maximize your reward to risk ratios.
Three bars are the easiest candlestick patterns to identify. There are two types of three bars, the Three White Soldiers that signal a bullish reversal and Three Black Crows that signals a bearish reversal.
As the name suggests, when three subsequent bullish and bearish bars form at the top or bottom of a sustained trend, these signals a reversal.
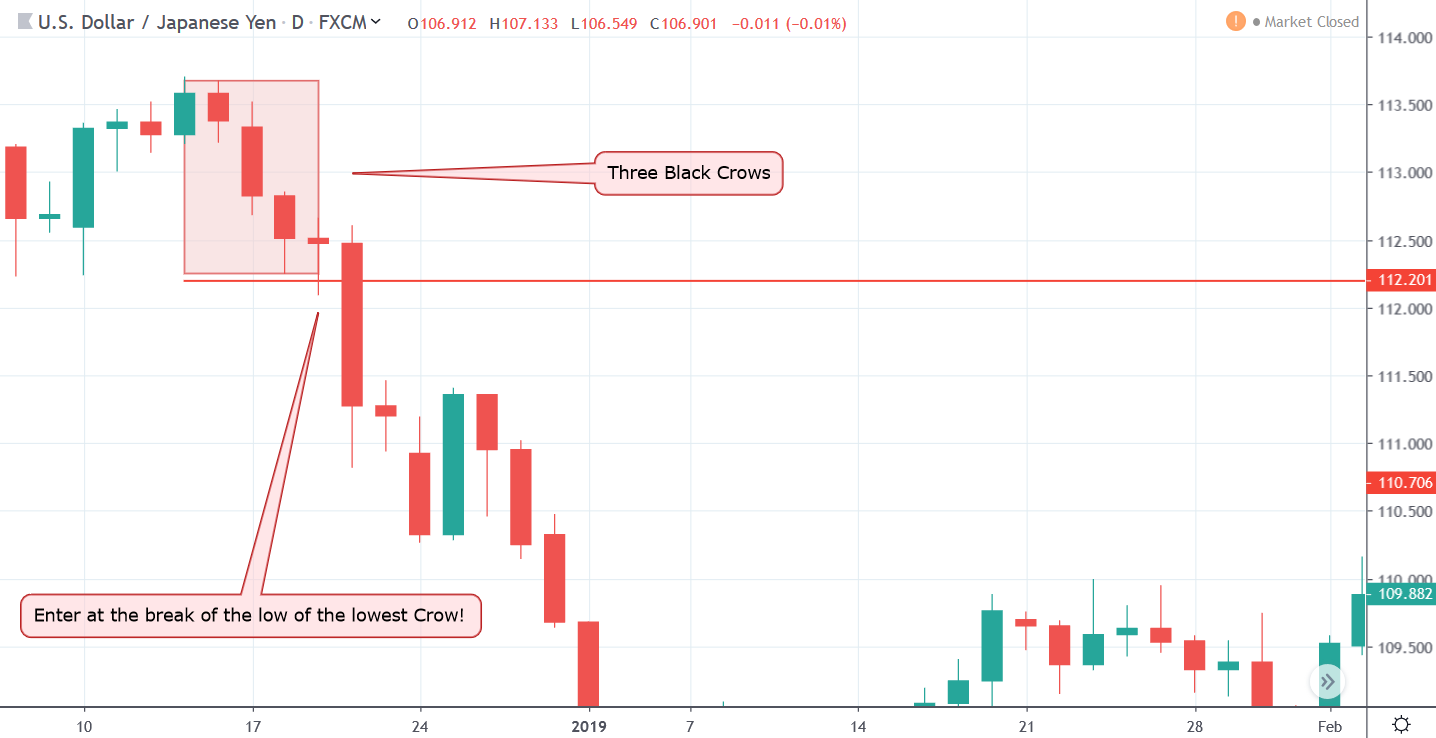
Figure 5: Three White Crows Triggered a Bearish Trend
In figure 5, we can see three rather decent looking bearish bars formed at the top of an uptrend. Keep in mind that the first bearish bar’s high was not the highest peak in the trend and that is fine. As long as the three bearish bars form near the top of a bullish trend, it should be considered as a Three Black Crows pattern.
As you can see, once the asset’s price broke below the low of the lowest bearish bar, the downturn continued. Sometimes, after the low is broken, the price may retrace a bit but that is fine. You should set your stop loss above the high of the highest Crow.
The same principle can be applied to Three White Soldiers, which is a bullish signal pattern.
A hanging man pattern forms when there is a large bearish movement, but the price ends up closing near the opening price, leaving a long shadow that is usually twice the size of the body of the Candle. Hanging man looks a bullish pin bar but usually forms at the top of an uptrend, often with a gap. But it is fine if there is no gap.
Keep in mind that Hanging Man patterns should be always considered as a bearish signal and you should not place a bullish order if the price breaks on the upside. Nonetheless, there is a similar-looking pattern that forms at the bottom of downtrend, which is called a Hammer and that signals bullishness in the market.
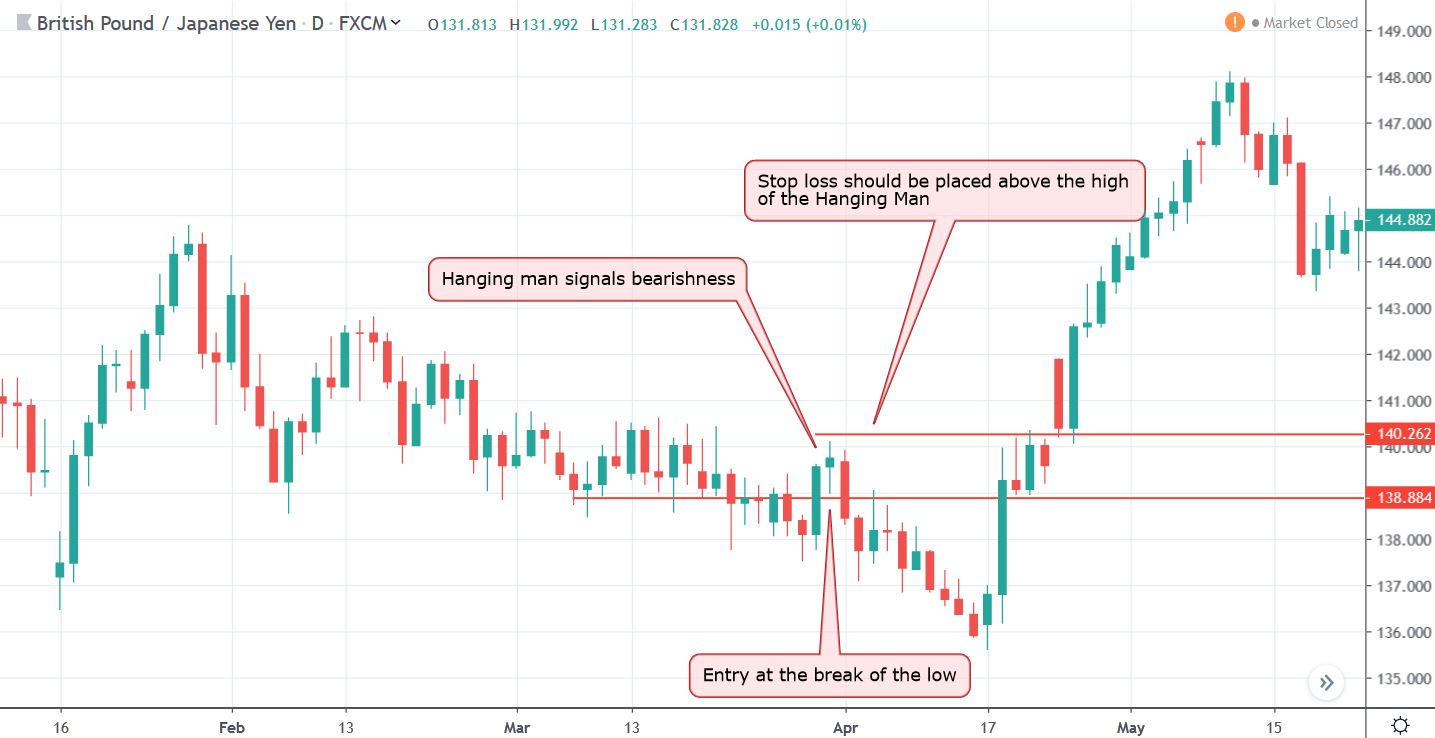
Figure 6: Hanging Man Triggers Bearish Trade
In figure 6, we can see a hanging man candlestick pattern forming and as soon as the low of the bar is broken, it triggers a bearish trend that lasted for several bars. Here, you should set a stop loss just above the high of the Hanging Man pattern.
The Three methods of candlestick trading strategy is a bit tricky. Tricky in a sense that the rising three method pattern has three smaller bearish candlesticks after forming a large bullish candlestick. By contrast, the falling three method pattern incorporates three smaller bullish candlesticks after a large bearish candlestick is formed.
For the rising three method pattern to form, a large bullish bar has to appear, followed by three smaller bearish candlesticks that remain above the low of the first large bullish candlestick. Then, a fifth bullish candlestick must form that breaks above the high of the first bullish candlestick and closes above it. Pretty complicated when you read it, but let’s take a look at an example chart and it should be pretty clear.
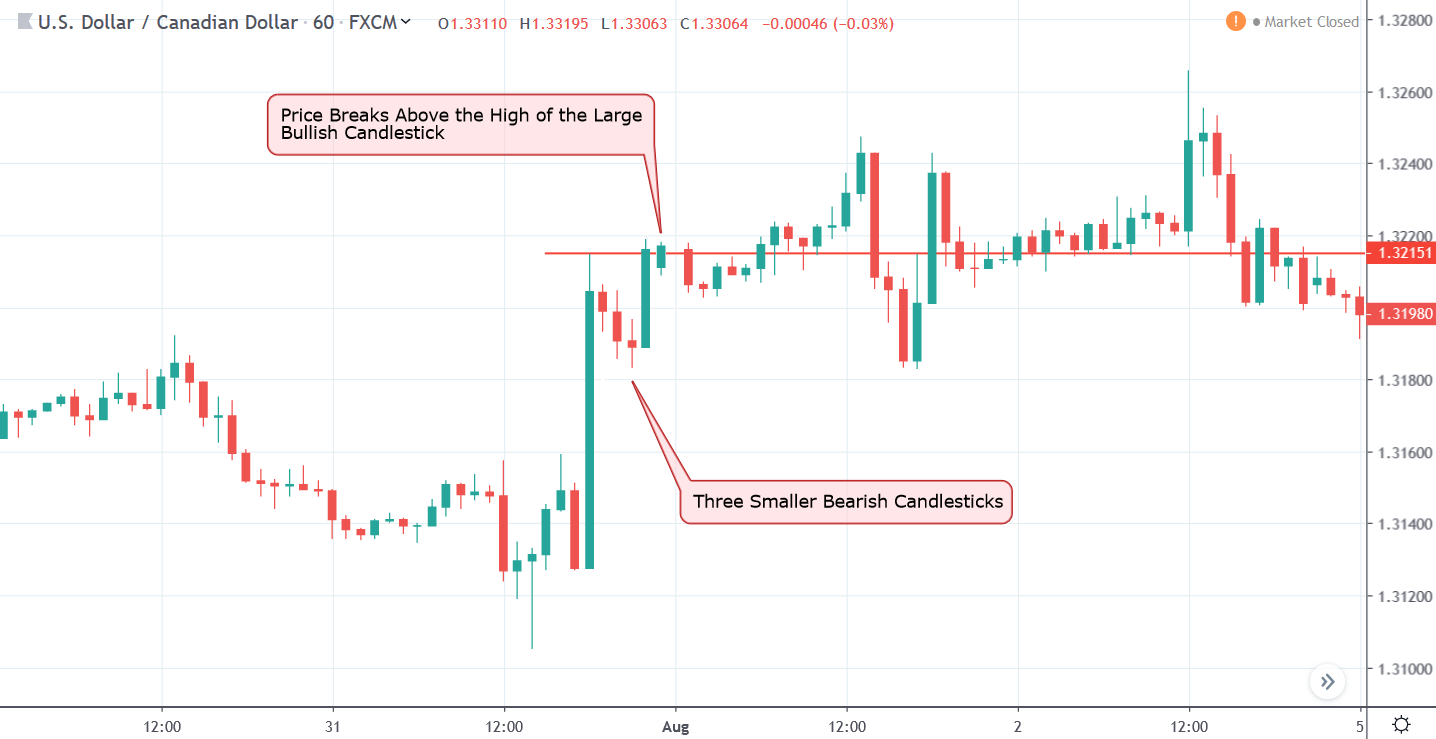
Figure 7: Rising Three Method Trend Continuation Signal
In figure 7, we can see a large bullish candlestick and three smaller bearish ones. The fifth bullish candlestick engulfed the three bearish candlesticks and closed above the high of the first candlestick, completing the rising three method pattern.
The best way to trade these patterns would be to wait for the close of the fifth candlestick, then enter with a market order. Aggressive traders may set a stop loss below the low of the third bearish bar and more conservative traders may choose to put a large stop loss below the low of the first bullish candlestick.
For falling three method patterns, you can trade similarly on the opposite side.
The Harami Cross pattern consists of a bullish or bearish candlestick at the top or bottom of its trend, followed by a Doji that remains within the range of the previous candlestick. If a bullish candlestick form, then you see a Doji that sits inside high and low like an inside bar, you can expect a bearish retracement soon.
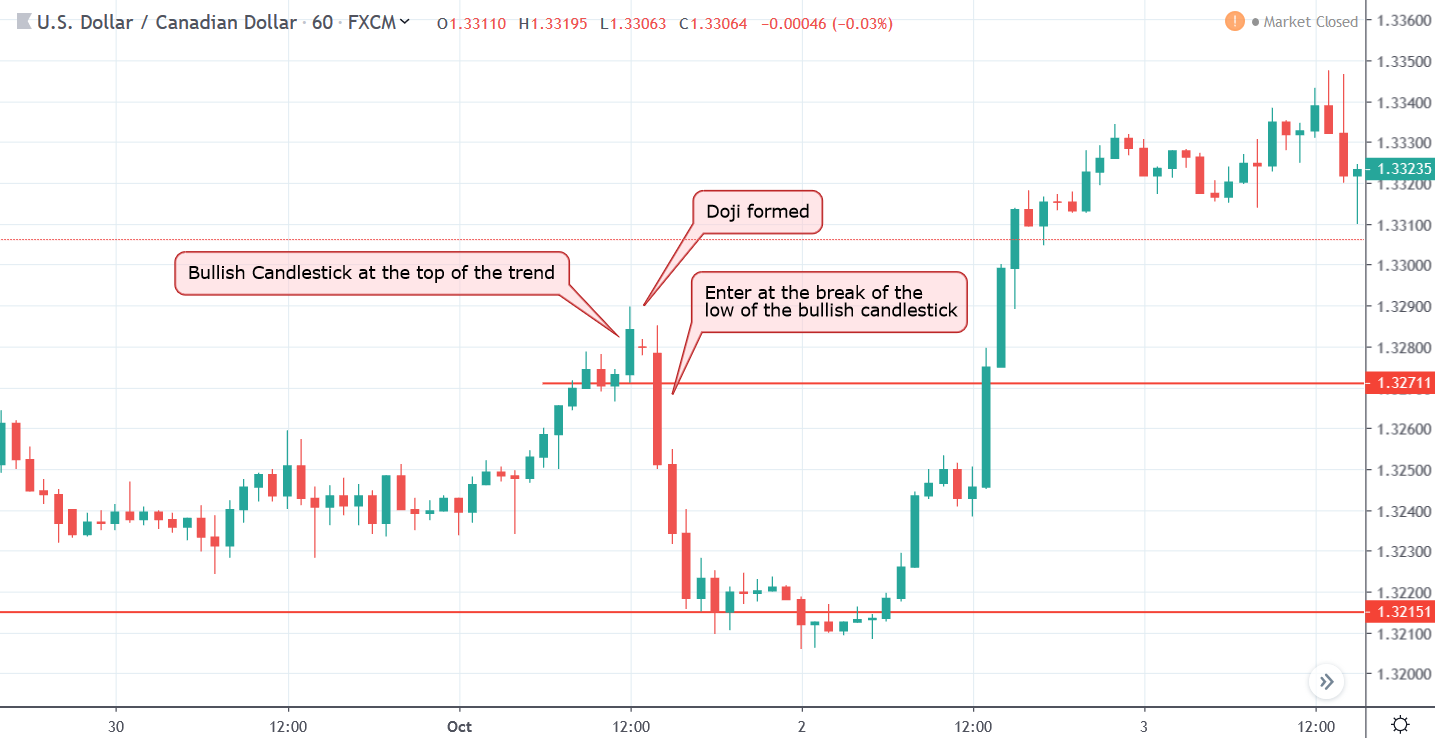
Figure 8: Harami Cross Signals Bearishness
In figure 8, we can see a Harami cross, forming at the top of a bullish trend. However, you should wait for the asset’s price to break below the low of the bullish candlestick and the best way to do so would be placing a Sell Stop order a few pips below the low.
Candlestick pattern-based strategies are easy to trade as most of the time you just need to wait for the pattern to form and place a buy or sell stop entry order above or below the candlesticks. This way, you enter the market right when the trade confirmation happens.
While entering the market with the candlestick strategies we discussed would be easy, to successfully implement these strategies would require prudent money management as well as how and when you decide to exit.


external link:


3 min read
“95% of all traders fail” is the most commonly used trading related statistic around the internet. But no research paper exists that proves this...

3 min read
Trendlines can be great trading tools if used correctly and in this post, I am going to share three powerful trendline strategies with you.

3 min read
Choosing the right trading journal is essential for traders wanting to analyze performance, refine strategies, and improve consistency. In this...