3 min read
Scientist Discovered Why Most Traders Lose Money – 24 Surprising Statistics
“95% of all traders fail” is the most commonly used trading related statistic around the internet. But no research paper exists that proves this...
Many traders have heard about the Wyckoff method and the Wyckoff trend analysis. In this article, we help you understand the different Wyckoff concepts and we share tips on how to include the Wyckoff analysis in your trading.
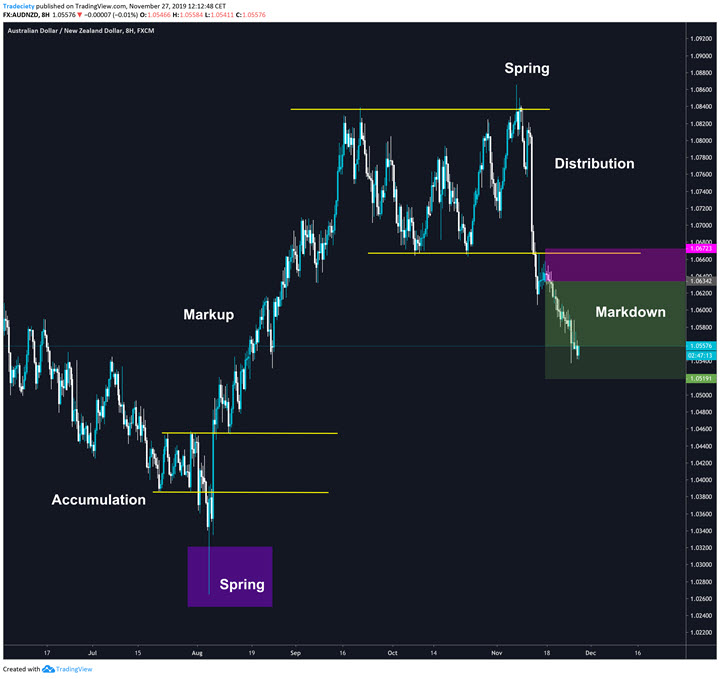
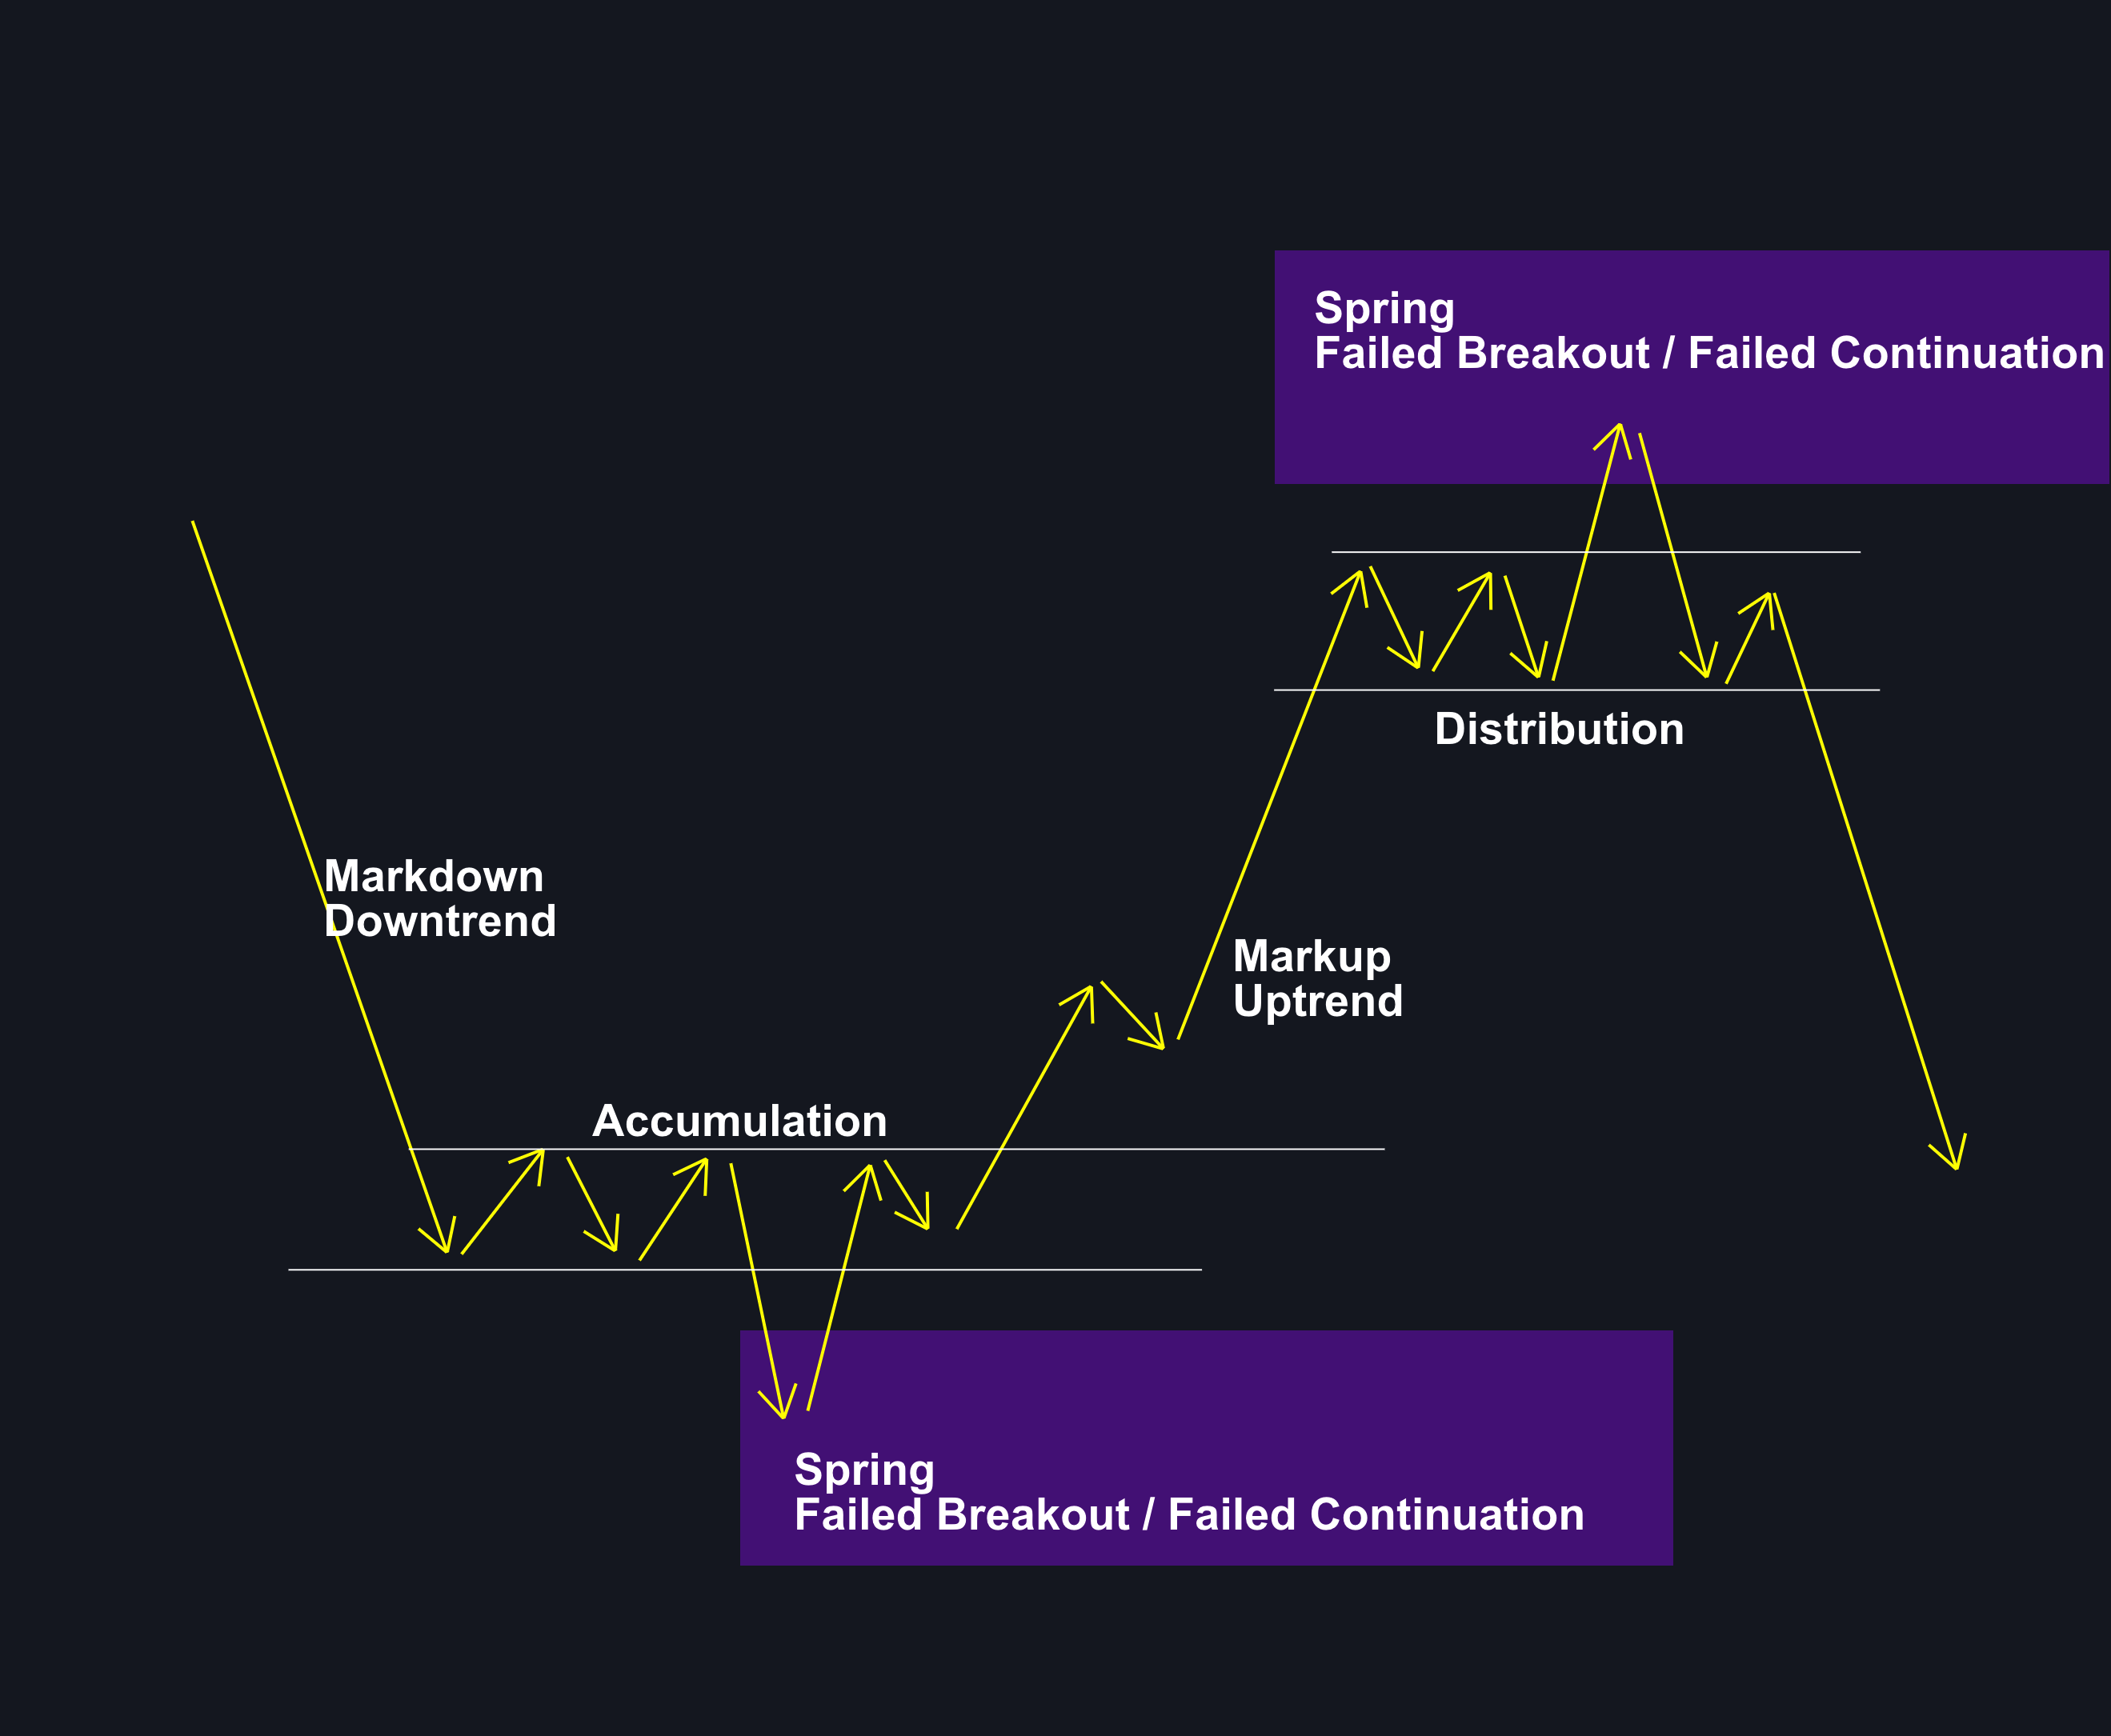
At the core of the Wyckoff method are the different trend and market phases which the graphic below shows:
Of course, not all markets will follow this pattern all the time, but once you are familiar with this approach, you will start noticing time and again.
In the following, we will analyze various Wyckoff-based chart scenarios.
The most important market participants are the so-called “big players”. Those are central banks, hedge funds, regular banks and governments – among others. They are the ones who move the markets.
Those market participants cannot just enter their trading positions at once, but they need to slowly build their position. This usually happens during the accumulation and distribution phase. They need to carefully unload their previous positions and then build a new position. It is very important for those market participants that the price does not run away from them until they have built their position fully.
For retail traders, it is advisable not to get involved during the accumulation and distribution sideways phases and wait for the breakout and/or the pullback.
Retail traders chase price way too often and get into trends too late usually. Since most trading literature recommends trend-following trading as the “easy way to make money”, the average retail trader waits for a trend to present itself. However, it may be more profitable to get into a trend as close to the zone where those big players trade.
This is why we personally trade and teach breakout and pullback trading strategies. The general trend-following approach often yields worse results.
When I research trading concepts or teach my strategies, I focus mostly on non-textbook patterns. The price rarely follows the perfectly mapped-out textbook patterns and exposing yourself to as many different chart studies can be helpful for your actual trading.
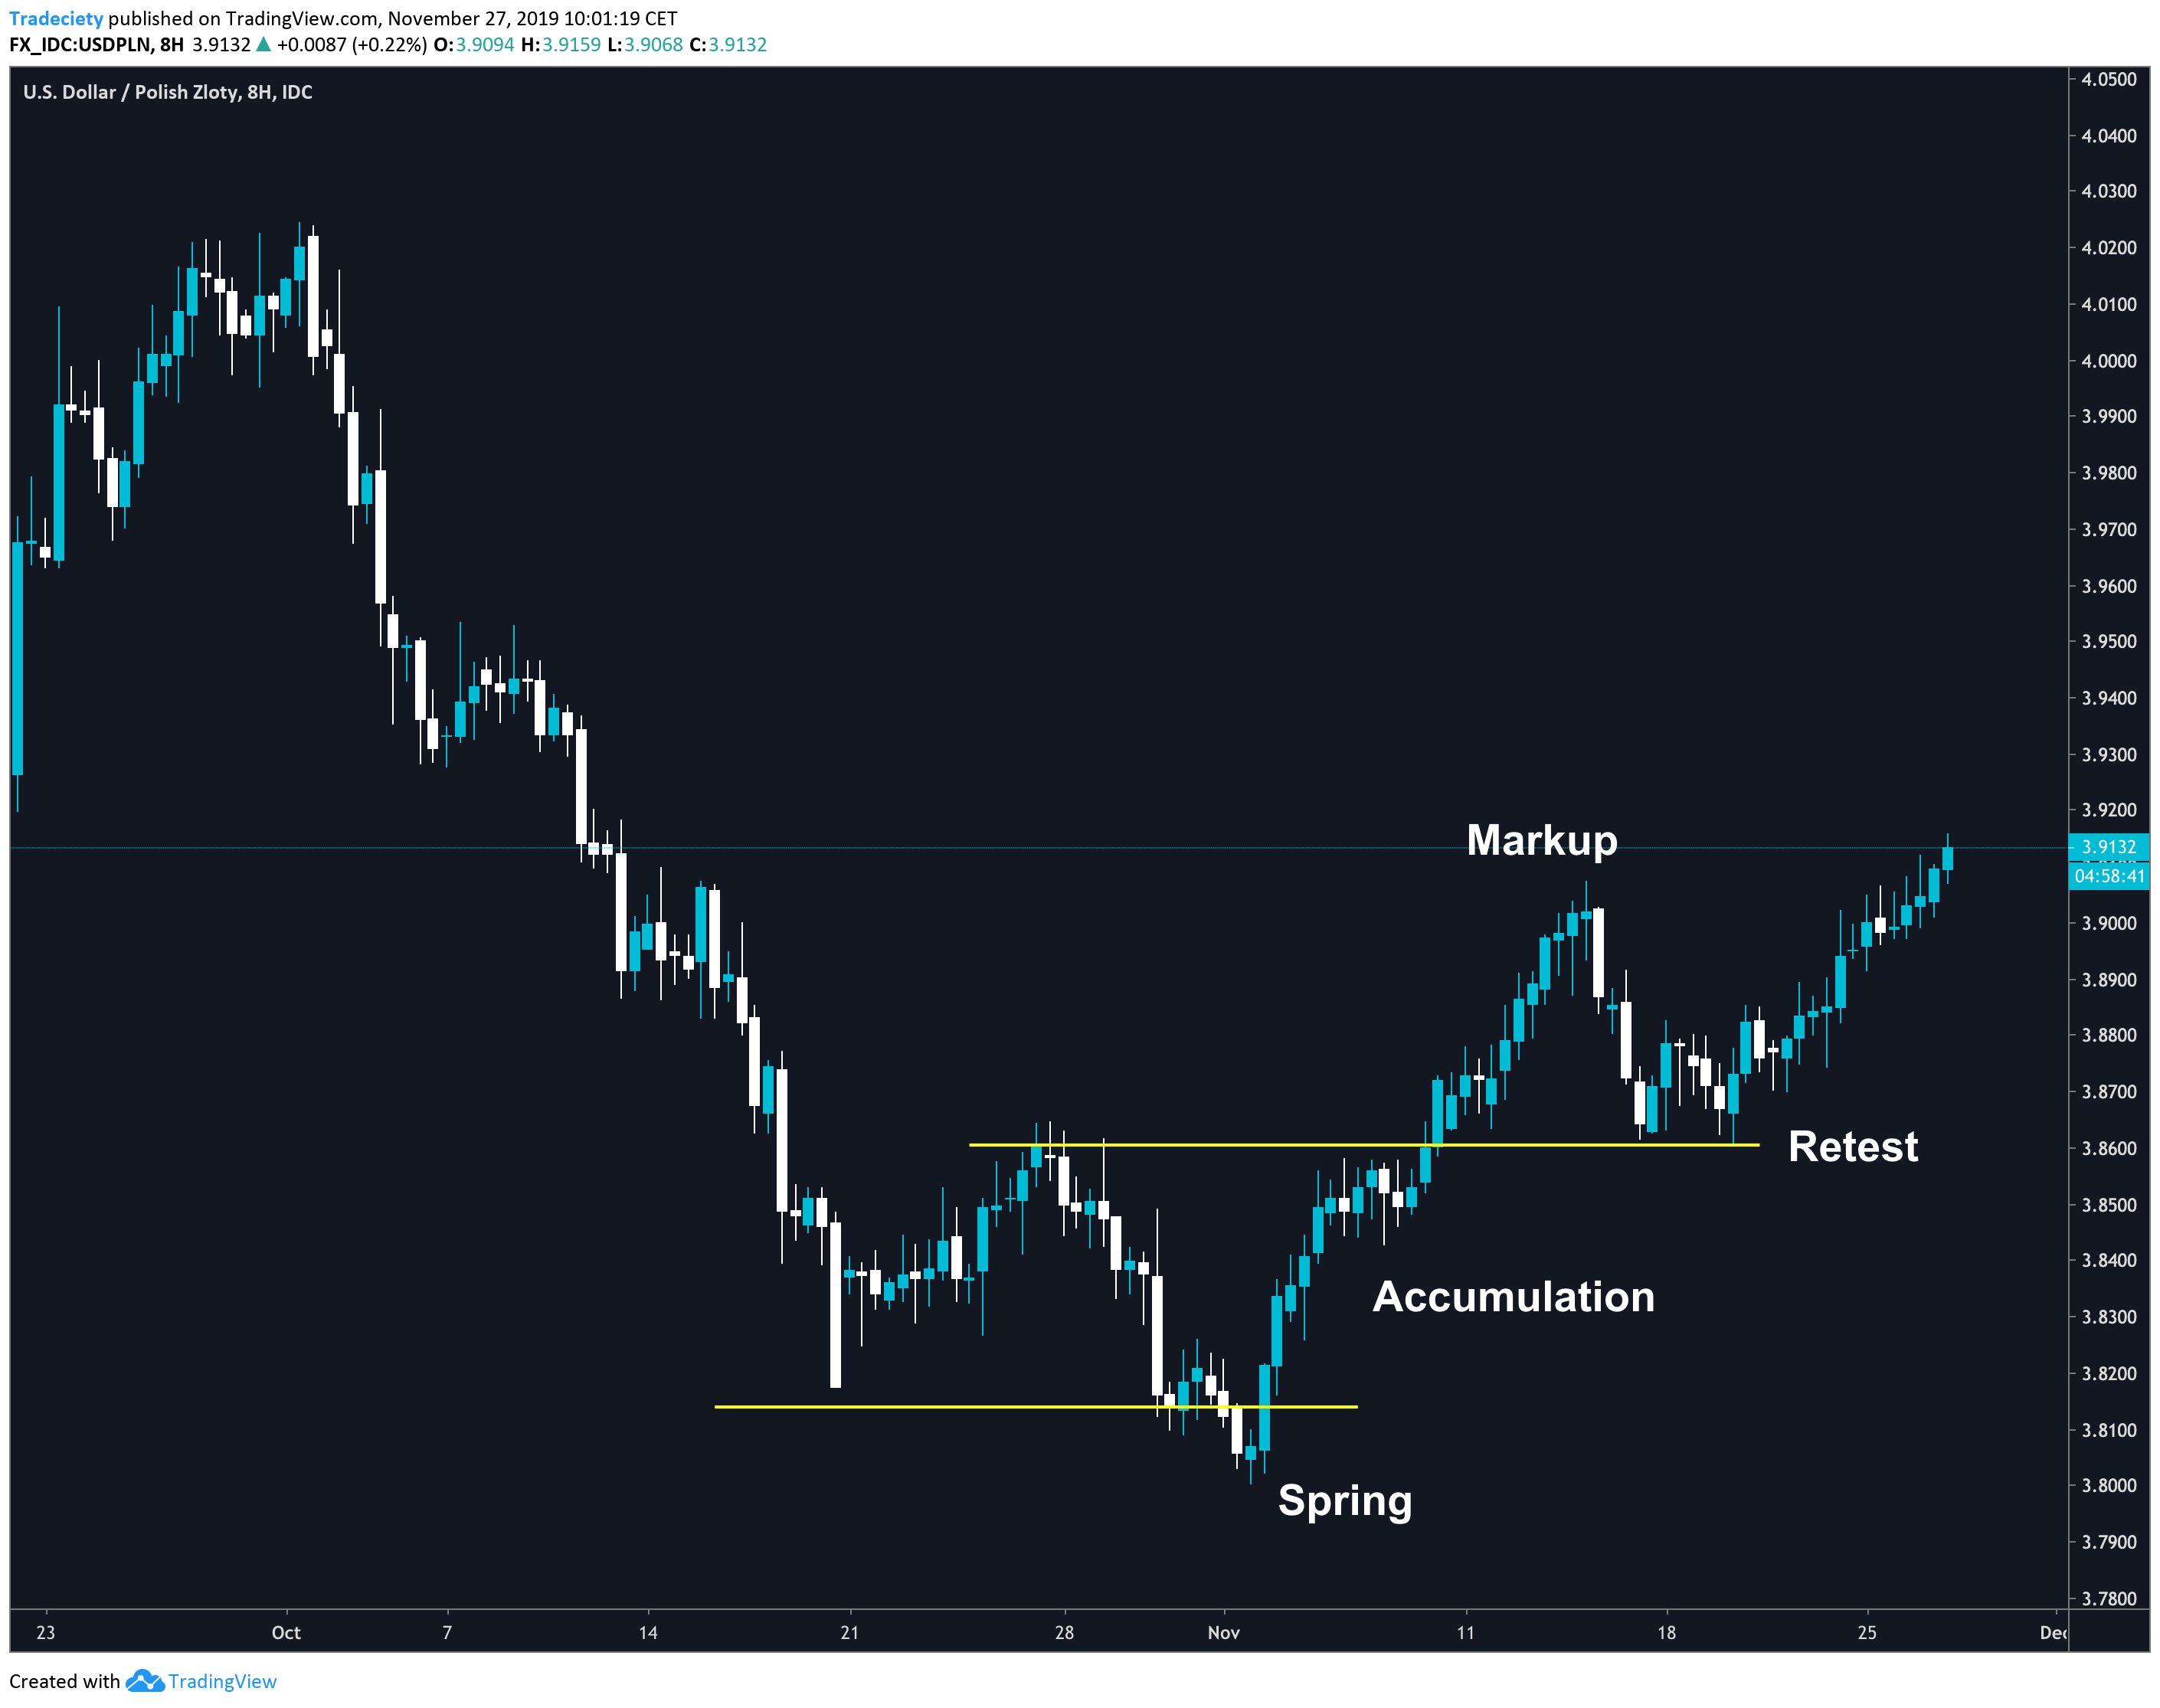
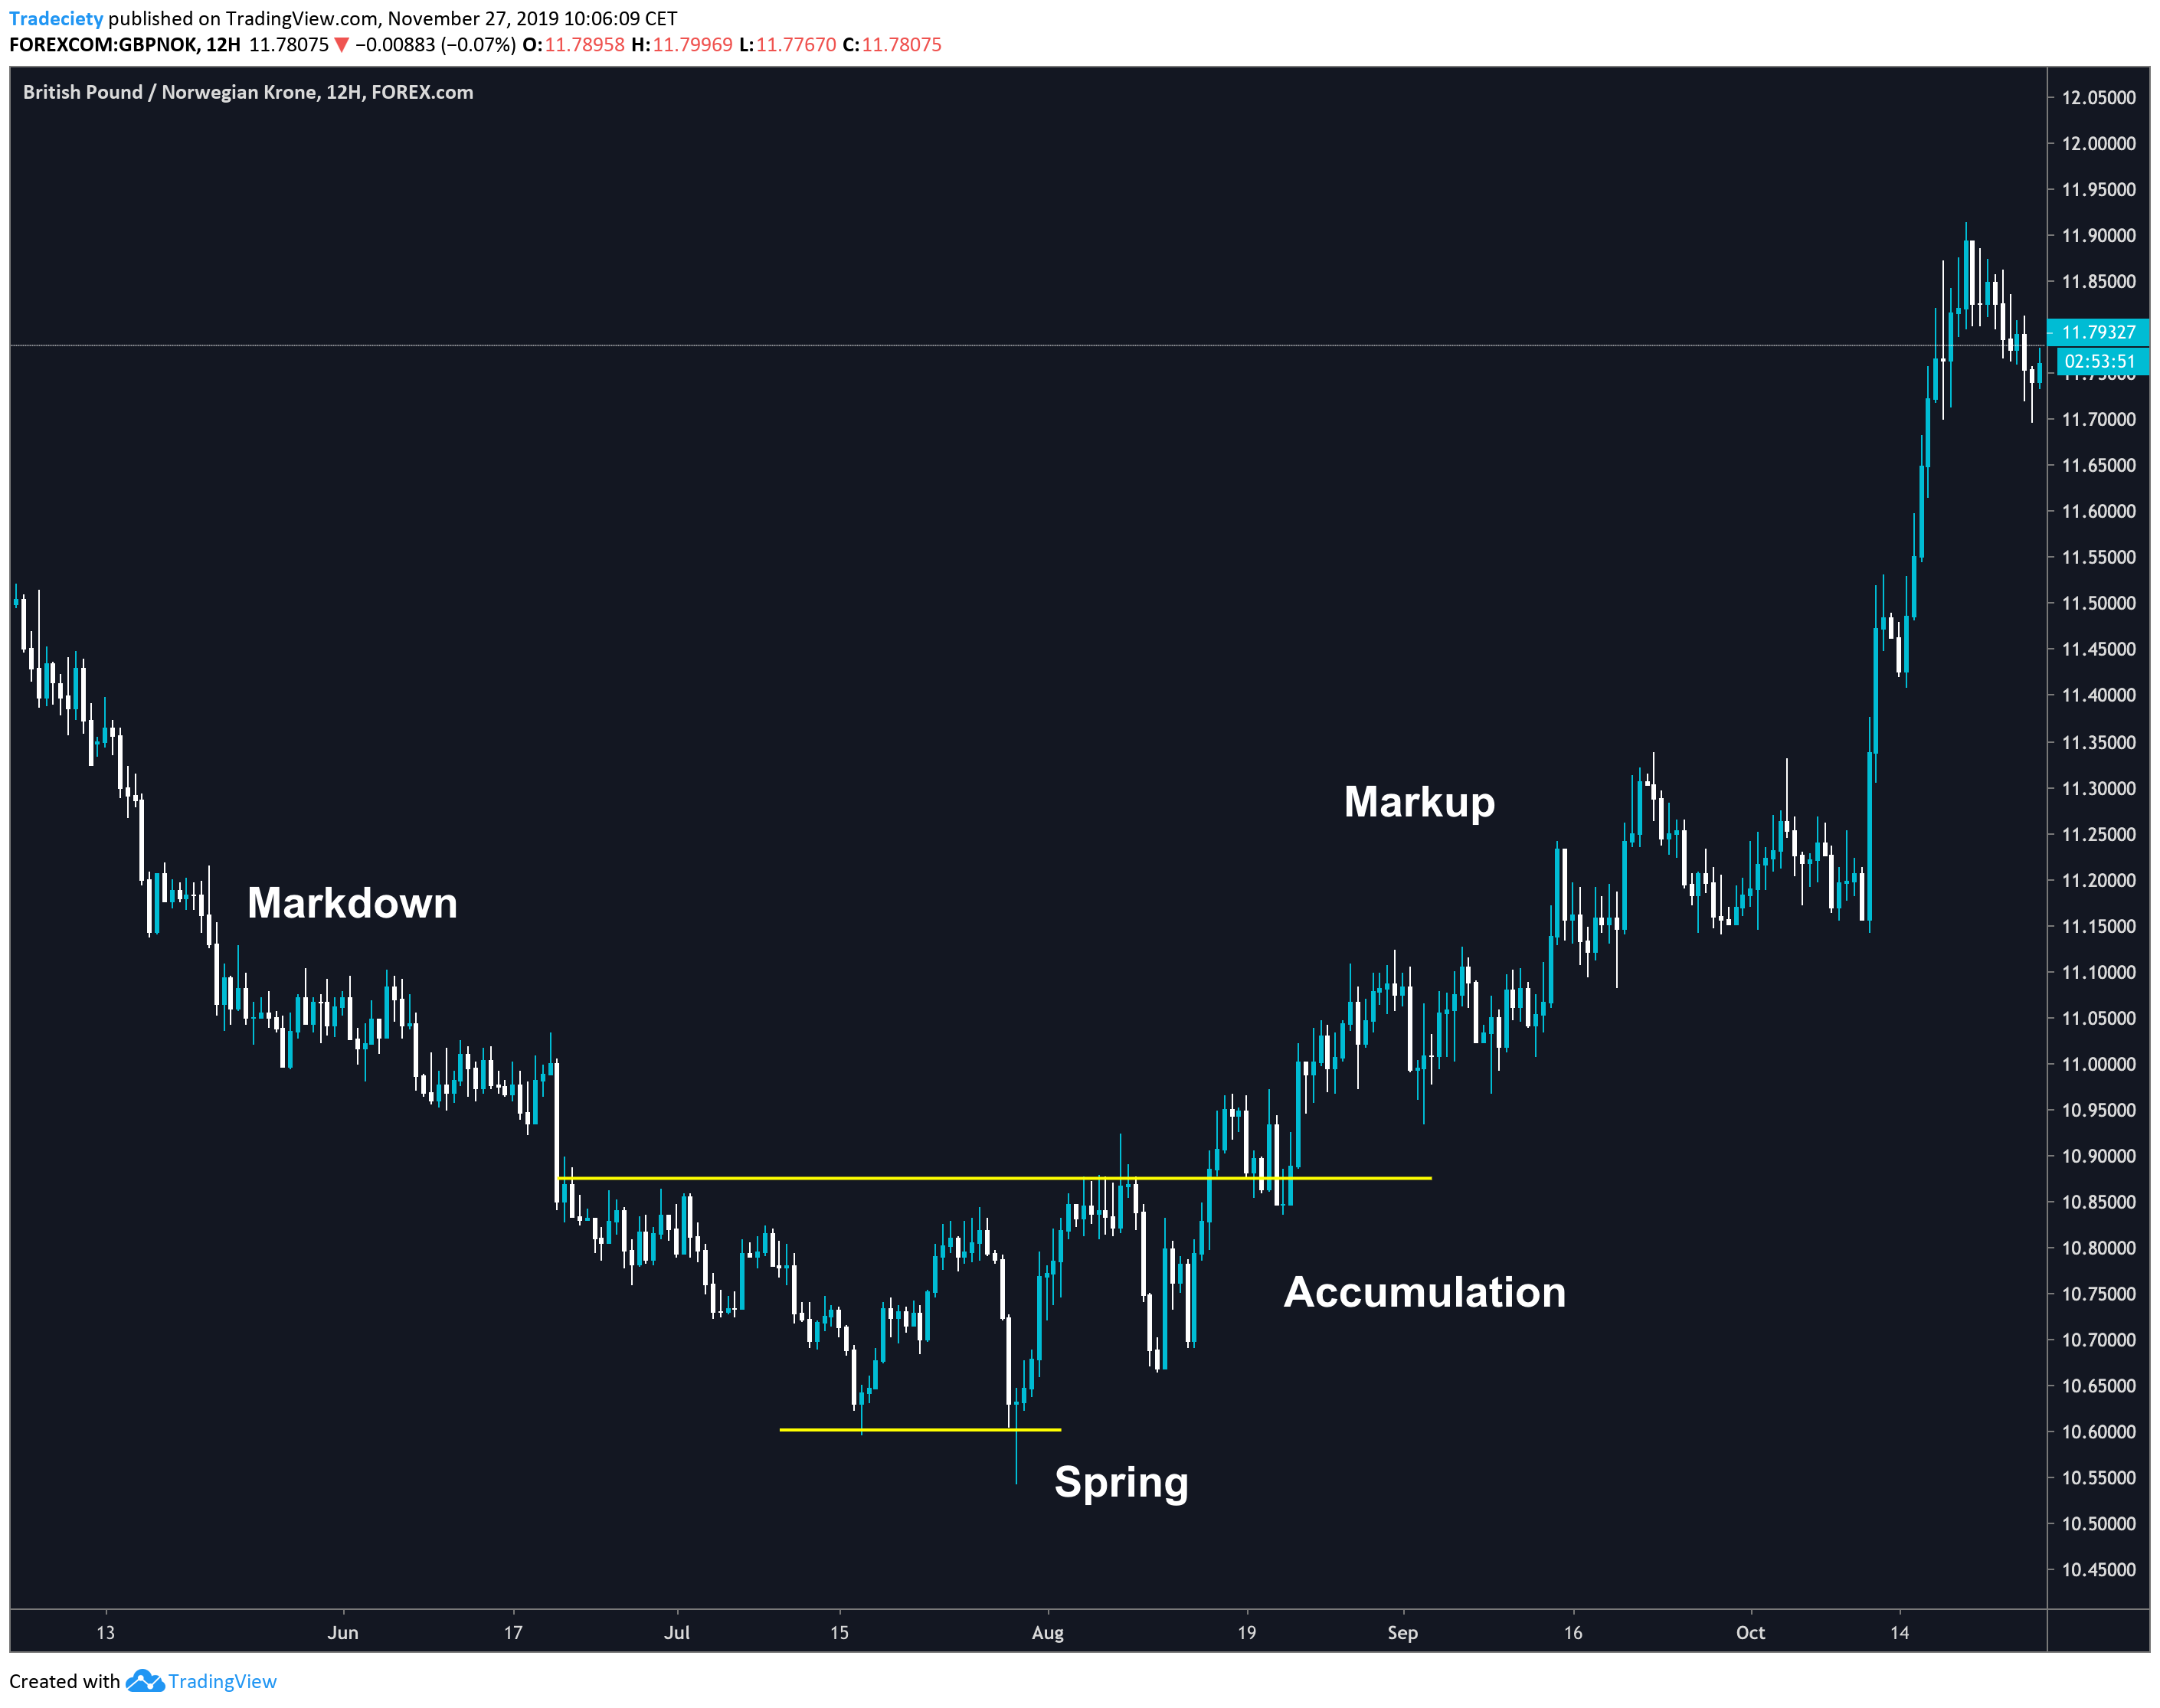
The screenshot below shows a perfect markdown-accumulation-spring pattern.
At the bottom, the price briefly traded below the previous low but failed to continue the downtrend. Also note how the bearish candlesticks that form the potential breakout are very small and not really convincing. The subsequent bullish candles were much stronger and longer. This already indicates that the breakout attempt was very weak.
The breakout then happens and the price trended higher for a while before pulling back. Many traders will trade the breakout and then move their stop loss to break even. This is such a known market behavior that you will see retests all the time. The retest perfectly traded back into the previous breakout level and took all the stops, while providing another buying opportunity at a fairly low price.
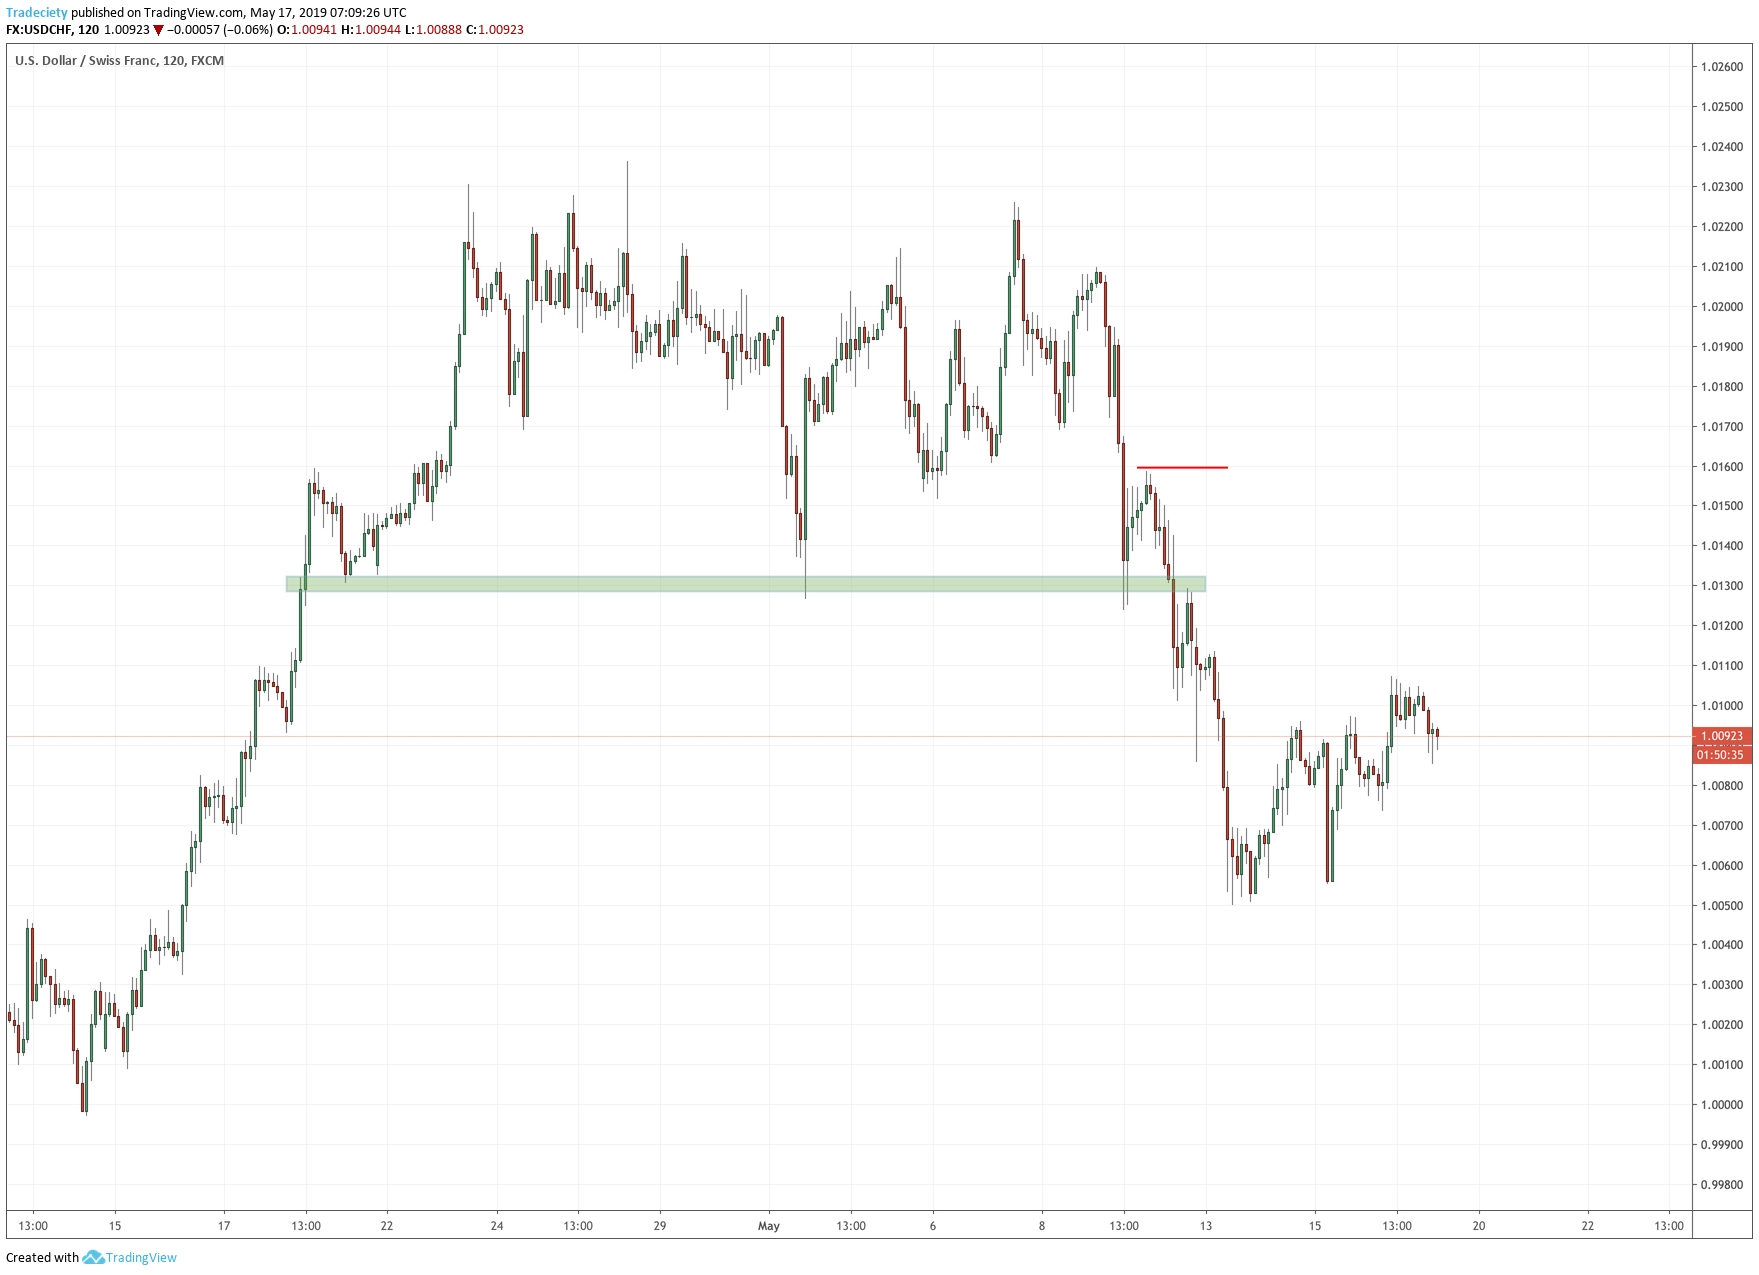
This is a little excursion, but it will be worth your while. Before the actual breakout from the accumulation/distribution pattern, the price often forms a smaller pullback which I call the Lower-Bounce.
Again, ask yourself what this tells you about the buyer-seller ratio:
During the range, the sellers already drove the price down strongly into the support level (big red candles). Then the buyers tried to step in and push the price higher, but they did not succeed and the price didn’t even come close to the previous high. This is a very important finding because it indicates that the sellers are in control. The bearish breakout was the logical consequence.
You will find that this pattern precedes many successful breakouts and you may want to include this Lower-Bounce as a confluence factor.
Sometimes the spring happens in the form of just a single spike-pinbar. It is very important that the spring takes out the previous lows to fully confirm the failed breakout attempt.
In the scenario below, the accumulation phase formed in a well-defined sideways range with a horizontal resistance level. Before the breakout, the price already started making higher lows, which is a good confluence factor – especially if it happens after the spring and, therefore, further indicates the building buying pressure.
The retest in this example happened right away and it, again, highlights why break-even stop-loss orders may not be the best choice. Although traders believe that they can “protect” their position with a break-even stop, most of the time it just makes their traders vulnerable to pullbacks.
The markup started right after the pullback was confirmed.
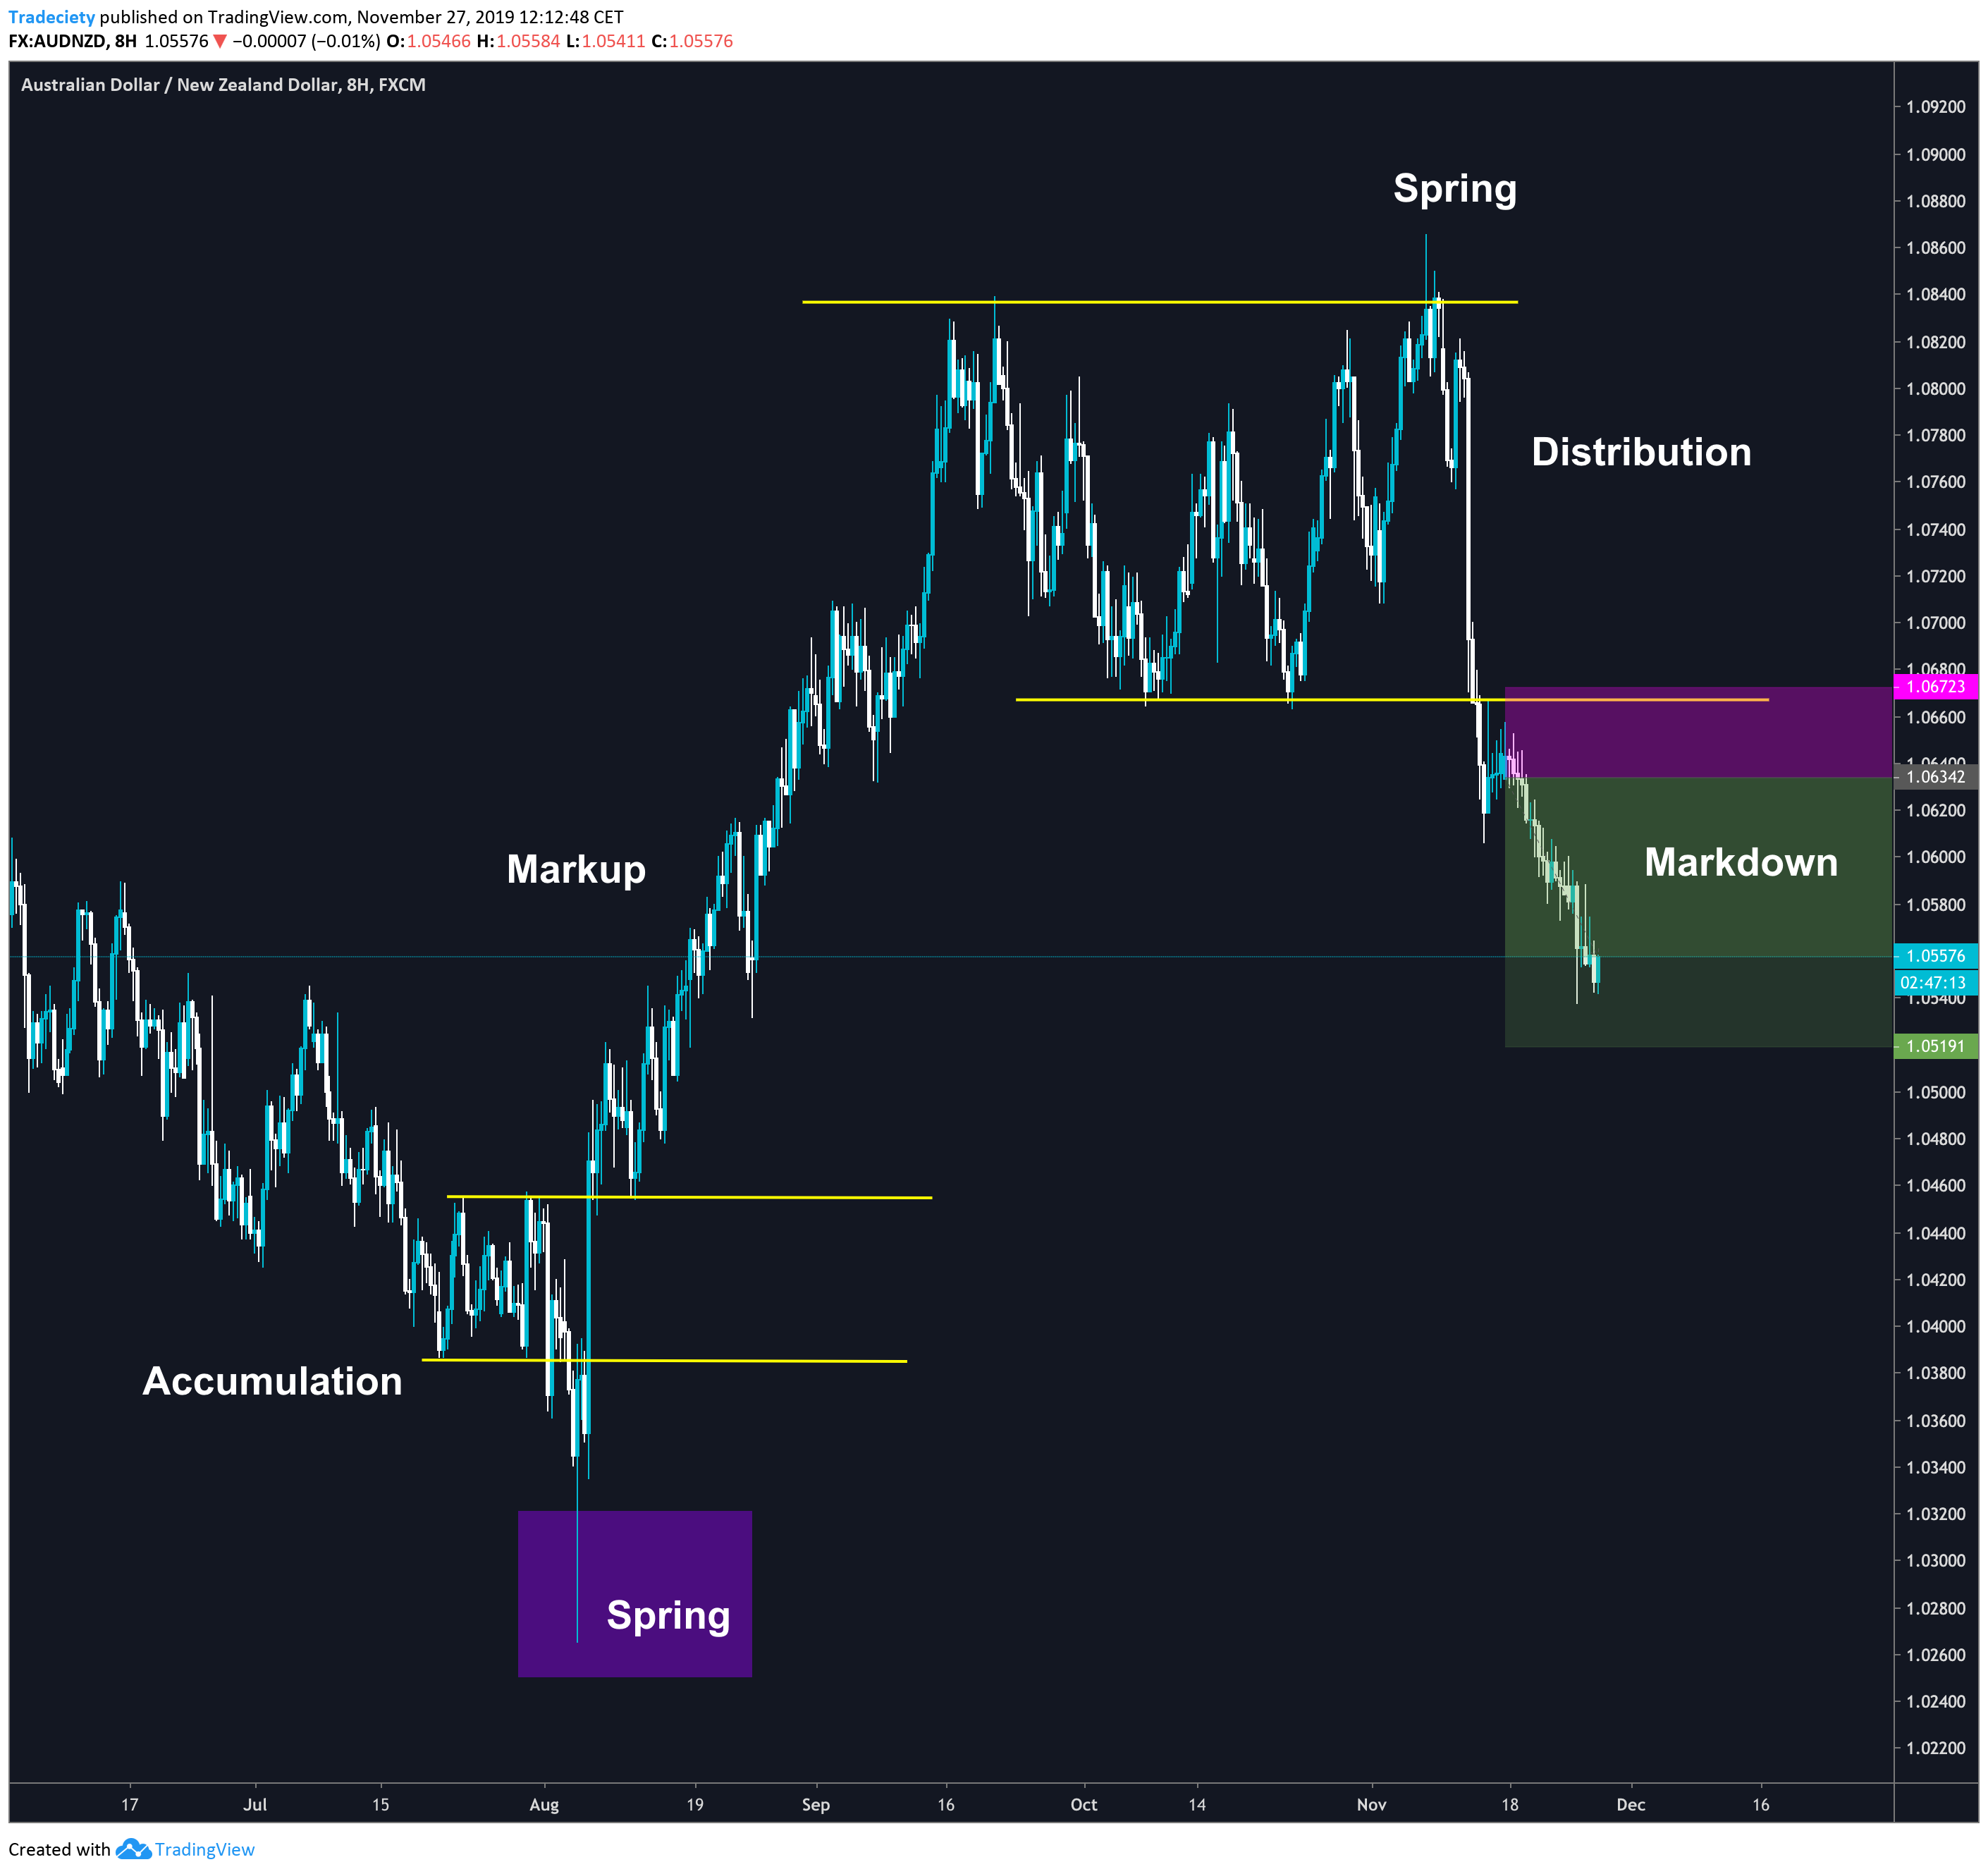
Let’s continue with non-textbook accumulation and distribution phases.
On the left, the price did not form a long sideways accumulation, but we can clearly observe how the price stalled after the downtrend. Furthermore. before prior to the accumulation, the price didn’t trend lower strongly either. The market just slowly ground lower. This is already a heads-up that the downtrend wasn’t very strong. If a reversal happens after a weak downtrend, the new uptrend will often be even stronger.
The spring pattern was also very strong which further indicates that the market powers are about to shift. After the failed breakout to the downside from the spring, the bullish candle was a very strong one.
By now, we have found multiple confluence factors that indicate that the (potentially) coming bullish trend could succeed. To trade such a system with confidence, it can be important to stack those confluence factors. The more hints we can find, the more conviction it provides for your trading.
After the breakout, the market immediately makes a pullback and forms the retest pattern. This is such an important market pattern and it’s worth studying it.
On the right, you can see a trade that I am still in (by the time of publishing this article, the trade has reached the take profit target). I traded the breakout out for the distribution zone. The spring was a single pinbar candlestick that took out all previous highs. The distribution was defined by a great horizontal support level. Horizontal levels make trade-timing easier, compared to trendlines because they are less subjective.
This breakout also happened with a retest.
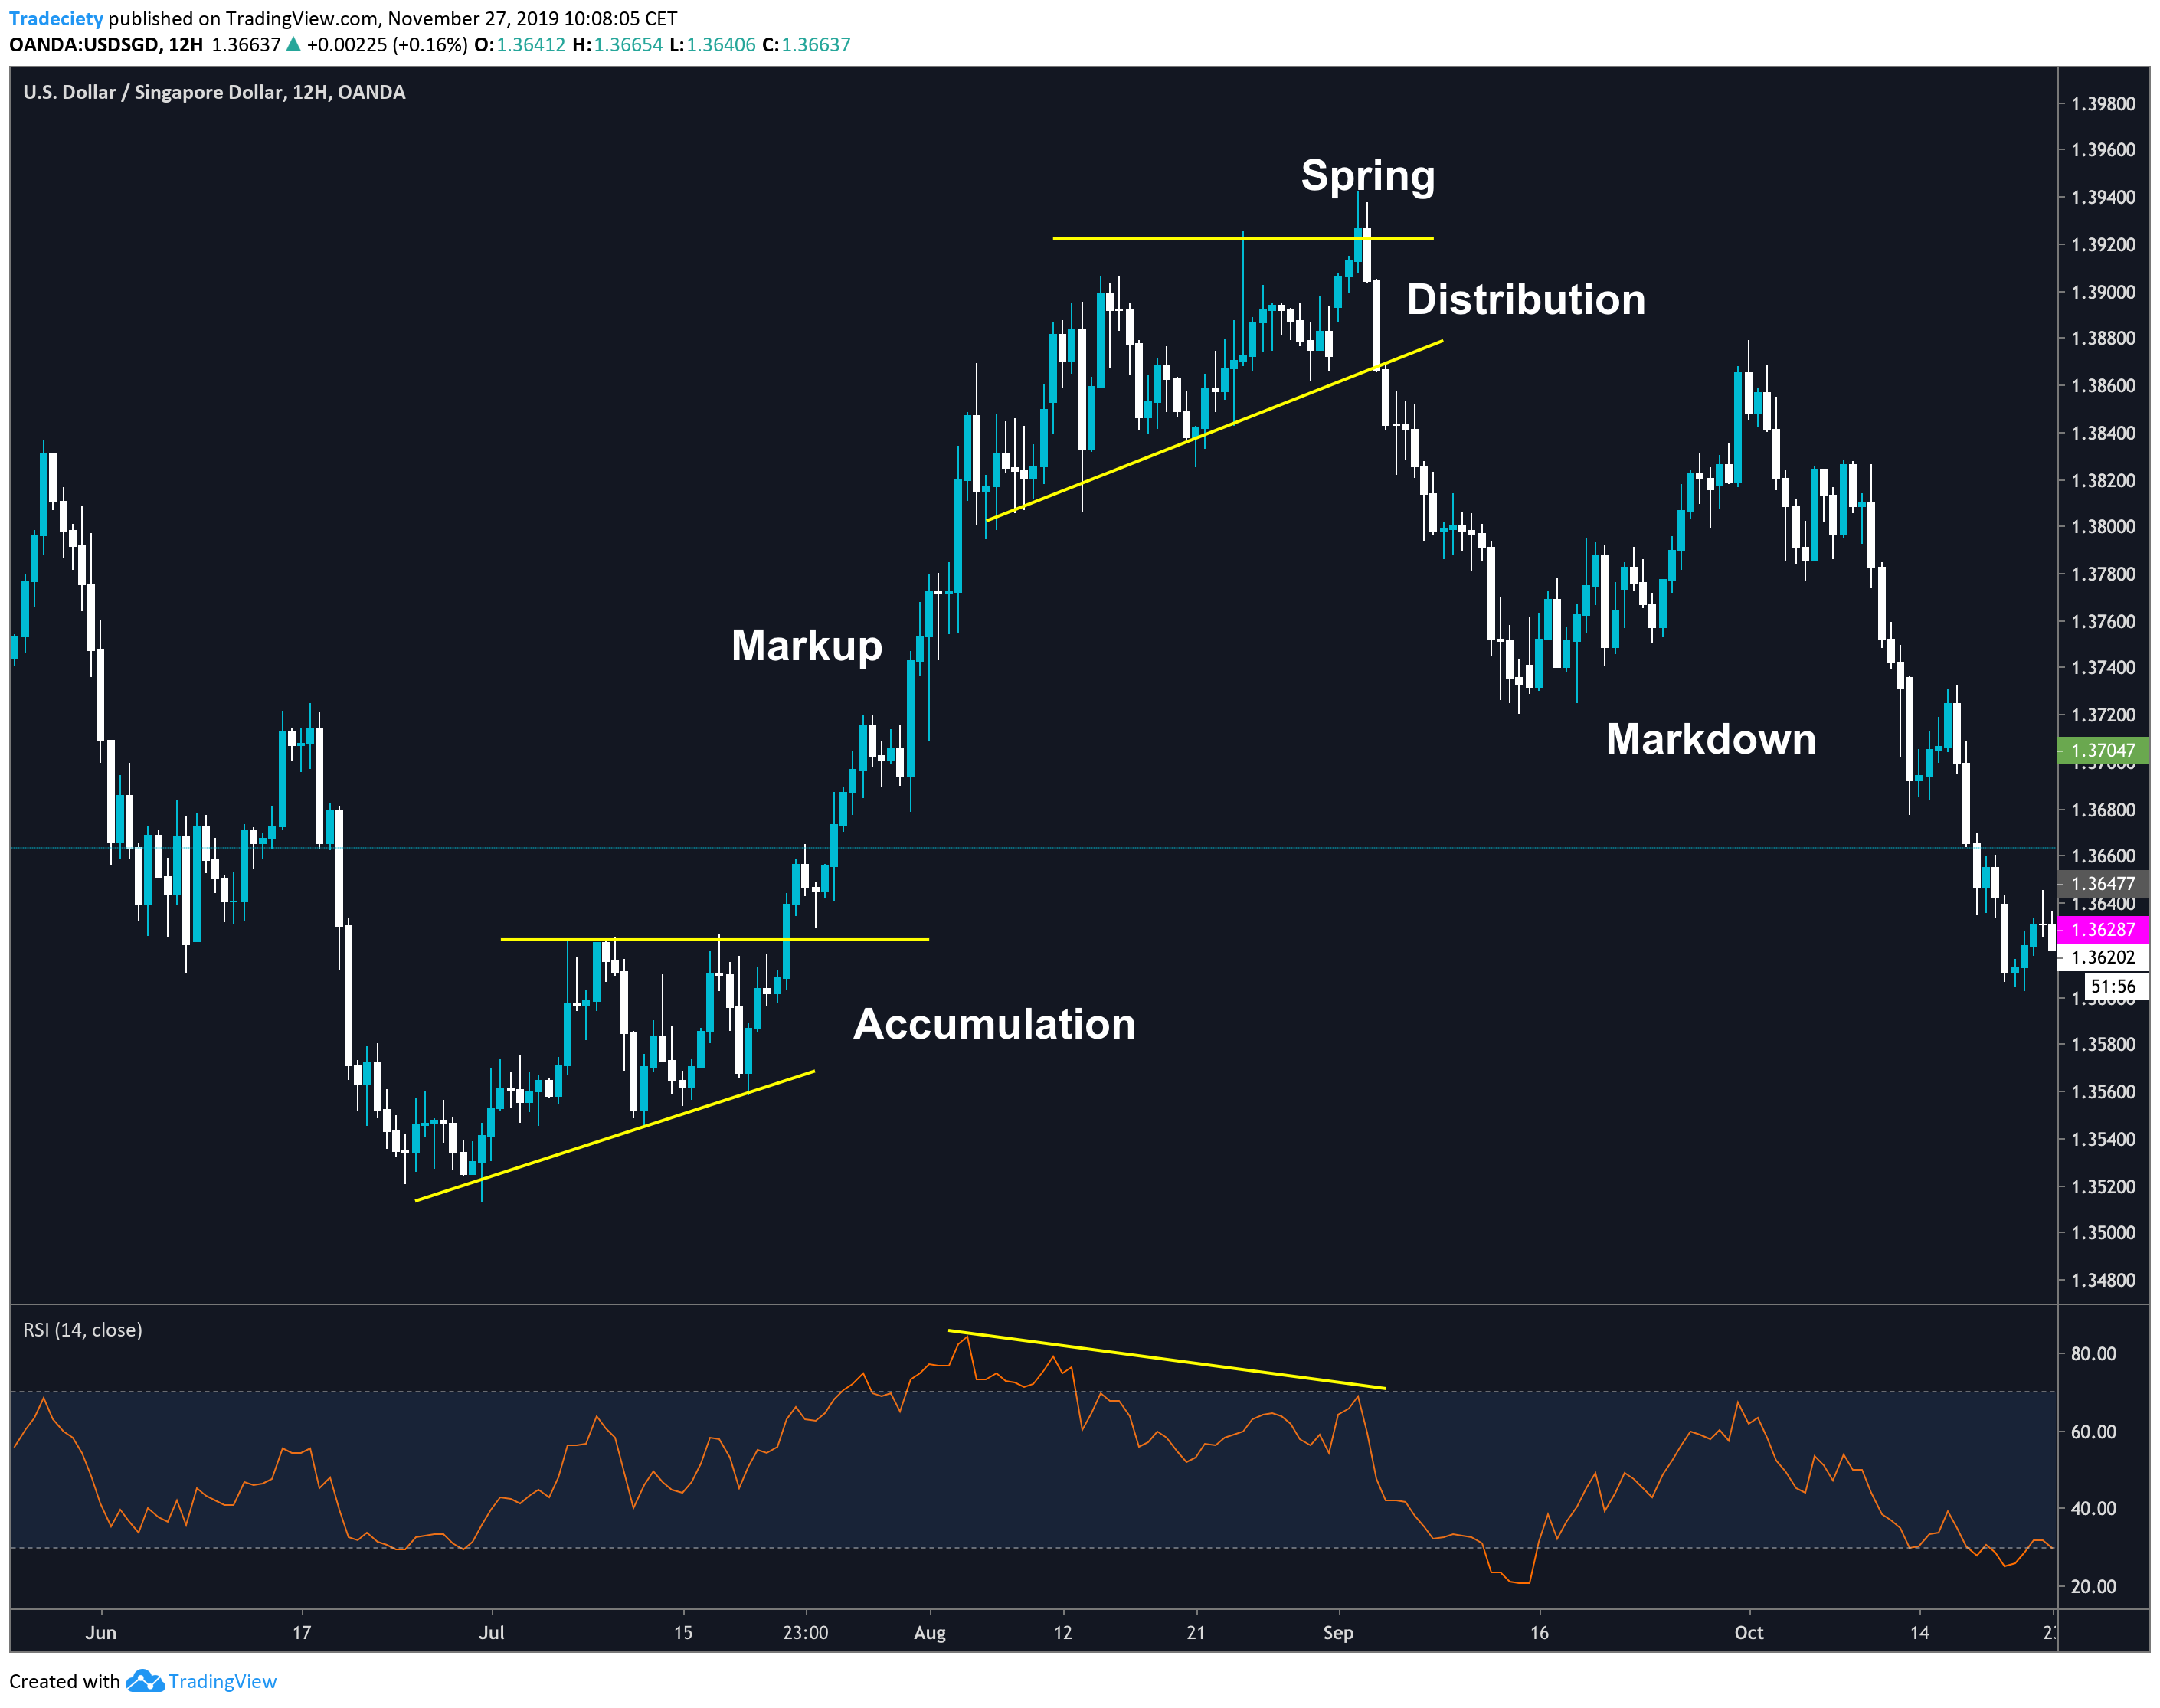
Divergences are a great trading concept and it integrates perfectly with the Wyckoff and trend analysis. I wrote about divergences multiple times but, in a nutshell, a divergence indicates that the current trend is losing momentum.
And as we have seen in the previous chart studies, the Wyckoff trend analysis is all about understanding trend structure and trend strength.
In the scenario below, the distribution phase happened while the RSI indicator was showing a divergence. Although this distribution is not a perfect sideways consolidation, one can clearly see how the uptrend was losing strength. The trend waves became shorter and the price had a hard time making higher highs. At the top, the spring showed a failed breakout that immediately reversed lower.
After the spring, the bearish candles suddenly became strong and much longer, further confirming the shifting bull-bear ratio. The sellers were clearly ready to take over.
The markdown (downtrend) didn’t succeed immediately, but the price pulled back into the breakout area once again.
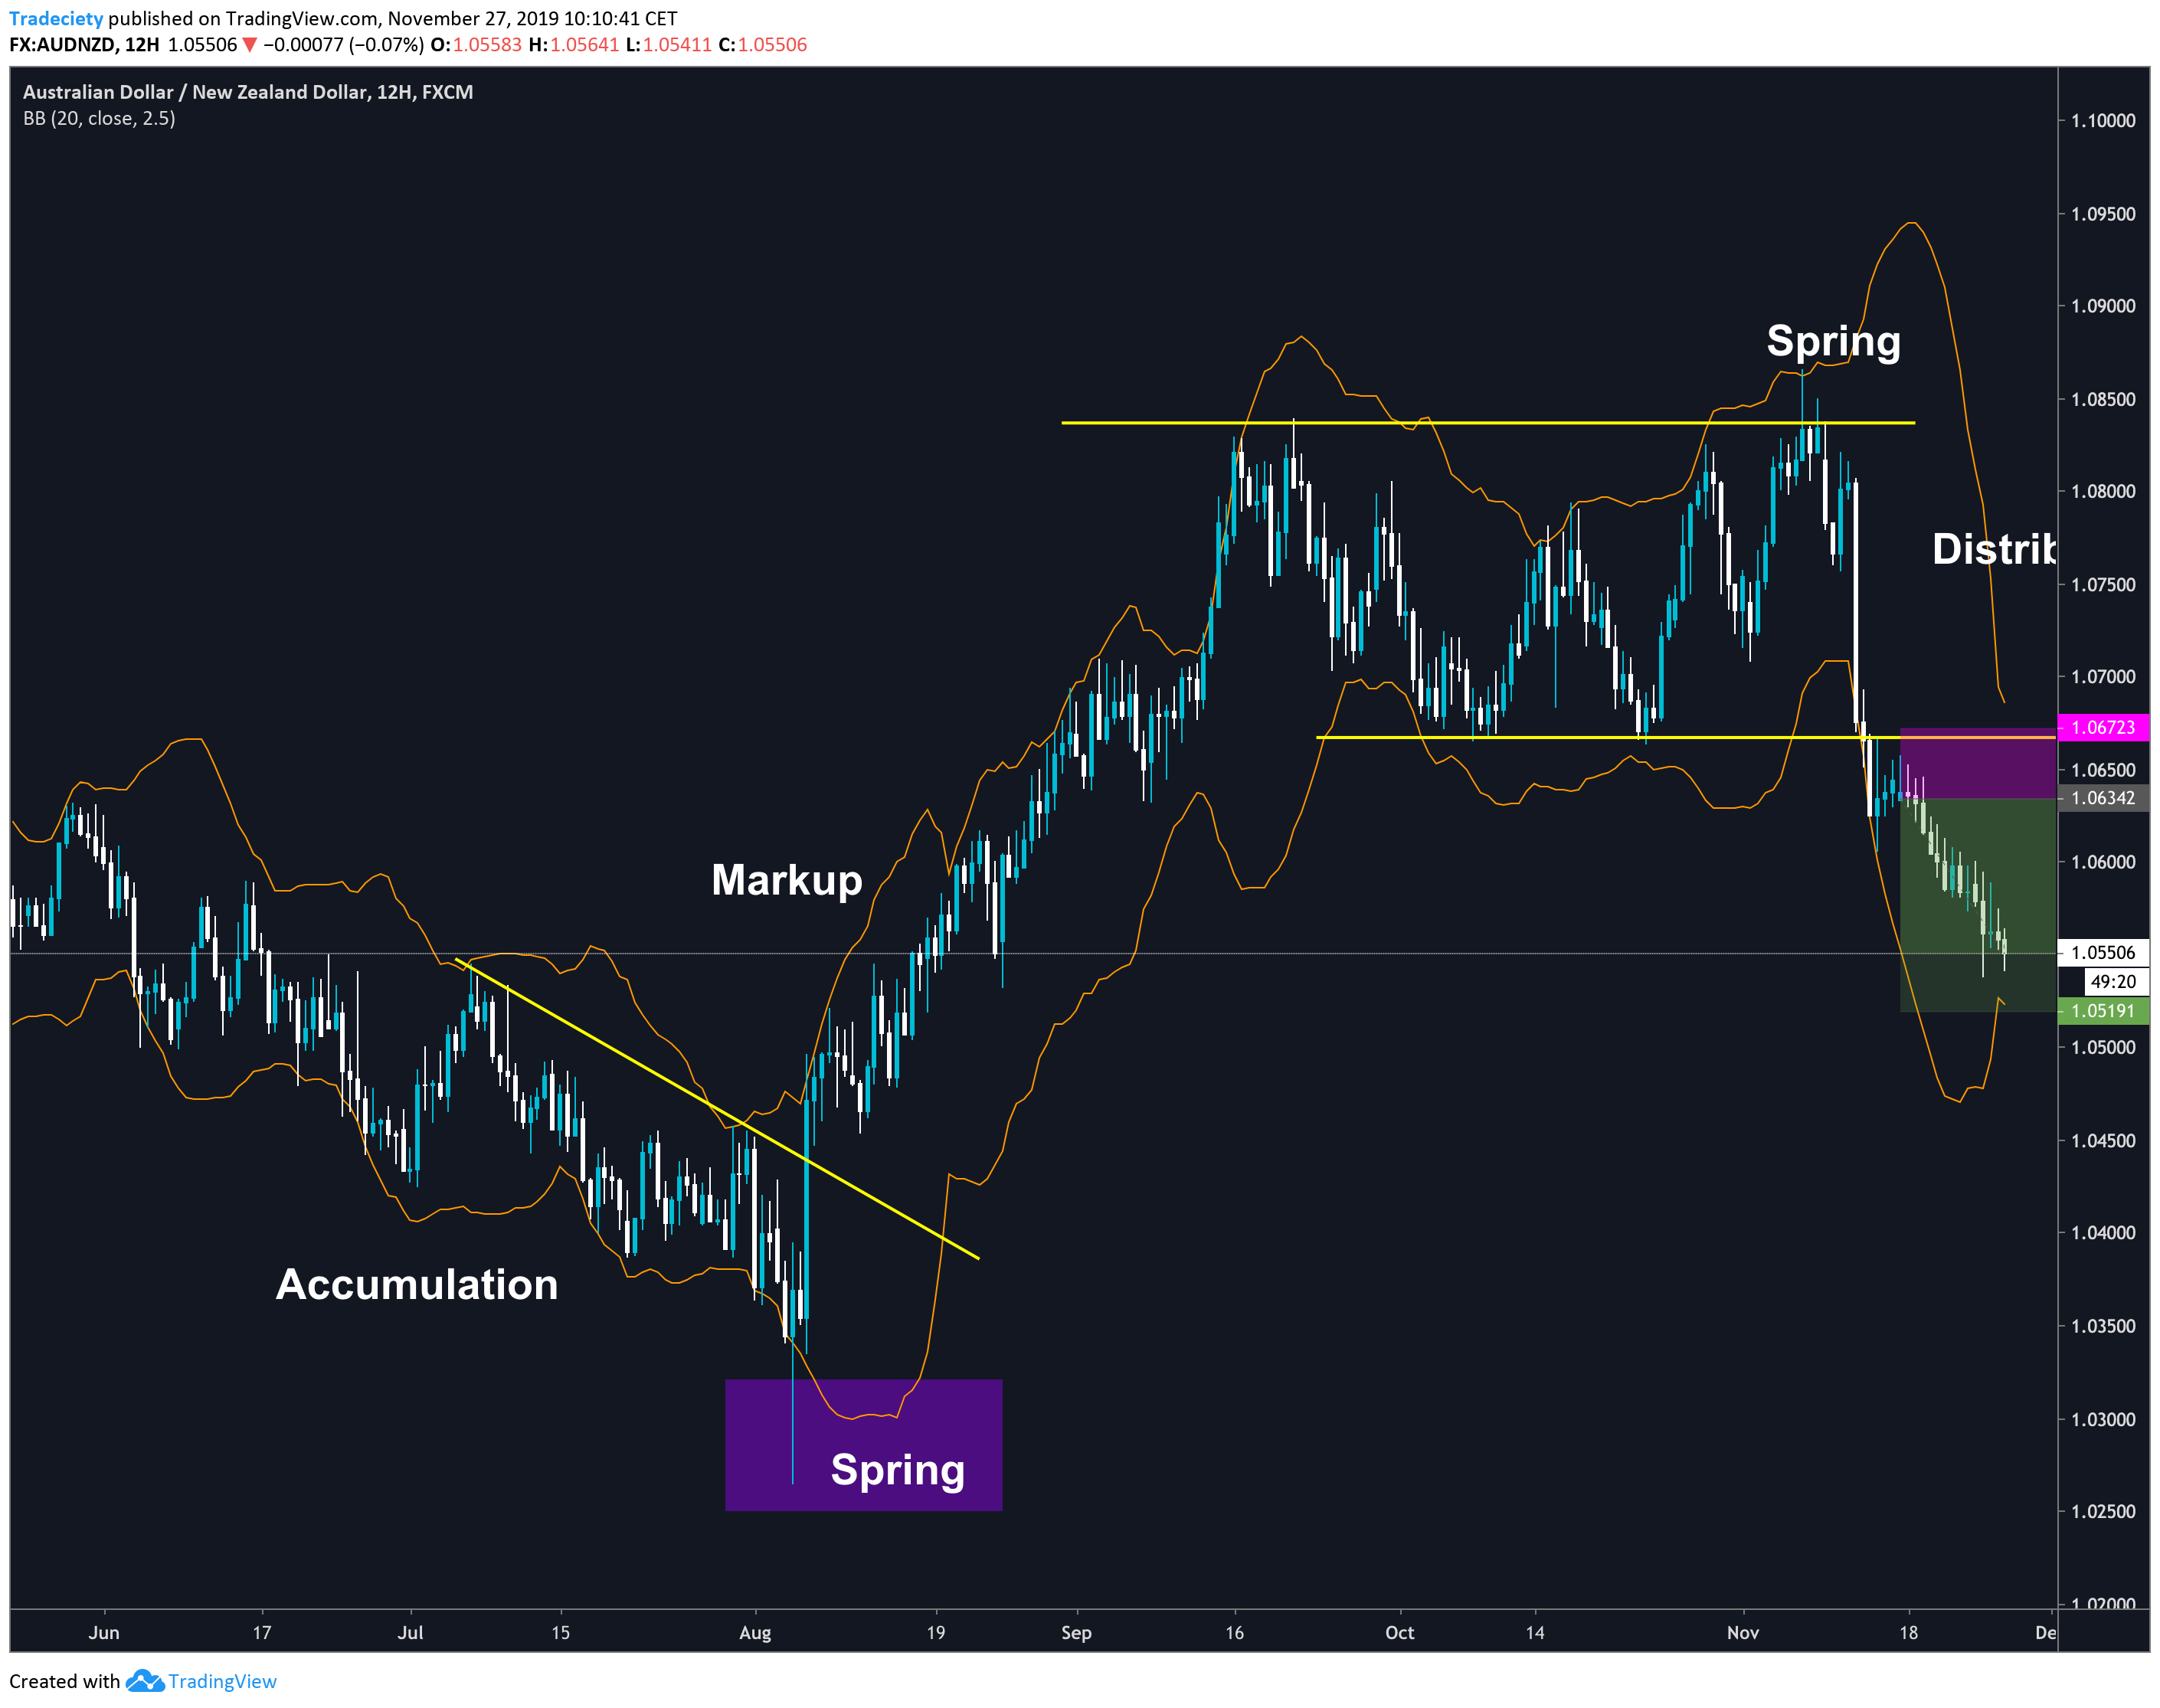
When it comes to identifying significant spring patterns, the Bollinger Bands are the perfect tool for the job. The Bollinger Bands are essentially just measuring the standard deviation of the price moves which means that if the price is moving outside of the Bollinger Bands, it highlights a significant event. 95% – 99% of all price action happens within the Bollinger Bands.
Now, if the price is able to spike outside of the Bands by a lot, this is even more meaningful. A large spike through the outer Bands should always catch your attention. In the example below, the left spring shows a very strong spike through the outer Band. We talked about this chart scenario above, but with the Bollinger Bands, we can add another confluence factor to our toolbox.
The stronger the spike, the higher the likelihood, that the trend will actually reverse if all other confluence factors confirm the trend analysis.
Although trading just based on Wyckoff analysis might not be the most accurate way, it provides a solid foundation for any chart analysis.


external link:


3 min read
“95% of all traders fail” is the most commonly used trading related statistic around the internet. But no research paper exists that proves this...

3 min read
Trendlines can be great trading tools if used correctly and in this post, I am going to share three powerful trendline strategies with you.

3 min read
Choosing the right trading journal is essential for traders wanting to analyze performance, refine strategies, and improve consistency. In this...