Supply and Demand Trading in 2026
We have been trading supply and demand strategies for over ten years, and they have stood the test of time remarkably well. Supply and demand is...

One of the most dreaded circumstances for a trader is when markets (often inevitably) enter into notorious sideways consolidation phases.
It can be frustrating trying to gauge market sentiment, as technical indicators that you perhaps loved until very recently for their accurate and timely signals, start going bonkers with conflicting signals and moving averages get entangled with price itself.
As much as you hate it, the truth is that even the smoothest most trending markets will inevitably enter into one of these phases – and often without a warning. And while it is great to be mostly feeding off smooth trending markets, and occasionally snapping up a consolidation breakout pattern, the most successful of traders know how to adapt to given market conditions and are skillful enough to successfully trade within elongated consolidation periods using the same old bag of tricks – just with a different mindset.
Let’s discuss the mindset considerations for a range-bound market, and a few approaches that can help you conquer those whippy movements.
This is an important aspect to address first up. Let’s be real: We would all love to be able to milk our pips away in any market situation that pops up, but not all of us are ready yet to be that guru.
Here’s a quick quiz:
If your answer was a NO to even one of the questions above, you might as well close this browser tab right away. If you answered YES to all of the above questions, you may progress with the article.
You might be trading using a system that relies on technical indicators that perhaps include the MACD, Bands, or even moving averages. As mentioned earlier, sideways markets tend to kill the impact of these lagging indicators. With price moving back and forth rapidly, it can be hard for these indicators to catch up. The result is often conflicting and inaccurate signals.
With price whipsawing up and down, you are better off doing yourself a favor with cleaner charts. If indicators form an integral part of your trading methodology (perhaps the trigger), at least exercise major caution in interpreting the signals. Either ways, watching raw price action as a priority will not hurt.
This action might sound a bit contradictory. After all, price action is already choppy as you see it. Why confuse yourself further by switching time frames? Well moving a time frame up will help you see the bigger picture if it isn’t already visible on the time frame you are on.
By the bigger picture I mean scanning the broader context in terms of longer term support and resistance levels, major swing points in the distant past, or simply a longer-term technical pattern that could be developing.
A higher time frame will often give meaning and relevance to the current sideways-running price action. Maybe price is just holding up under a major resistance level, consolidating for a breakout (or who knows…maybe a fake out)? Maybe price is tightening inside a wedge pattern, or maybe it’s just caught between two major support and resistance levels creating the upper and the lower bound of the consolidation zone. These perspectives can be crucial to helping you take the right side on your trades.
Let’s look at a few examples:
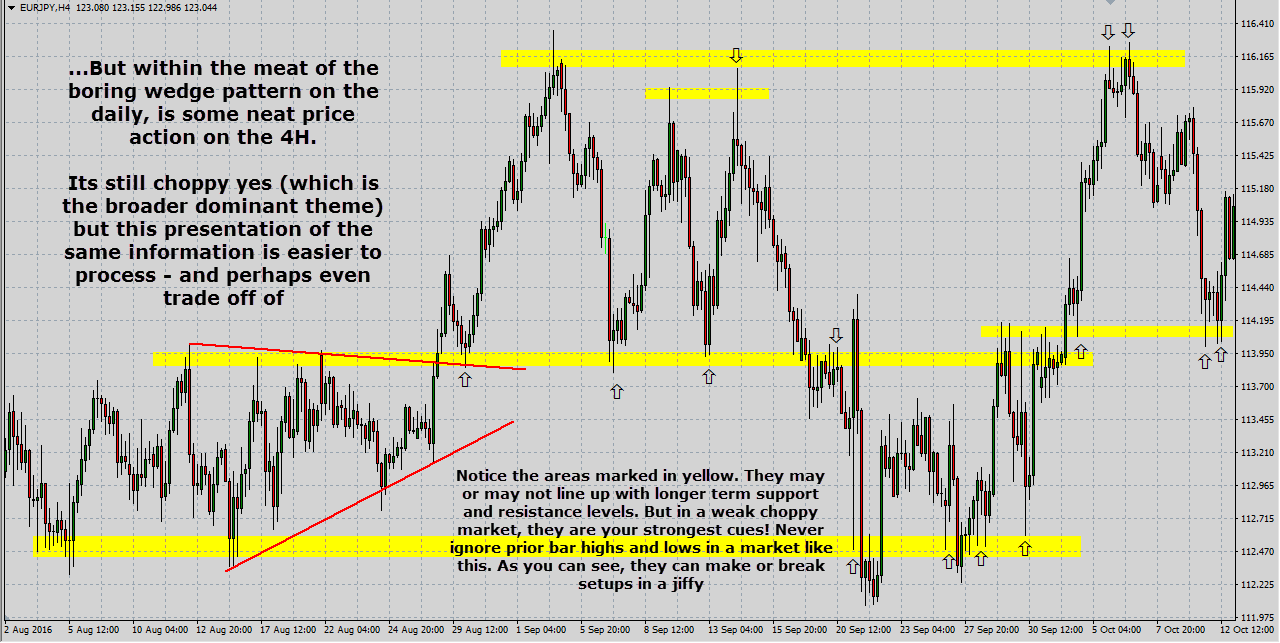
But that said you might also need to jump down a time frame or two. These are situations where you’re looking at a really tight consolidation zone which is best viewed as spread out on shorter time frames. Here you have more information to process in terms of mini trends and swing points that can help provide logical context to the seemingly bizarre whippy price action.
A move like this can be extremely crucial in helping you spot those notorious short-term support and resistance levels – often just prior bar highs and lows – found within the range that price is caught in. It’s the negligence of these levels usually that kill traders in sideways markets.
If there is one thing you need to take away from this article, it has to be the emphasis on short-term support and resistance levels in a sideways market. Very often we are so glued on the larger more obvious levels in the market that the smaller ones are ignored. In a choppy sideways market, that can be a grave mistake to make.
In the end, price action is really just what it is: price interacting at historical levels whilst creating some new ones along the way. As traders we are naturally looking to gather enough information to allow us to make informed trading decisions.
The purpose of this article is not to provide food for thought for impatient binge-traders but to simply provide an alternative perspective into a market condition normally brushed aside as a diabolical account drainer.
As it might have been clear now, if you know price action and its dynamics well enough – especially in different market conditions – it does not take a genius to figure out a way around elongated consolidation periods for quick but high probability setups.
Sure they will never beat the stand out setups in a smoothly swinging market that stick out like a sore thumb, but we are really just talking about maximum processing of available information for the highest probability trades “in a given market condition!”

We have been trading supply and demand strategies for over ten years, and they have stood the test of time remarkably well. Supply and demand is...

3 min read
Choosing the right trading journal is essential for traders wanting to analyze performance, refine strategies, and improve consistency. In this...

3 min read
“95% of all traders fail” is the most commonly used trading related statistic around the internet. But no research paper exists that proves this...