3 min read
Scientist Discovered Why Most Traders Lose Money – 24 Surprising Statistics
“95% of all traders fail” is the most commonly used trading related statistic around the internet. But no research paper exists that proves this...

When we start out as a Forex trader, we usually dive into the world of trading with three or four technical indicators. We end up drawing enough trend lines, support, and resistance levels on a chart and clutter it enough to build a brand-new board game from scratch. However, as we invest more time to understand the market structure and learn why prices actually move in the market, we start to realize that even the most advanced technical indicators are just representing all the price action information we can already see on a naked chart. With experience, we realize that when it comes to Forex trading, less is more.
As we start to toy with pure price action trading, be it various candlestick patterns or single bar reversal patterns like a pin or bullish or bearish engulfing bars, we start to comprehend that trading price action can be more profitable than using a combination of lagging indicators.
With this knowledge, our overall trading performance reaches a new height. But we always wonder why trading with price action works when almost every other superficial and hyped trading systems fail to deliver the results they promise.
Before we discuss why price action works in trading Forex or any other market, let’s take a look at what we actually mean by price action.
Anytime you see a two-dimensional chart that plots price data going up and down on the X-axis and time running from left to the right, on the Y-axis, it is indeed showing price action. The definition of price action is simple enough that even a five-year-old can easily describe it. So, all price charts, be in the Western-style Bar chart, Japanese Candlestick chart, or the age-old line chart, all are showing price action.
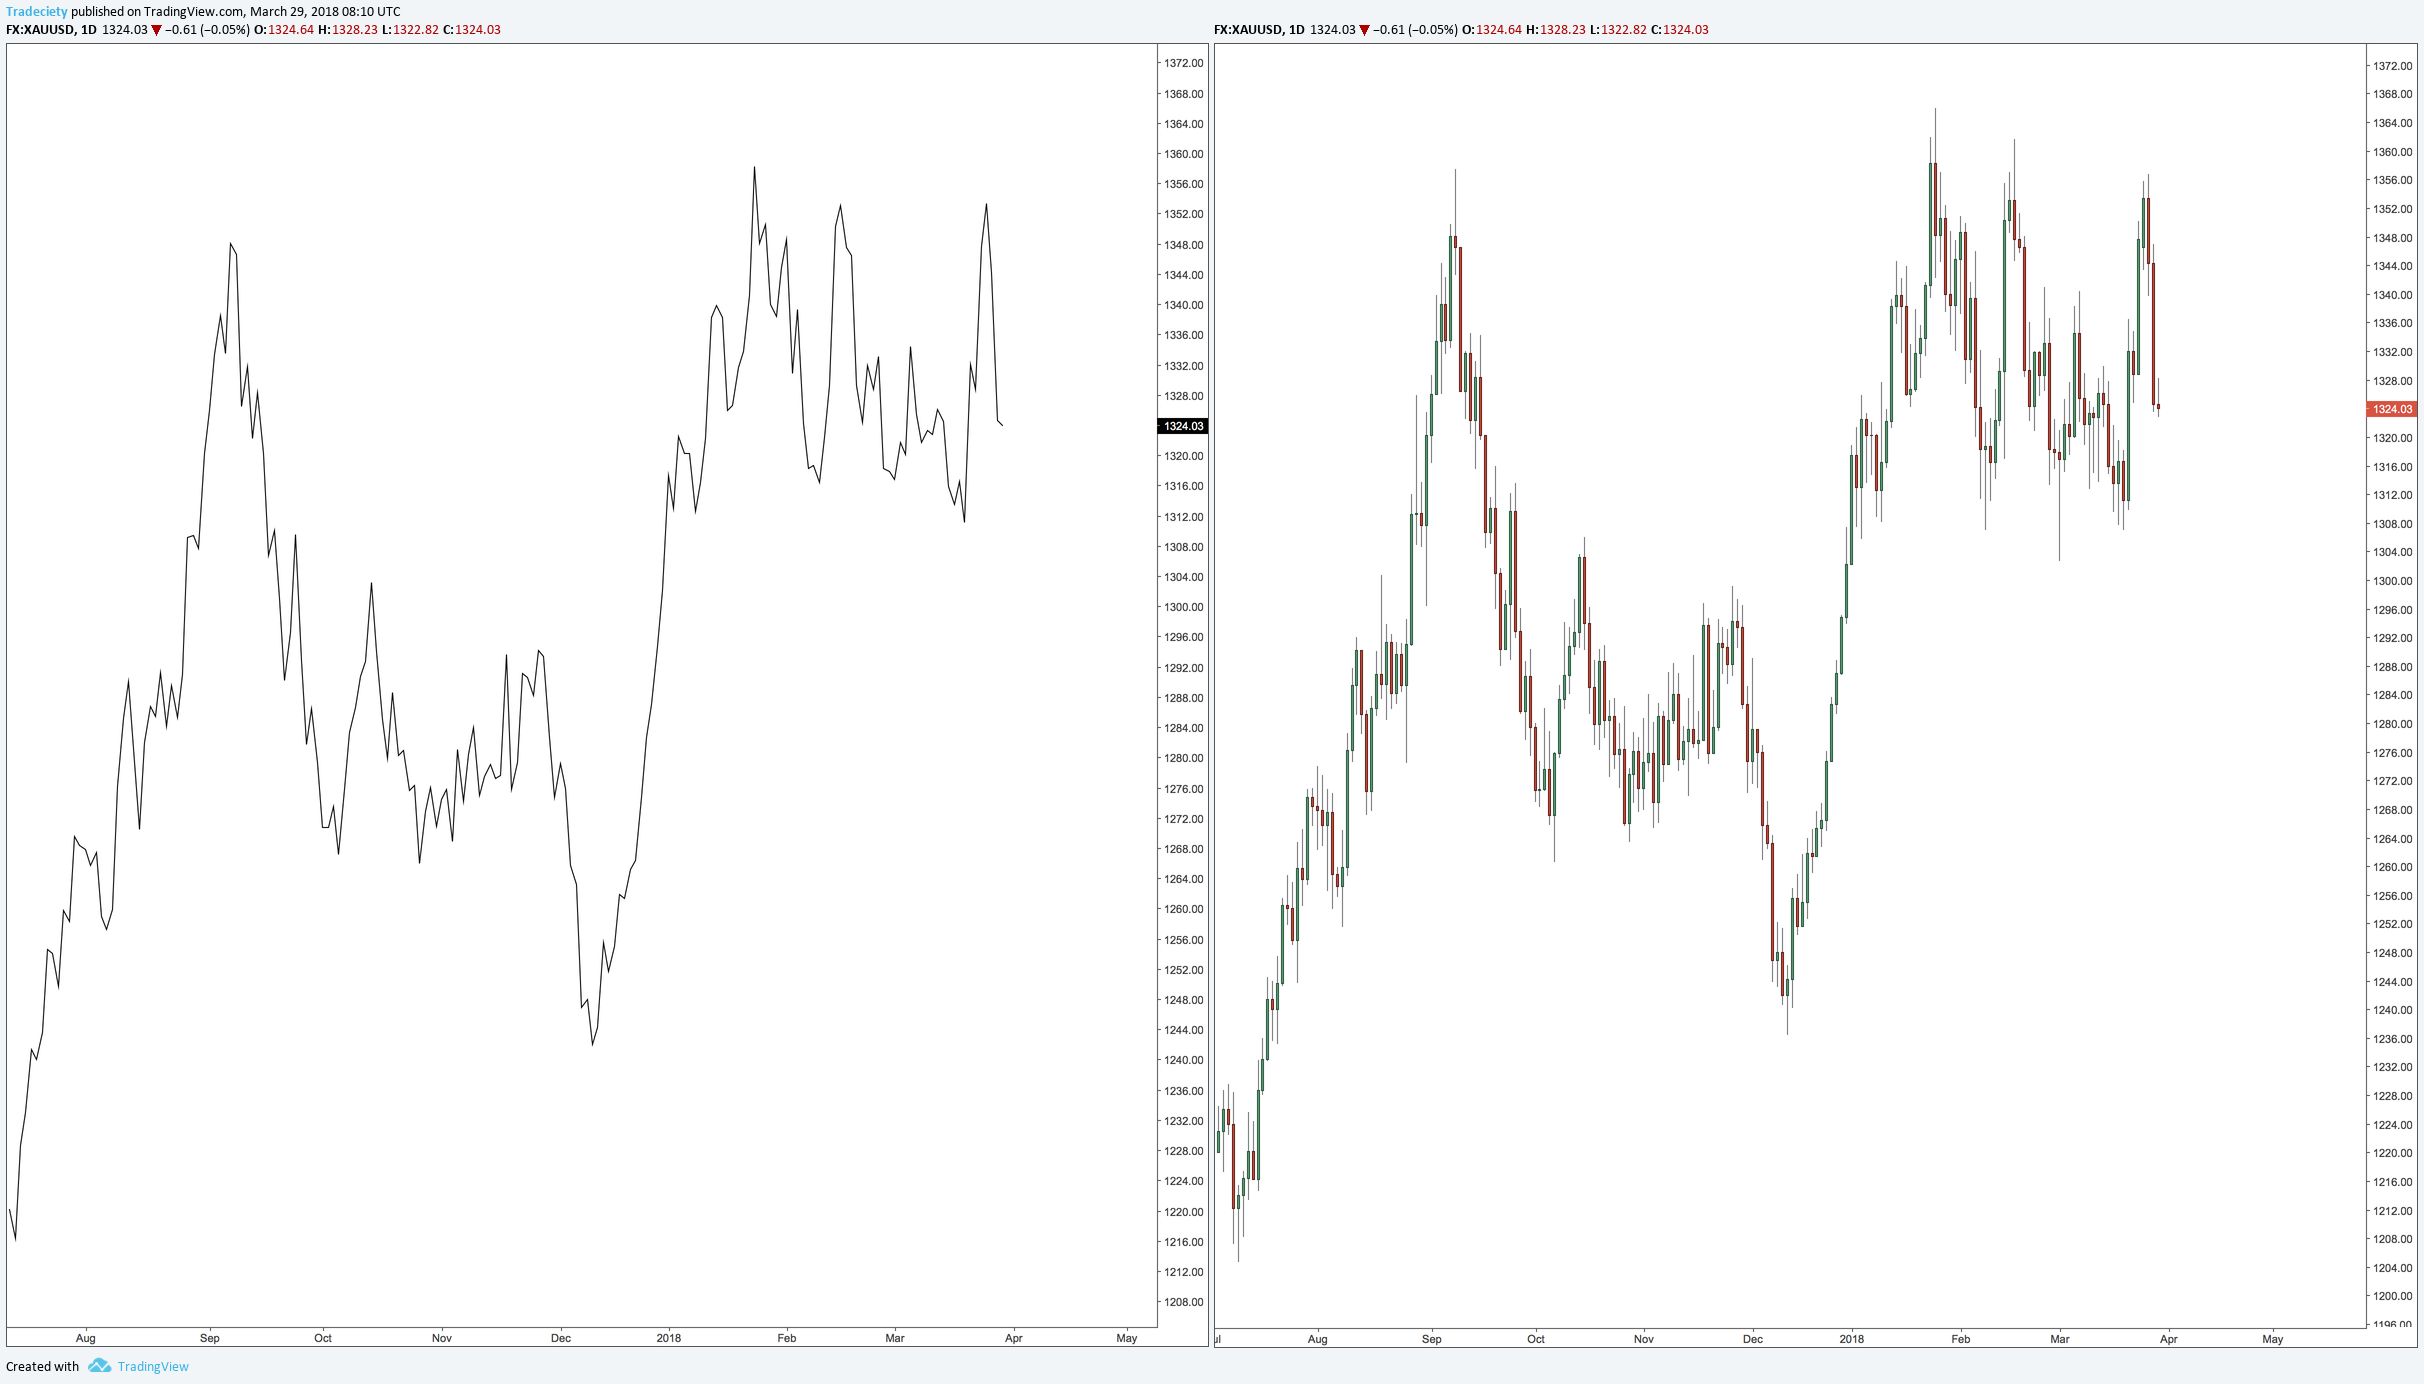
Figure 1: Different Styles of Price Action Charts Shows Price and Time
All price action charts show historical price data plotted on a time frame, where each unit – may it be a bar or a pivot point on a chart – represents the chart’s time frame. So, the price action on a one-minute chart will show how the price moved during a minute of time. Similarly, a monthly price action chart will show how price behaved over the course of a month.
Many veteran traders argue bar and candlestick charts are better suited for price action trading. They advocate that these two types of graphical representation of the price data incorporate the opening price, high and low of the time frame and the closing price all within a single point of reference. For the sake of simplicity, we will stick to Candlestick charts to provide examples.
Nonetheless, if you are using a line chart of closing prices, you can also enter the market of a breakout trade when the line closes above certain support and resistance. Always keep in mind that there is more than one way to skin a cat.
At the end of the day, if you are comfortable using a particular style of chart, it will be as good as any other chart you use. Stick to what helps you make better trading decisions instead of worrying about what is the best type of price action. There is no best or worst, use the one that you feel comfortable using.

As price action is simply the visual representation of historical price data, you might be wondering why then we end up using past data to predict future price movements. After all, there is no scientific research ever proved that past price movement can predict future price movement, right?
In fact, this question was one of the key points that two famous Nobel laureates, Robert Shiller and Eugene Fama, debated about and still could not reach a conclusion.
The hypothesis behind why price action works fall into the realm of behavioral finance and prompted Robert Shiller to win the “The Sveriges Riksbank Prize in Economic Sciences in Memory of Alfred Nobel” in 2013.
According to behavioral finance theories, markets and prices are driven by human emotions. Every bit of new information is interpreted by individual traders and they assign a subjective value of the new information that affects the price. That’s why both buyers and sellers agree to buy and sell at the same price, yet both groups end up thinking that they are not getting the short end of the stick.
Just think for a second, when you are buying a currency pair, you are hoping that the price will go up. At the same time, the person selling the currency pair at the same time to you is thinking the exact opposite – it will go down. The assignment of subjective value and different expectations lead to this disparity. This way, the market creates an apparent win-win situation for both parties.
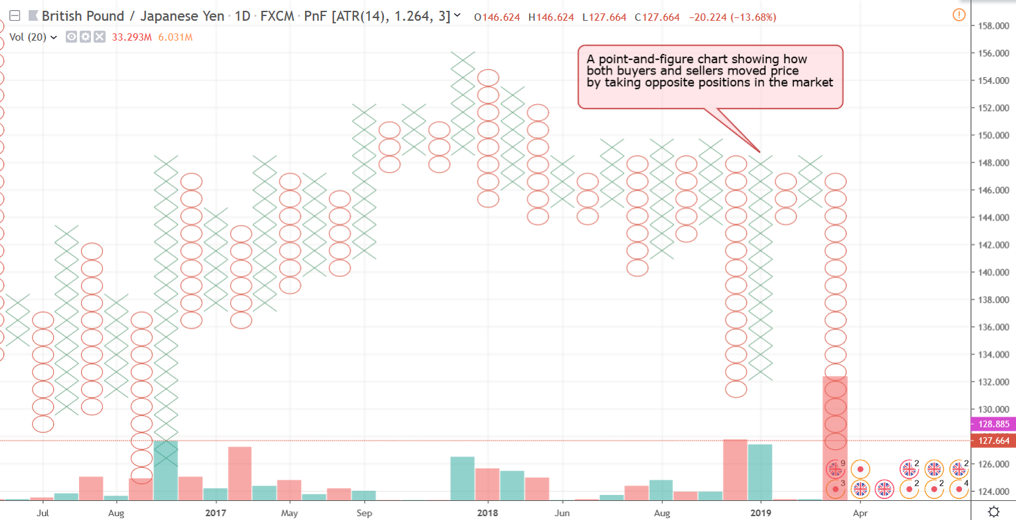
Figure 2: A Point-and-Figure Chart Plots Price Movements Without Considering the Passage of Time
Unlike price action charts that plot price and time in two dimensions, a point-and-figure chart, such as the one in figure 2, does not take time into consideration. So, it is much easier to see in figure 2 that how traders with opposite directional perception conducted transactions that turned into the price.
The reality is that the price of any asset in the market does not reflect fundamental valuation. All it reflects is the collective subjective valuation driven by greed and fear among other human emotions. Therefore, the price of an asset or currency pair is often subjected to extrapolation, herd behavior, and anchoring.
One of the key theories behind why price action works are the concept of extrapolation. In the nutshell, extrapolation suggests that Forex traders estimate the future value of a currency pair based on how it behaved in the past, with much higher weighting in the recent past than the distant past.
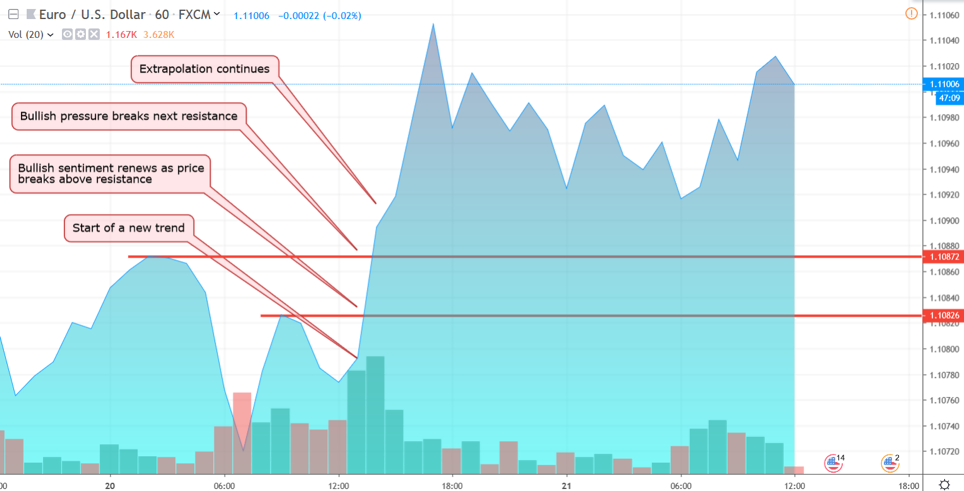
Figure 3: Extrapolation Drives Trends in the Marketplace
Hence, when traders see a bullish price action, it is interpreted as if the bullish trend will continue in the future, while there is absolutely no scientific way of predicting if the price will go up or down during the next minute or next month.
Nonetheless, extrapolation happens all the time in the market because of herd behavior. If the majority of the traders start buying a currency pair based on extrapolation or any other reason, the rest of the market start to follow them and start bidding the price higher than any fundamental valuation would justify.
While extrapolation and herd behavior can explain much of why sustained trends form in the market, the phenomena regarding support and resistance or any other pivot zone are explained by anchoring.
Anchoring refers to putting too much weight on the irrelevant information on the trading decision. Such as irrelevant information could be past transaction price of a currency pair. When a trader or a group of traders enter the market at a certain price point, they tend to estimate the intrinsic value of the currency pair based on their original entry price instead of evaluating the fundamental intrinsic value.

Figure 4: Original Long Entry with EURUSD at 1.1500 Based on Bullish Pin Bar Acts as Anchor
For example, if you have bought the EURUSD at 1.1500, but the price drops to 1.1300, you might hold on to your position, thinking your original valuation is still valid and the market will soon return to your perceived equilibrium. Based on such fallacy, you might double down or increase your exposure to the market when the EURUSD indeed rebounds and comes back up to 1.1500 level.
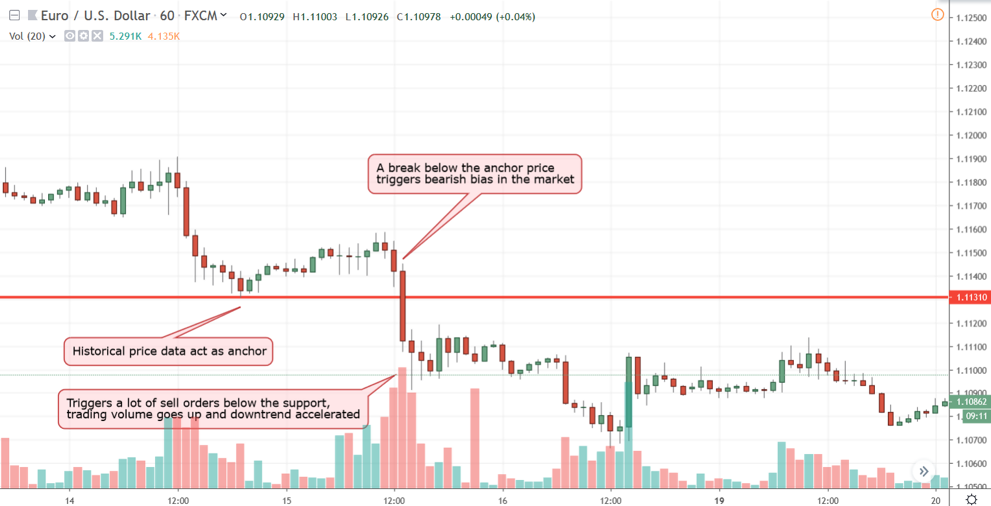
Figure 5: Historical Reversal Point in a Price Chart Caused Anchoring Bias in the Market
Furthermore, anchoring bias in price action can be seen around major historical support and resistance levels. If a currency pair found resistance at a certain price point last month, when it returns to such historical level, a lot of traders start to place pending orders around this point zone in hope that the market might repeat the historical movement. If the majority of the orders are placed in a certain direction, to buy or sell, it triggers those orders and we see a reversal of a trend or acceleration of the prevailing trend.
Forex traders could be categorized into two distinct camps. The first camp of traders tries to find the intrinsic value of a currency pair by analyzing various fundamental aspects like Forex news and geopolitics. Then, if they see a disparity, they trade accordingly. For example, based on your analysis, if you think that the price of USDJPY should be 118.00, but it is trading at 117.50. Then, you would buy the pair with a profit target of 118.00.
However, traders belonging to the price action camp justify their directional bias based on a completely opposite set of logic. The foundation of price action trading is extrapolation. Hence, the only way to interpret price action would be looking for any bullish and bearish bias in the market and projecting where the price might go from here based on historical price data.
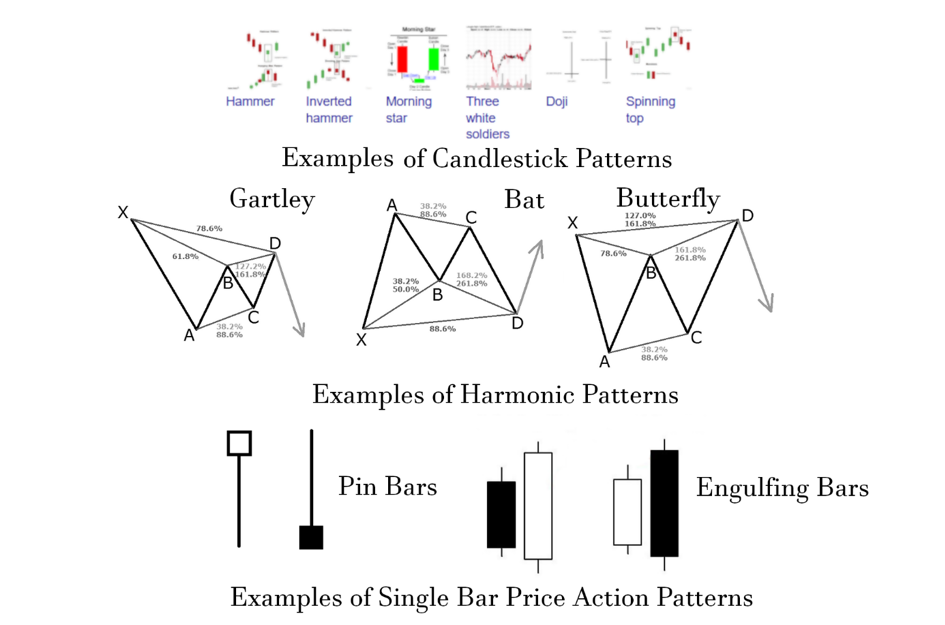
Figure 6: Various Price Action Patterns
Price action traders have come up with a million different ways to interpret the historical data to predict future directional movement. Some of these include Candlestick patterns like the Hammer, Inverted Hammer, Morning star, Three white soldiers, Doji, and Spinning top. Others strictly follow price patterns that take much longer to form. Such price action patterns include various Harmonic patterns like Gartley, Butterfly, Bat, Crab, and Shark patterns. Last but not least, a large number of price action traders believe sticking to pin bars and bullish or bearish engulfing bars are the way to go.
As we mentioned earlier, there are many ways to skin a cat and you can follow any particular way of interpreting price action charts. While the accuracy level and win rate would vary depending on how you interpret price action, the reasoning behind your trades would be always the same – past price data would predict future price movements.
While trading price action could be highly profitable, there are some inherent limitations of using this method in Forex trading. As price action shows price data plotted over time, the interpretation of price action could be different based on which time frame you are trading.
The trend could be bullish on the daily time frame, but when you go down to 15-minute chart to find a day trading opportunity, you could find that price action is indicating a short-term bearish trend. There is no way of knowing if the bearish 15-minute trend will continue for the next few days and turn the bullish trend on the daily time frame into a bearish one or it will rebound after a few hours and resume the long-term bullish trend.
Hence, trading with price action would be always speculative and there will be some inherent risk to trading Forex with it. That’s why experienced traders know that risk management is the key to long-term success in the business of Forex trading. However, if you can find a winning edge by correctly interpreting price action and formulate a suitable money management strategy, trading Forex can yield some above-average return on your investment capital.


external link:


3 min read
“95% of all traders fail” is the most commonly used trading related statistic around the internet. But no research paper exists that proves this...

3 min read
Trendlines can be great trading tools if used correctly and in this post, I am going to share three powerful trendline strategies with you.

3 min read
Choosing the right trading journal is essential for traders wanting to analyze performance, refine strategies, and improve consistency. In this...