Supply and Demand Trading in 2026
We have been trading supply and demand strategies for over ten years, and they have stood the test of time remarkably well. Supply and demand is...
Not all trades are the same. We have talked about this topic many times here on Tradeciety and highlighted the importance of adjusting your trading methodology based on market conditions. A big mistake most traders make is that they have a trading strategy and then apply it across different markets, time-frames and market types. Needless to say that the results of these traders are very mixed and far from consistent. Even worse, their inconsistent results then often lead to the wrong assumptions about their abilities as traders and about their trading strategy and they start “system-hopping”, making adjustments (randomly changing indicator settings, adding tools or just arbitrarily manipulating their method) on a trade to trade basis.
In what follows, we will provide a single concept that could help you understand the nature of financial markets a little bit better and can also help you model your trading strategy in a new way which can handle changing market environments more effectively.
Financial markets are never the same and they are always evolving, which is probably why trading and investing is such an interesting field. The price movements that we follow on a daily basis are the results of human interactions, beliefs, hopes and expectations about the now and the future. The image below illustrates this changing nature of financial markets.
The blue shaded area is the VIX (Volatility Index) which shows the volatility in the S&P500. A high VIX means that prices fluctuate much more around the mean and that the daily price candles are much greater. Conversely, a low VIX indicates much smaller price movements and price does not change that much on a daily basis. As you can see, the VIX changes significantly over time and the change can occur very suddenly and be very steep. However, to extract actionable results, we have to take a closer look.
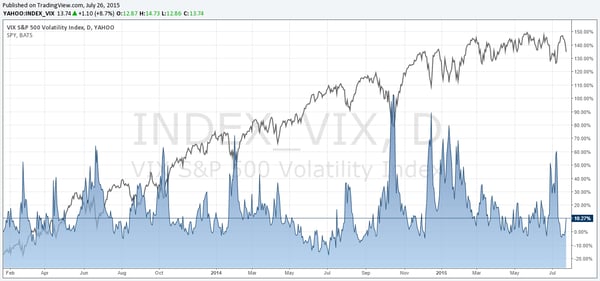
VIX – click to enlarge
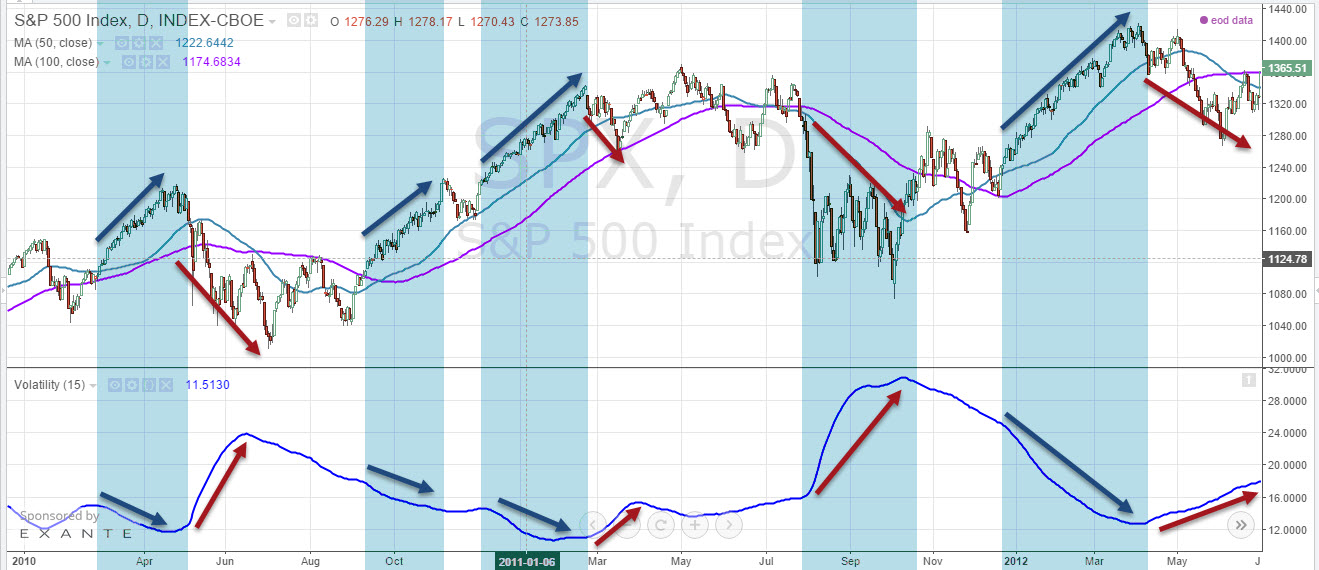
To provide some more hands-on advice, we are taking a closer at volatility and market phases. The screenshot below shows a S&P500 chart and a 15 period volatility at the bottom.
It is very obvious that volatility is lower during uptrends and rises in downtrends. But we can even go a step further.

Changing volatility in uptrends and downtrends – click to enlarge
In the next step, we empirically analyzed daily return data and intra-day price changes for the S&P500. Furthermore, we differ between two scenarios:
1) Price is below/above the 50 (or 100) period moving average
2) Price is below/above both, the 50 AND the 100 period moving average.
Following this approach we, first, want to differentiate between downtrends (below the moving average) and uptrends (above the moving average) and provide a more actionable approach for other traders since the use of moving average is very common already.
The table below summarizes our findings. All statistics agree and point to one result:
Price behavior in downtrends and uptrends differs significantly and it is measurable.
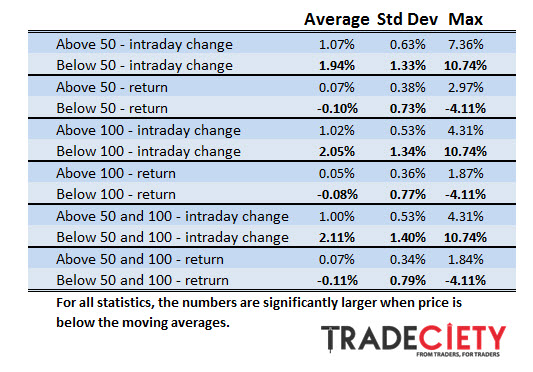
But, let’s take a closer look at what the numbers say. We can summarize the findings in the following points:
These findings illustrate the differences in price behavior for uptrends and downtrends and highlight the necessity of following a flexible trading approach.
Following a flexible trading approach is easier said than done and finding what works for your strategy is a gradual process. Here are a few tips that can help you adjust your trading parameters based on changing market conditions:
Stop loss placement
Stop loss placement is usually the greatest problem that traders have to face when applying a static approach to changing markets. In times of high volatility, price moves much further and traders often experience that their stops are getting hit more easily. When volatility is low, traders set their stops too far away and unnecessarily reducing their reward:risk ratio. Thus, in times of rising volatility, traders could avoid these stop runs by using stops that are placed further away. Caution: read the next point before making any adjustments.
Take profit placements
If you just set your stop loss orders further away when volatility is rising, you are reducing your reward:risk ratio and lowering the expectancy of your trading method.
In times of greater volatility, traders often set their take profit orders too close, which means that they cannot fully capitalize on larger price movements. Therefore, a trader should also re-think his take profit strategy under different market conditions.
Using take profit orders that are smaller when volatility is low can help reduce the number of trades where price turns ahead of your target. On the other hand, using a wider take profit order when volatility is high, can help you capture greater market swings.
Trade management
Since price behavior changes significantly based on the current market state, it will also impact your trade management approach. Trailing stop loss orders too close to current price when volatility is high will often result in stop runs during minor retracements. Also, in times of greater volatility, a trader has to be able to emotionally and psychologically deal with larger price swings. Therefore, differentiating between a reversal and a retracement is very important to avoid impulsive and emotionally caused trading mistakes.
Yes, the article includes a lot of information in a very short space. Let us summarize the most important findings and implication for traders:
We hope that it became clear that a flexible trading strategy can provide a much greater edge and help overcome some of the common problems traders have to deal with.
Further reading: Analyzing market direction in your trading journal can offer completely new insights about your trading.
external link:


We have been trading supply and demand strategies for over ten years, and they have stood the test of time remarkably well. Supply and demand is...

3 min read
Choosing the right trading journal is essential for traders wanting to analyze performance, refine strategies, and improve consistency. In this...

3 min read
“95% of all traders fail” is the most commonly used trading related statistic around the internet. But no research paper exists that proves this...