3 min read
Scientist Discovered Why Most Traders Lose Money – 24 Surprising Statistics
“95% of all traders fail” is the most commonly used trading related statistic around the internet. But no research paper exists that proves this...
Good chart reading and technical analysis do not have to be complicated. A trader should focus on a few key principles when trying to understand a price chart.
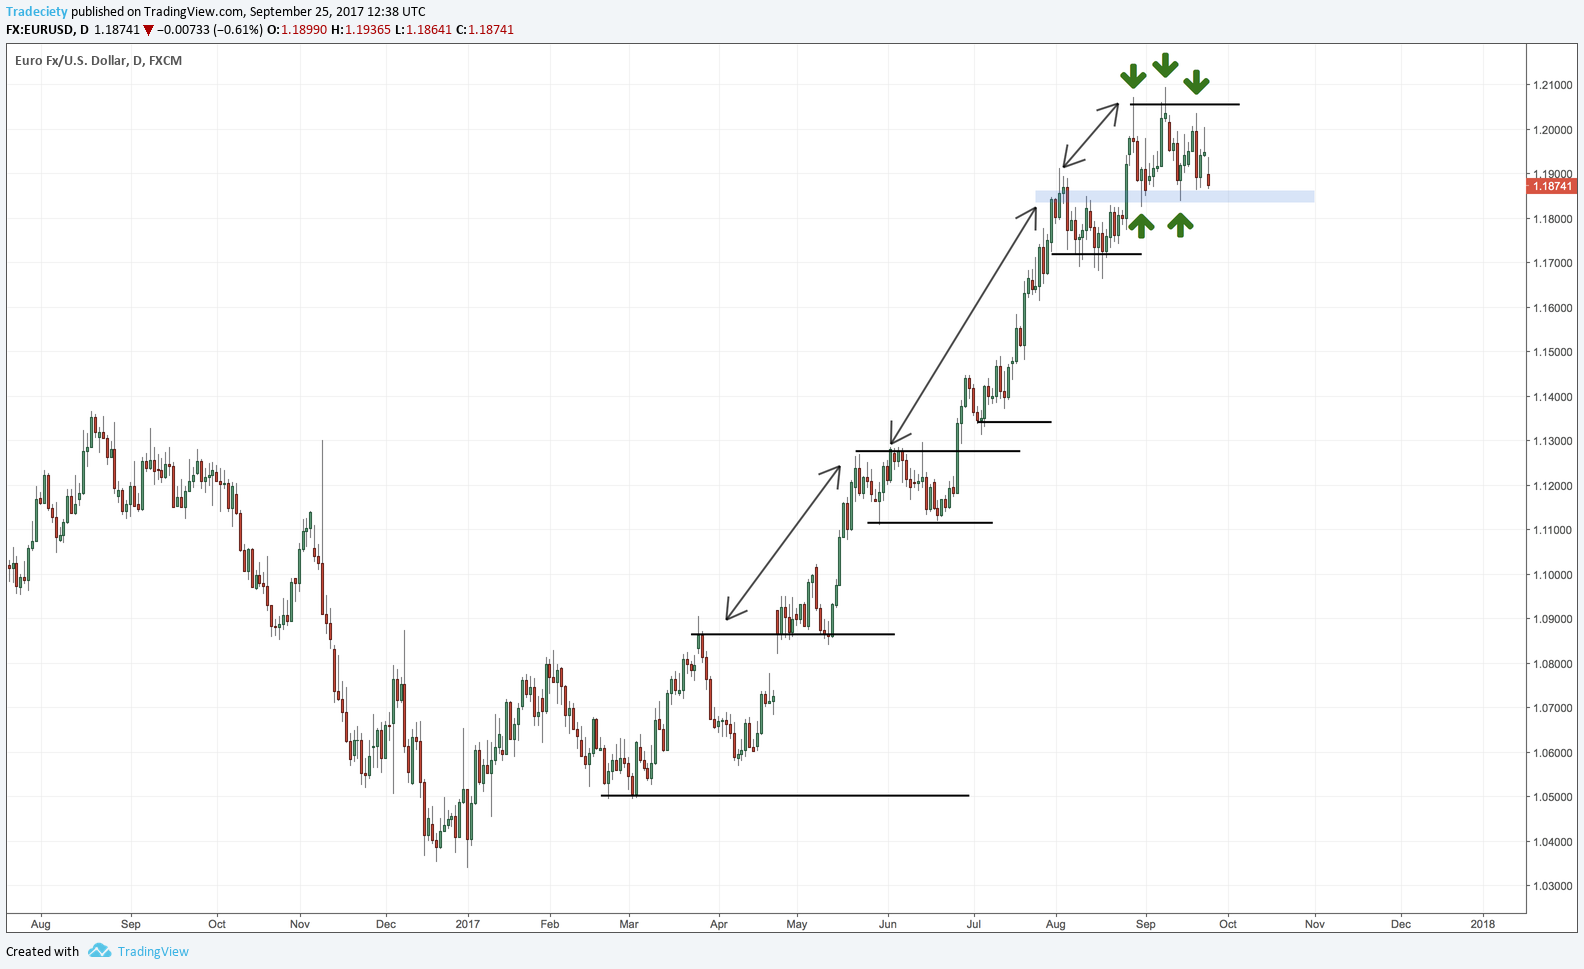
In my trading, I have stripped away everything that doesn’t provide value and I have optimized the points on my checklist that I use to read price charts. Below you see the current EUR/USD chart on the Daily timeframe and it offers a great learning opportunity because it shows us that ‘something’ is happening here.
Price is/was in a strong uptrend and now things are slowly turning. The amateur/losing trader will make the mistake of jumping in too early because he ‘feels’ that something is happening here but he is too early. Price is NOT yet ready to move lower and it’s too early to jump on the signal. But let’s start at the beginning and let me give you a few key principles that will help you understand trends and consolidations better:

When it comes to ‘keeping it simple’ this is a good basis for your price analysis and you can get so many information from your charts by just looking at those 4 principles. Most traders use too many tools, indicators and concepts that they overlook what is really important and then miss the clues that the charts are telling them.
Listen to the buyer-seller dynamic, understand how the power balance is behaving and you will do well when it comes to technical analysis.
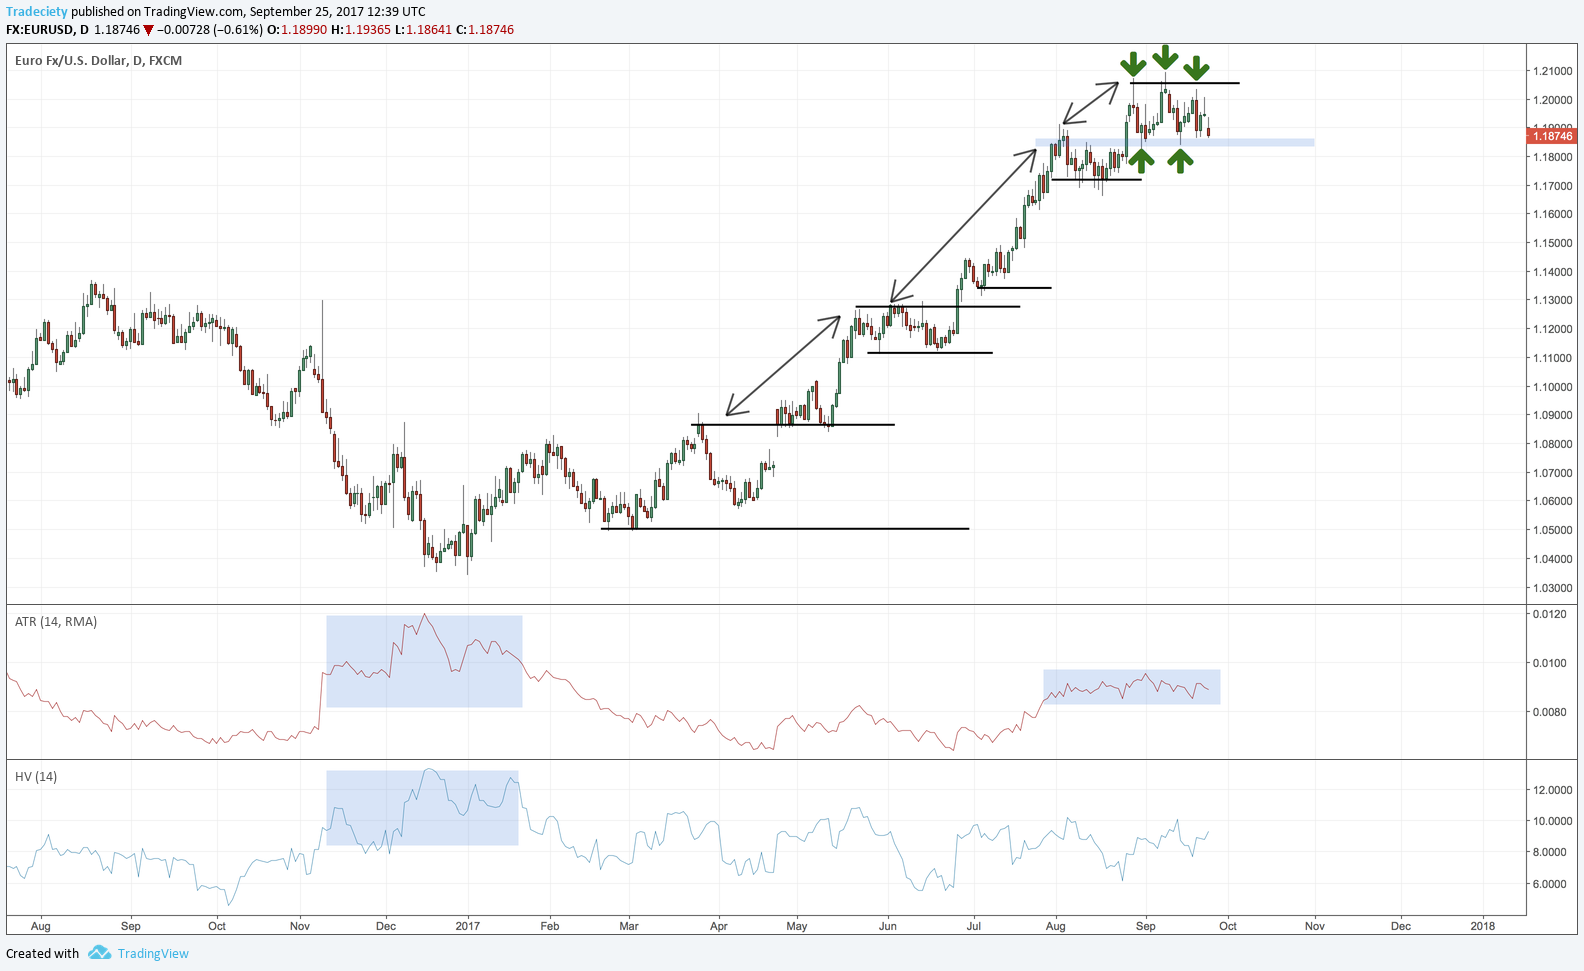
Market indicators
Indicators are definitely worth exploring and they can be a great addition. However, after a few years, you’ll be able to read the indicator information from your charts directly because you understand how the indicator interprets price information. I don’t use a lot of indicators in my own trading, but I know how certain price moves affect an indicator.
When it comes to ‘market indicators’ there are a few interesting one in this context:
Again, do not overcomplicate things, don’t throw on 10 indicators and then try to make sense of them, but understand the few key principles that make up our price charts, namely: volatility, momentum, speed and acceleration/deceleration.


external link:


3 min read
“95% of all traders fail” is the most commonly used trading related statistic around the internet. But no research paper exists that proves this...

3 min read
Trendlines can be great trading tools if used correctly and in this post, I am going to share three powerful trendline strategies with you.

3 min read
Choosing the right trading journal is essential for traders wanting to analyze performance, refine strategies, and improve consistency. In this...