Supply and Demand Trading in 2026
We have been trading supply and demand strategies for over ten years, and they have stood the test of time remarkably well. Supply and demand is...
Most trading platforms are very similar in the way that the information is arranged. Usually, when you open up your trading platform, the price area is the biggest area that jumps right at you. We will talk about price charts in the next point.
Below the price area, you usually see some pre-chosen indicators. For now, it’s enough to know that indicators take the price data from the price charts and transform it into visual information such as graphs, bar or other oscillating lines. We analyze indicators in detail later on.
Below that, you usually have information about your account, past trades or open positions. Traders often refer to this information as P&L, which stands for Profit and Loss and which shows you the current gain or loss of your open trades.
On the left, you typically find more instruments to choose from with their current prices. Also, most trading platforms provide an additional list with further trading tools or other indicators on the left.
The top menu gives you access to all the functions. There you usually also find shortcuts to select different timeframes, change the way of the price graph (more to it in the next point) or directly add indicators.
And this is basically how most trading platforms are designed. Of course, you will see slight variations, but for the most part, this guide will make the initial steps easier and less overwhelming for you.
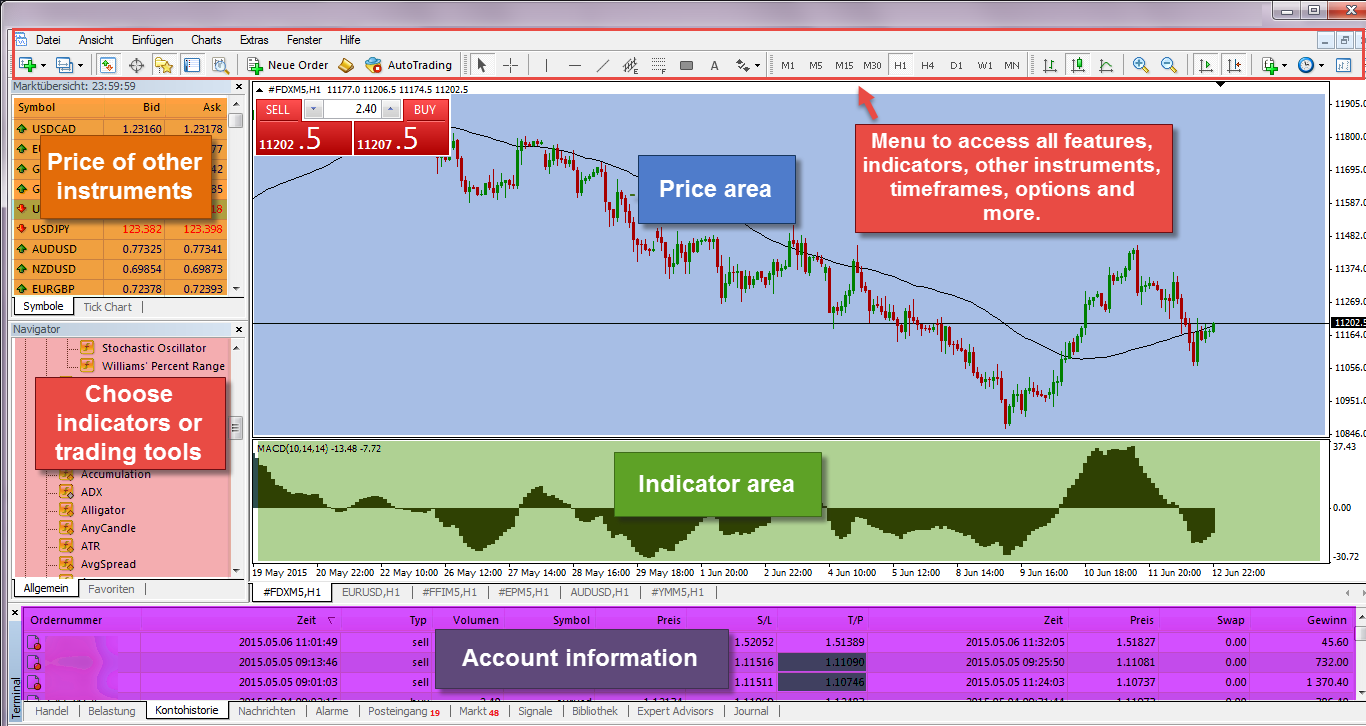
The basic structure of a trading platform – click to enlarge
The line chart is the stock chart that looks so familiar because we have seen it through our whole lifes in TV and newspapers. The line chart compromises all price information into one single line. The line graph comes in handy when you want to get a broader picture, but it misses a lot of information as we will see in the next point.
Bar Charts and Candlestick charts are mostly used by traders (especially technical traders) because bars and candles show the volatility and all of the price movement, whereas line graphs only show the closing price.
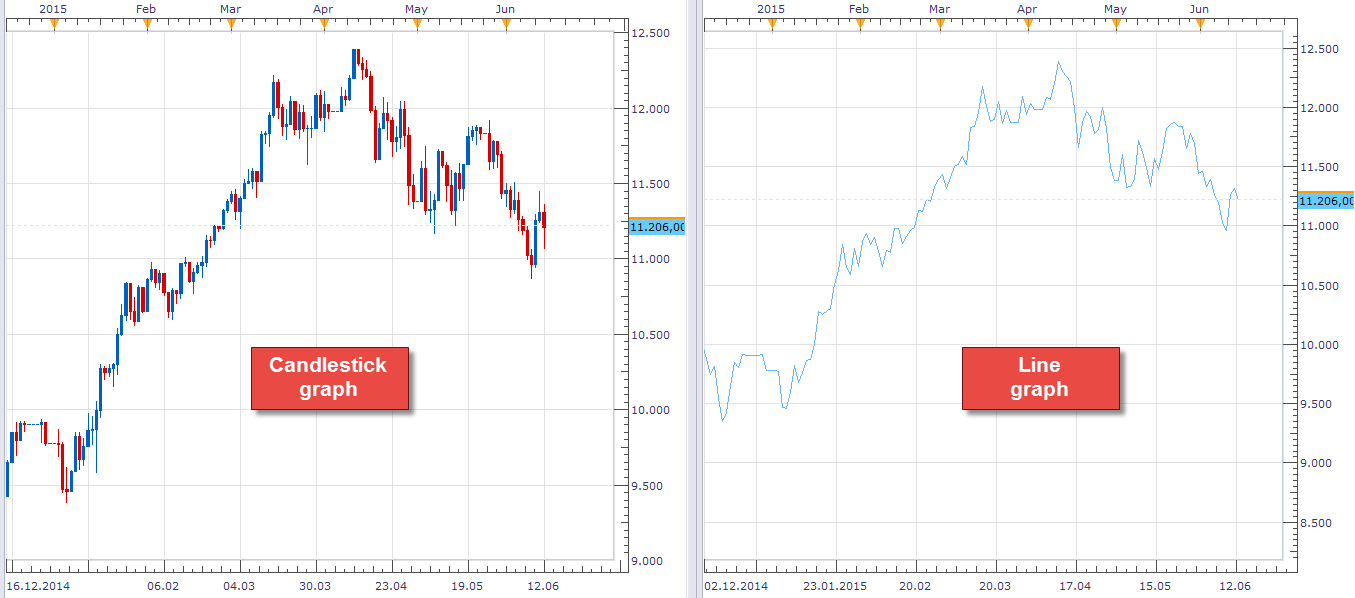
Comparing candlestick and line graph – click to enlarge
A candlestick (short form: candle) represents the whole price movement for the specific period. For example, if you watch the 1H chart(1-hour chart), each candle represents the price movement of one whole hour, whereas the line graph only gives you one point for each hour.
The candlestick has 2 elements: the body and the wick. The body is the box-like part which represents the distance between the opening and the closing price. The wicks show the highest and lowest price for that period.
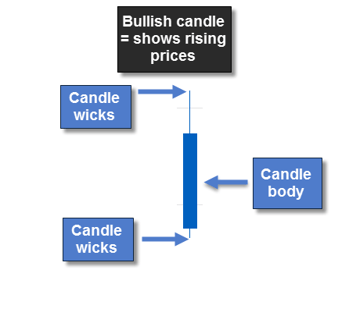
Candlestick basics I
The wicks are the thin lines ‘sticking out’ at either side and which represent the highest and the lowest price during the specific period. Read the advanced candlestick guide here.
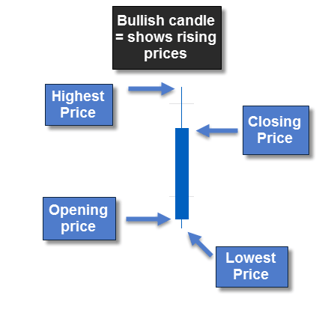
Candlestick basics II
Time-frames describe the time horizon for the displayed price information in your charts. The typical time-frames are Monthly, Weekly, Daily (D1), 4 hours (H4), 1 hour (H1), 30 minutes (30min), 15 minutes (15min), 5 minutes (5min) and 1 minute (1min).
The size of the time-frame determines the period for one candle. For example, one candle in the 4 hours time-frame contains all the price movements in that 4 hours period. A candlestick from the daily time-frame represents all time movement of that day.
Thus, 4 candles on the 15 minutes time-frame make up 1 candle of the 1 hour time-frame. And 4 of the candles on the 1 hour time-frame (or 8 candles of the 15 minutes time-frame) represent 1 candlestick on the 4 hours time-frame.
It is a myth that trading higher timeframes is easier. We have discussed the pros and cons of it previously.
Market orders are the typical orders most new traders use exclusively. When you click the ‘buy’ or ‘sell’ button in your trading platform, you place a market order and your trade is executed at the current best available price. Basically, a market order enables you to trade right away in that second you press the button.
Limit orders are set at a different price from the current available price. For example, Apple ($APPL) is currently listed at $128, but you want to buy it when it goes down to $125. So you have to place a limit buy order at $125 and once price goes down to $125, your order gets executed and you can buy APPL for $125. There are 4 different limit orders:
Buy Limit – Buying below current price
Sell Stop – Selling below current price
Sell limit – Selling above current price
Buy Stop – Buying above current price
Therefore, limit orders allow a trader to place a trade order at a specific price and does not require the trader to actively wait for price to get there.
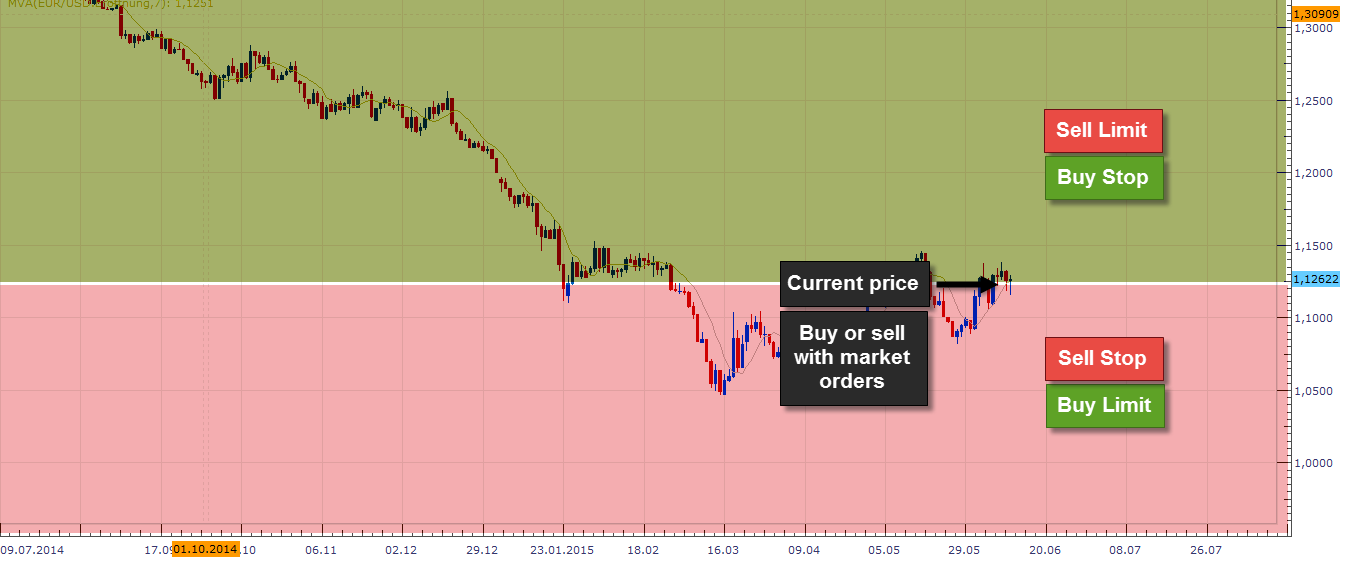
Market vs. limit orders – click to enlarge
The trading platform always shows two prices: bid and ask. The following points will explain the differences:
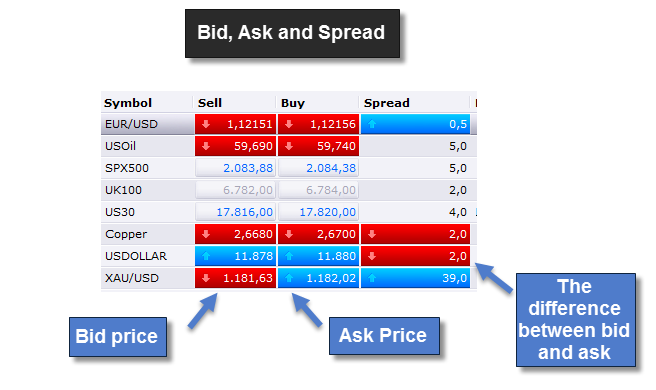
Did you ever wonder why, when you enter a trade, the order is not at the level where your broker showed you the price before? That’s because of the difference between the bid and ask price. By default, most trading platforms show you only the bid price, but when you enter a buy trade, your order will be placed at a higher price, the ask price. The chart below shows you the difference, after enabling the visualization of the ask price as well.
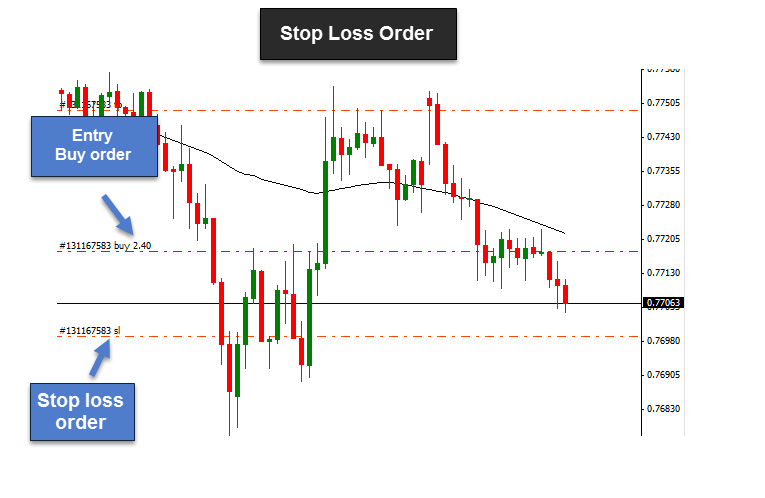
The stop loss order is among the most important concepts and we will talk about it in more detail later, but in its core, the stop loss is the order that will kick you out of your losing trade and close the position for you automatically when the trade goes against you.
A stop loss order enables you to pre-determine the size of your losses possible. And, even if you do not watch your trades at all times, a stop loss order makes sure that you will be out of your trade at a specific price level.
Note: In times of extreme price behavior, a stop loss order might be skipped and your losses can exceed the original planned amount. If you want to avoid such a scenario, you should look for a broker that offers guaranteed stop loss order execution.
Stop Loss order do not always work and sometimes, price can move past your stop.

Example of a stop loss order. It will close your trade once price reaches it – click to enlarge
The take profit order is the opposite of the stop loss. When price moves in your favor, your take profit order will automatically close your trade at a pre-determined price and realize the profits for you.
external link:


We have been trading supply and demand strategies for over ten years, and they have stood the test of time remarkably well. Supply and demand is...

3 min read
Choosing the right trading journal is essential for traders wanting to analyze performance, refine strategies, and improve consistency. In this...

3 min read
“95% of all traders fail” is the most commonly used trading related statistic around the internet. But no research paper exists that proves this...