Supply and Demand Trading in 2026
We have been trading supply and demand strategies for over ten years, and they have stood the test of time remarkably well. Supply and demand is...
I am a pure reversal trader, looking for those tipping points where the markets go from bullish to bearish trending phases and vice versa. Trading reversals is usually straight-forward, but there are two main difficulties when it comes to reversal trading:
1) Not all tops and bottoms completely reverse into the other direction – often price just consolidates sideways and you are in a trade that hovers around your entry.
2) Often you have to wait for days or weeks for a reversal, but then price just takes off without giving an entry signal – here it’s easy to start chasing trades or look for other mediocre trades.
Through excessive and obsessive journaling and record keeping, I have added a new component to my trading over the past ~8 months to counter some of those effects. Trendlines are well respected and adding the concept of the “trendline-break” can help filter out low probability market reversals and also time re-entry trades.
Getting used to drawing trendlines takes a bit of time, but once you have drawn a few, your eye will get used to seeing trendlines quickly. When you draw your trendlines, always look for at least 3 contact points – 2 points is usually not enough and the third touch is often the strongest. Don’t worry about violations about the trendline – the trendlines don’t have to be 100% accurate and as long as price respects them reasonably well, you are doing it right.
When it comes to trading the trendlines, there are two principles that you can help you make better trading decisions:
1) Entering on the break is a higher risk trade. Waiting for the retest is the safer option.
2) Don’t blindly trade off the trendlines with pending orders. Wait for a clear reaction around the trendline.
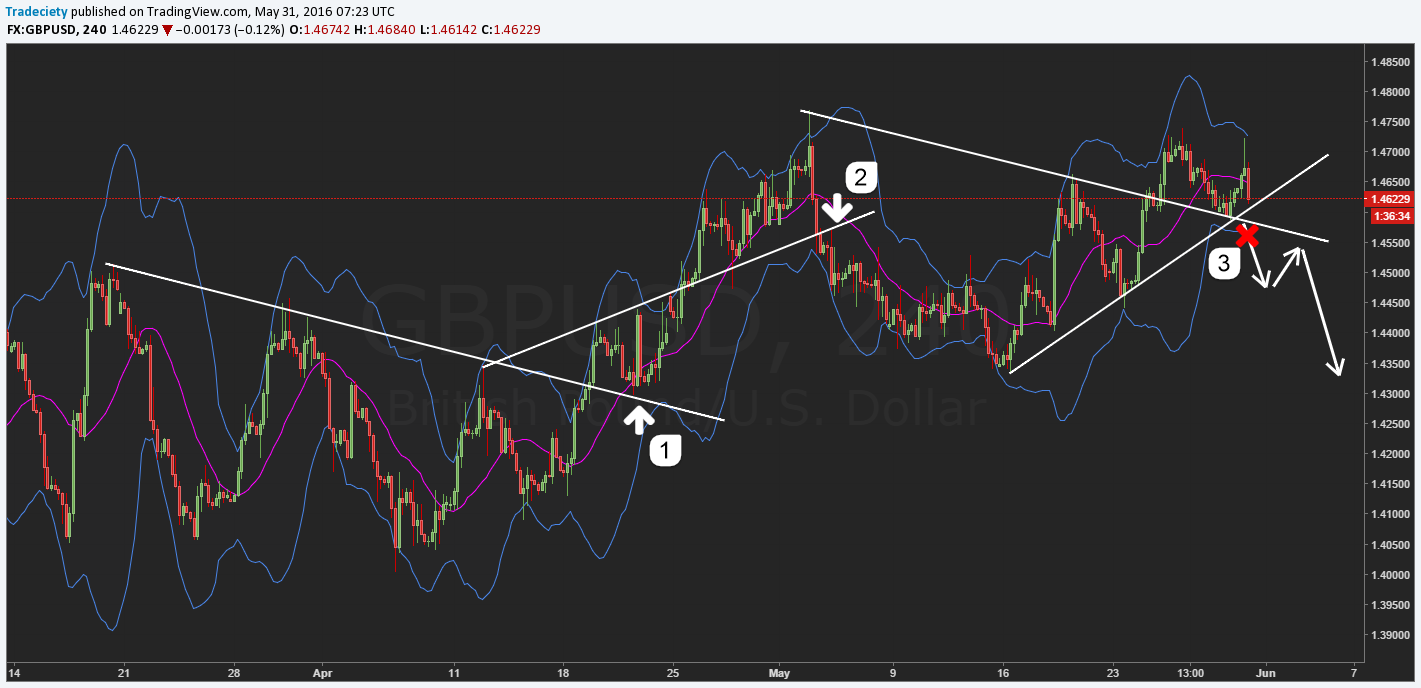
The screenshot below shows a chart with 3 such scenarios:
1) A downtrend where we connected the highs. Price then broke the trendline, retested it afterwards and took off.
2) An uptrend where we drew the trendline connecting the highs initially – price then started trending stronger and the trendline also acted as support at the lows. After price broke the moving average and the trendline, it retested it quickly before selling off strong.
3) The recent uptrend with a trendline as support. Price is about the break it, but according to the trendline, there weren’t enough sellers to push price below the trendline. Here we are even seeing 2 trendlines intersect, which makes it even harder for price to break but if you look at live price now, price nicely broke the trendline.
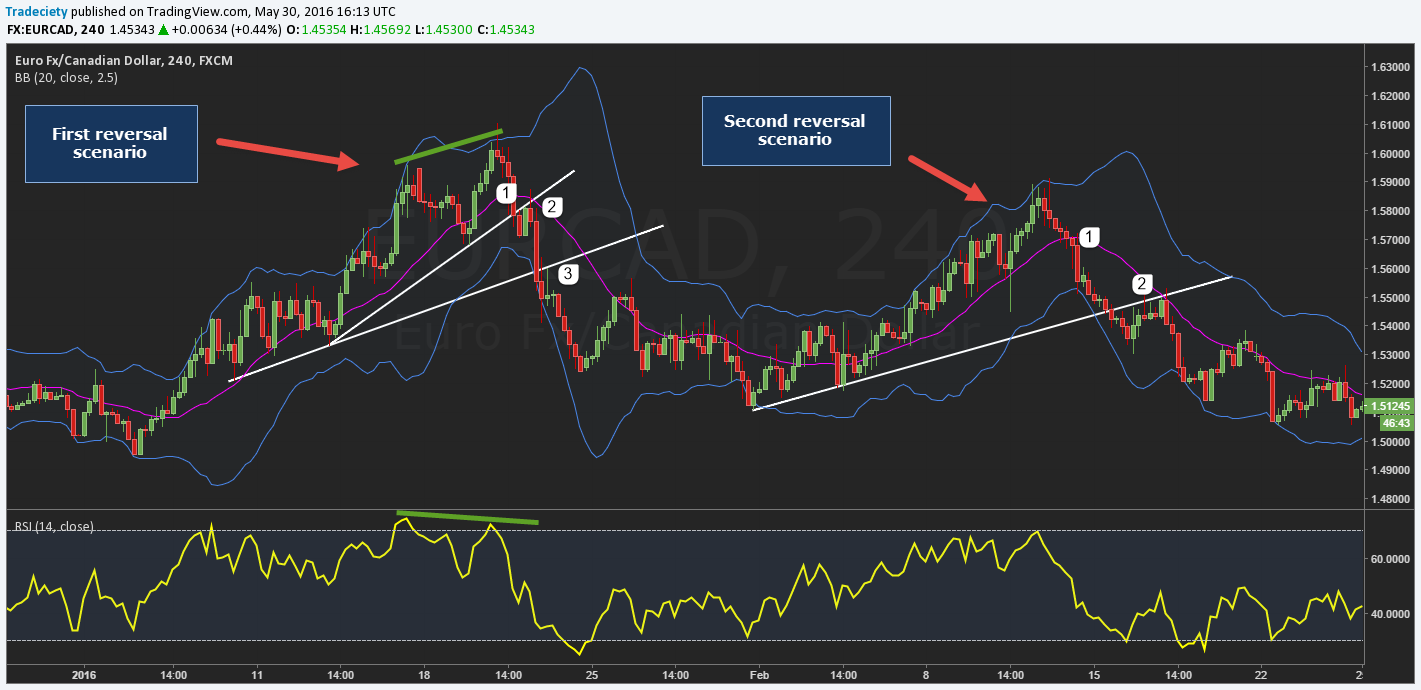
The previous example showed how we can draw trendlines and use the break of the trendlines to time entries. Sometimes, we can use the trendlines to find later re-entry points after a reversal and counter the effect of missing trades.
In the screenshot below, we see 2 reversals:
First reversal. The initial entry could have been at point (1) when price broke the trendline and the moving average. A safer entry could have been taken at point (2) after the retest. Note how those retests of the trendlines often coincide with a retest of the moving average as well which is a great confluence signal. Then, price sold off fast and at point (3) price broke and retested a lower trendline. Usually, such lower trendlines are a good spot to take profits because they often hold when momentum slows. And when you get a confirmed break of the lower trendline you can then consider a re-entry on the retest of the trendline.
Second reversal. This is a classic example. There wasn’t an initial trendline at the real top, but according to conventional reversal trading, the first entry could have been made at point (1) when we broke the moving average. The lower trendline then provided re-entry opportunities. Notice how price broke below the trendline and then moved back into it, trying to break it multiple times but was always rejected. The final sell-off then happened when the trendline coincided with the moving average.

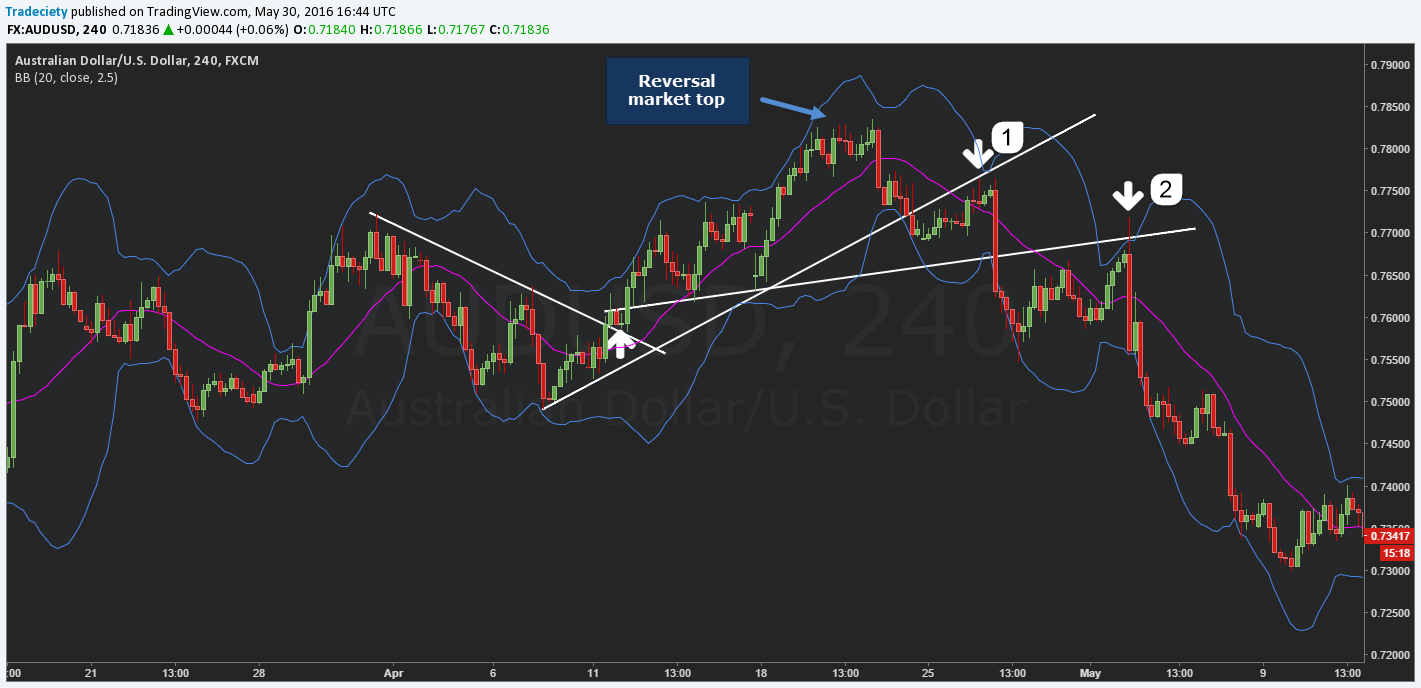
We talked about the power of Bollinger Bands® spikes at the Band-squeezes before. When combining those spikes with trendline retests, you can create another powerful combination of confluence. The screenshot below shows a bearish reversal with two trendlines. During the sell-off, price broke both trendlines and then retested them (point 1 and 2), while penetrating the Bollinger Bands®. Here we see why it’s important NOT to trade off those trendlines blindly and always wait for confirmation – the spikes through those trendlines can be very strong.
Bollinger Bands® squeezes are a well-documented trading concept and when combining it with the concept of trendlines and reversal trading, the trader can create powerful confluence concepts.
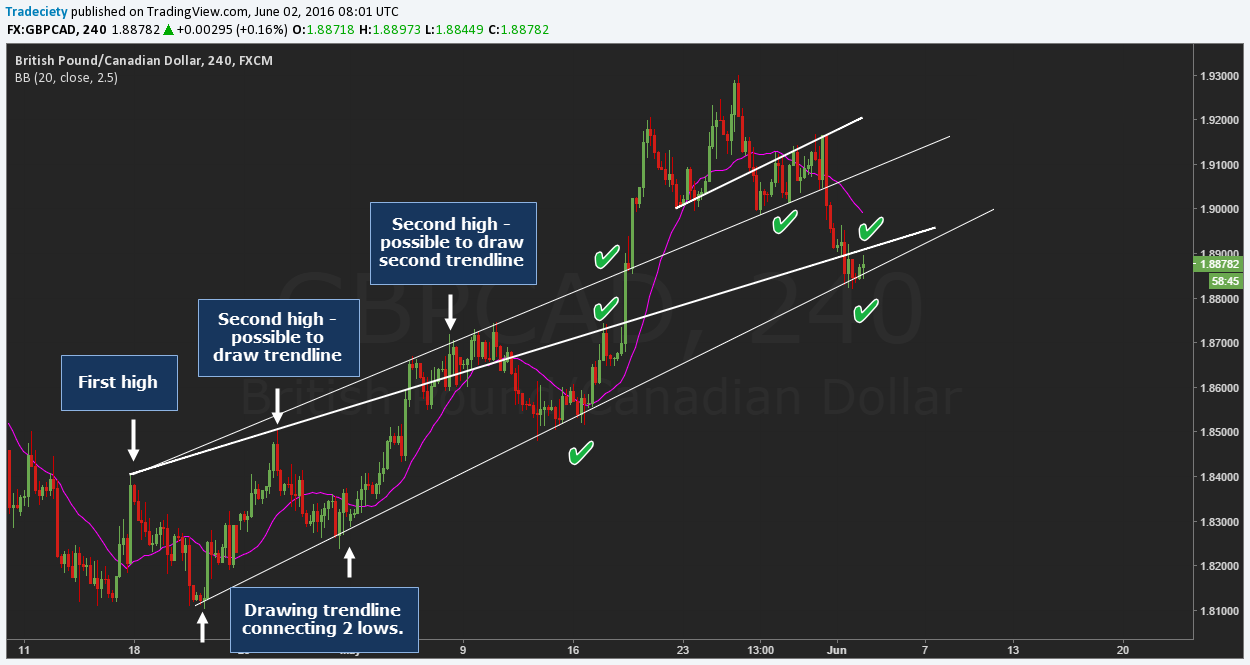
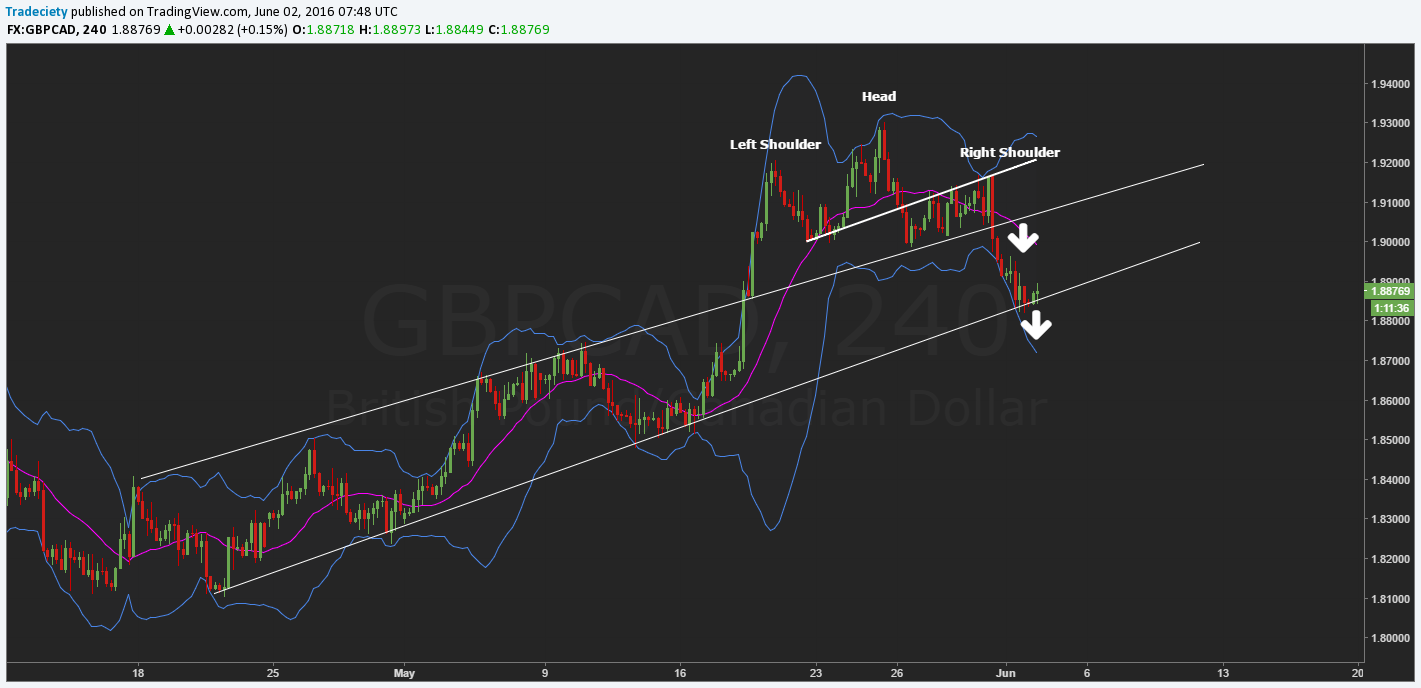
The current situation on GBP/CAD is another great example how trendlines can help you understand reversal and trend structure clearer. The market top and the fading bullish momentum was very obvious, but it wasn’t until the trendlines broke, that price confirmed the reversal. And now on the move lower, the trendlines act as support again.
A trader who is aware of the trendline can understand price in a more effective way, is not surprised why price does not follow his plan, can plan his trades in a new way and also manage re-entries.
It’s usually always possible to draw multiple trendlines and especially newer traders often tend to use too many trendlines. We suggest only using 1 – 2 trendlines per market move and to focus on the most important ones. The goal of trendlines is it to add context to your chart analysis and not to confuse you.
external link:


We have been trading supply and demand strategies for over ten years, and they have stood the test of time remarkably well. Supply and demand is...

3 min read
Choosing the right trading journal is essential for traders wanting to analyze performance, refine strategies, and improve consistency. In this...

3 min read
“95% of all traders fail” is the most commonly used trading related statistic around the internet. But no research paper exists that proves this...