Supply and Demand Trading in 2026
We have been trading supply and demand strategies for over ten years, and they have stood the test of time remarkably well. Supply and demand is...
Among the hours comprising the day’s session, the opening segment marked a critical point. Given the massive volume of traders and transactions flooding the gates in the early part of the session, the momentary equilibrium that defined the “opening range” often preceded the break that would sometimes define the day’s trend
Hence, traders often jumped at the breakout of the opening range, going long when price broke above the ceiling, or short when the price fell beneath the floor. This was known as the Opening Range Breakout (ORB) strategy.
But most commodity markets today don’t operate in quite the same way as they used to. Trading pits are largely a thing of the past. Exchanges are now globally accessible online. And markets virtually operate 24-hours, or 24/5. When just about anyone can respond to any event, at almost any time of the day, what relevance does the traditional trading day still have? And if its relevance has been diluted somewhat by the expansion of time and geography, how much importance, if any, are the opening moments of the bell?
In today’s 24-hour markets, “opening range” is less defined by time than it is by the events surrounding that time.
Suppose you trade Forex, the Emini S&P or Dow, what difference does it make that the NYSE opens at 9:30 am ET if a highly-anticipated Federal Reserve speech takes place at 8:00 am ET, or if a similar Fed speech took place internationally, say at 11:00 pm ET the previous night?
In either case, the markets might have already moved well before the market open.
Yet, the time between 9:30 am to 11:00 am ET, at least for the S&P, Dow, Nasdaq, and Russell 2000, still holds, on average, the highest volume of trading activity for the day’s session, making the opening period a relatively important moment during the trading day.
So, if you were to attempt to trade a breakout of the opening range, with the aim of riding the day’s short-term trend, how might you do it?
Here’s one way of going about it:
With regard to the last point, not only does this give you an objective exit level, it allows you to measure risk-to-return (stop loss to profit target) which in turn might help you determine the appropriate position size for your trade.
1. E-Mini Dow (YM Continuous Contract) 15-Minute March 7 to March 11, 2019
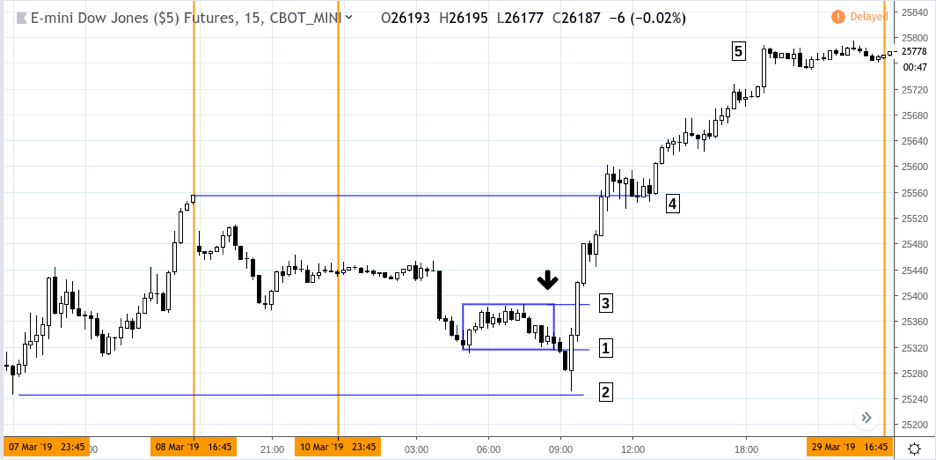
This would have been a relatively tricky session to trade as two breakouts occurred, the first of which might have been a loss, a breakeven trade, or a profitable trade depending on how you managed the trade before its reversal; and the second breakout potentially yielding a profit that exceeded our initial target.
First Trade:
The first trade at [1] presented a scenario where you would have risked 76 points to gain 33 points with the downside target at March 8 support [2] , a risk-to-return of 2.3-to-1. Not good odds. When the risk is greater than the potential return, we recommend not taking such a trade, or minimizing position size (is it really worth it?).
If you happened to take the trade, your profit target at [2] was never reached: you might have moved your stop to your entry point to attempt a breakeven trade (you have roughly 20 minutes to manage this), you might have taken profits as you came within 5 points of your target (you could have easily missed this), or you might have taken the 76 point loss.
Second Trade:
If you waited for a potential upside breakout, you would have had a return-to-risk scenario of 2.22-to-1, as you would have risked 76 points for a potential return of 169 points. The breakout at [3] took place at 9:45 am, and reached its target at [4], the March 8 swing high around 10:45 am ET. If you held on longer, you might have seen the YM exceed our initial target, breaking above the March 7 high of 25,741 as shown at [5].
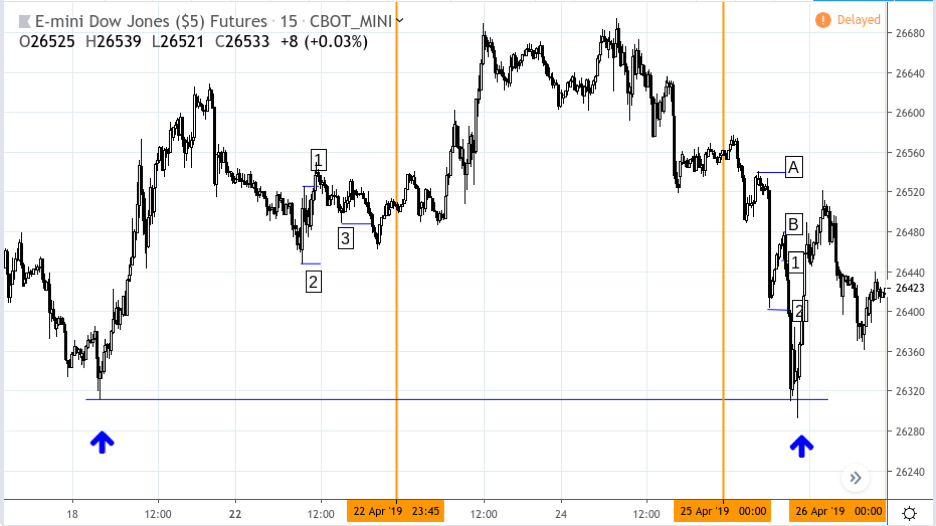
2. E-Mini Dow (YM Continuous Contract) 15-Minute April 21 to April 22, 2019
On the morning of April 22, the YM established a relative swing low at 9:30 am ET and a relative swing high at 9:45 am ET. The pullback following the 9:45 am bar appeared to have a potential set up in place from which the YM may break higher or lower.
Here’s the fundamental context:
Given the reasonably positive sentiment (due to the S&P earnings) a buy stop might have been placed at [1] anticipating a breakout, with a stop loss set at [2] below the 9:30 am bar.
Home sales came in at 5.2 million, but the figure was slightly under the 5.3 million consensus expectation. Although this perceptively lackluster figure may have been enough to lift the market, as the price broke through the swing high at [1], it wasn’t enough to support it throughout the day.
Although price did no violate the swing low at [2]–an indication of a potential downtrend–price failed to follow through beyond the breakout. Perhaps by 3:00 pm ET, one would have sensed a flat market, raising a stop loss to [3], a point at which a new swing low had been established. In that case, that level would have been taken out at [4] during the Asa-Pacific session at around 9:00 pm. The trade would have resulted in a loss of approximately 40 points.
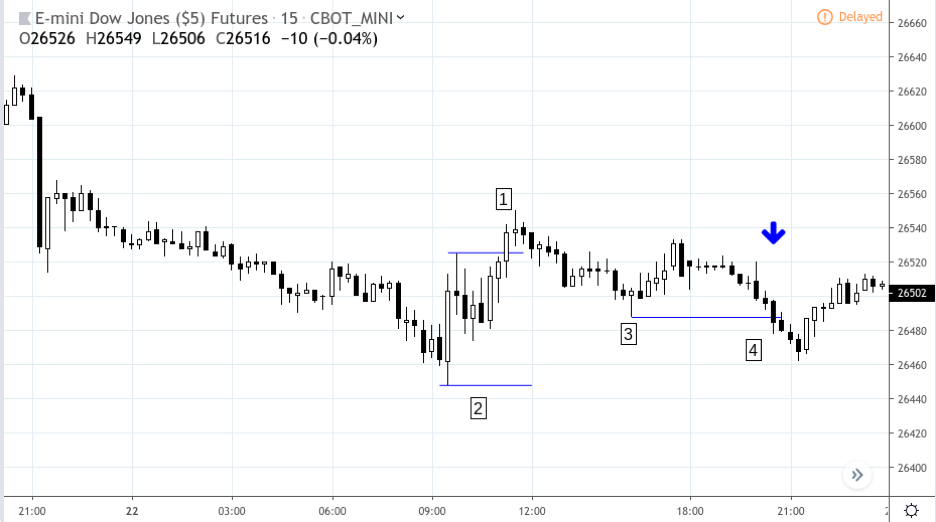
3. E-Mini Dow (YM Continuous Contract) 15-Minute April 25, 2019

The morning of April 25 presented us with a mixed technical and fundamental context. On one hand, the short-term technical trend presented us with a downtrend (see arrows). On the other hand, the economic reports released that day presented both positive and negative figures.
Durable goods surged to a 7-month high at 2.7%. Economists were expecting a mere 0.8% increase. Jobless claims, however, increased by 37,000 to 230,000 in the week ending April 20. Economists were expecting a figure of 200,000.
If your bias was toward the upside following those reports, you might have placed a buy stop at the swing high at [A]. This would not have resulted in a trade as price wouldn’t have reached that level in the minutes following 8:30 am ET.
If your bias was toward the downside, you would have had two trades. The first trade at [1] is an early entry trade where the uptrend represented a small upward “correction.” Going short the downside breakout at of the swing high you might have placed a stop loss at the top of the high bar [B]. Your second trade would have been at the break below the most recent swing low at [2], with a stop at [B].
Either breakdown might have worked as price rapidly declined following the Durable Goods and Jobless Claims. Given the swing trading context, the question now is where you might have placed your profit target. We identified the price zone of 26300 to 26310. Anticipating a bounce from previous support, this price zone appeared as a probable stopping point as it served as a strong support level on April 18, 2019 (see blue arrows).
4. E-Mini Dow (YM Continuous Contract) 15-Minute April 17 to April 25, 2019

Opening range breakouts may still be a valid concept to trade, but you may need to slightly alter or expand your notion of what “opening range” means in today’s market environment. Because large market moves can happen almost anytime within the 24-hour period, the opening range may reflect more immediate reactions to events and reports surrounding the market open rather than reactions to events/reports that took place overnight.
Nevertheless, when trading the opening range, it might help to get a broader overview of the technical and fundamental context surrounding the market open rather than trading with just the immediate range in view.
external link:


We have been trading supply and demand strategies for over ten years, and they have stood the test of time remarkably well. Supply and demand is...

3 min read
Choosing the right trading journal is essential for traders wanting to analyze performance, refine strategies, and improve consistency. In this...

3 min read
“95% of all traders fail” is the most commonly used trading related statistic around the internet. But no research paper exists that proves this...