Supply and Demand Trading in 2026
We have been trading supply and demand strategies for over ten years, and they have stood the test of time remarkably well. Supply and demand is...
2 min read
Rolf
Mar 20, 2017 8:00:00 PM

Multi timeframe analysis is a keyword that gets thrown around a lot but is it really working? Multi timeframe analysis is important but when it comes to making actual trading decisions, it’s often impossible to have all the timeframes line up the same way – you probably know how difficult this really is.
In my eyes, multi-timeframe analysis is one of those things that sound good but when it comes to being practical, it doesn’t work:
If you buy dips on the 1H because the 4H is in a trend, your timeframes aren’t lining up: your 1H is in a retracement into the opposite direction of the 4H.
If your 4H is breaking out of a range, your 1H will already show a healthy trend usually.
A range on the Daily or 4H, can be traded as a trend trader on the 1H.
You see, it’s very hard to have a trade in the same direction on different timeframes. Usually, your lower and higher timeframes will show different phases of trends and ranges. A good comparison is multitasking: as we all know by now, research has shown that multitasking does not exist; we just cannot do 2 things simultaneously. What we really do is task-shifting: we do one thing and then shift our focus and attention to another task.
Multi timeframe analysis is important but we have to abandon the idea that all timeframes will always line up the same way. Let’s take a look at a recent trade and observe the different timeframes and what really happens there. In my trading, I also use multi-timeframe analysis but when it comes to making trading decisions I use a technique that you could call timeframe-shifting.
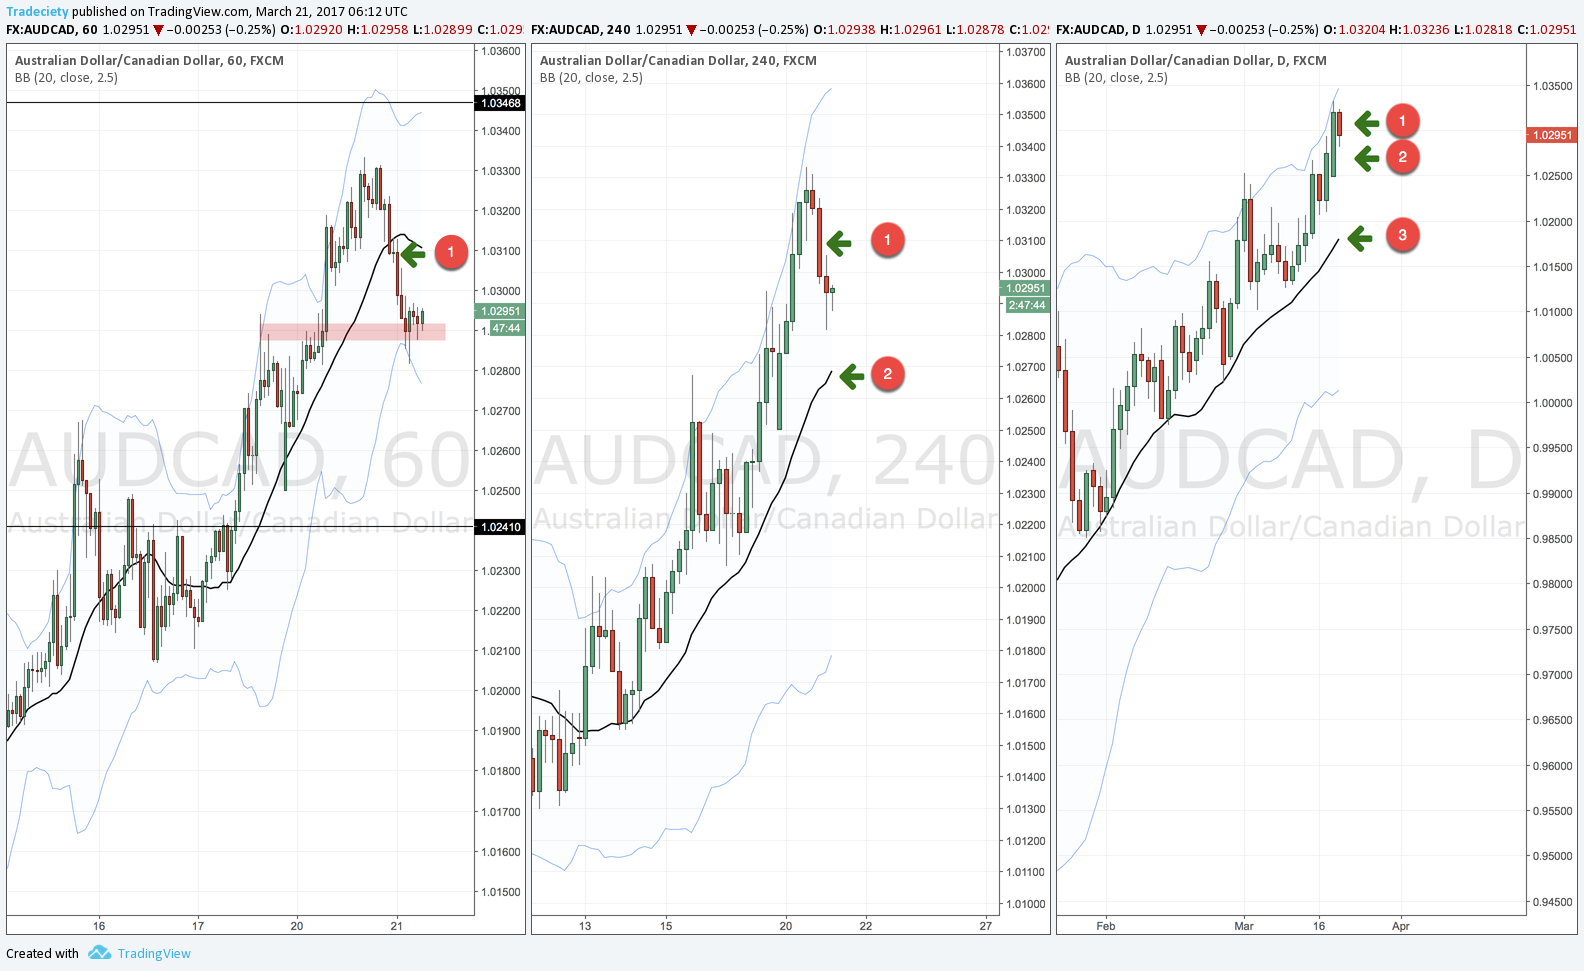
Timeframe shifting means that you get different trade signals at different stages of a trend, depending on your timeframe. The screenshot below shows the current AUD/CAD chart with the 1H, 4H and Daily timeframes from left to right.
Obviously, the 1H does move the fastest and the signal on the 1H is usually the first to occur. We had the short signal on the AUD/CAD at the green arrow marked with (1). When we look at the 4H during the 1H-entry, the 4H was still trading well above the 20 SMA and the trend reversal on the 1H just looks like a retracement on the 4h; momentum was already turning more though. This is even more true for the Daily.
This is also why the 1H signals tend to lose more often and the winrate is usually lower on the lower timeframes.
However, and this is where the timeframe shifting approach really shows its power: If the 1H trade is successful and price goes down, we might get a 4H short entry as well (point 2), at least doubling our profits if the 4H also moves lower. And if the 4H gives us a successful trade, we might even get a Daily signal (point 3) afterward. This can turn a regular 2R winner into a 10R winner easily.
The risk on the 1H is higher, of course, but risk is always present in trading. If you take smart risks and get into such a high probability,multi-timeframe trade, you can end up with 3 successful trades and netting a large amount. If the 1H trade fails, you will have 1 losing trade which is not nice, but just one good multi-timeframe trade can easily pay for a handful of 1H trades.
You see, multi-timeframe is not always what it seems and the traders that wait for all timeframes to line up will wait for a very long time; it’s just not practical and you will miss a lot of good trades. It’s more important to understand that different timeframes will always be in different phases of a trend or range. What you really need to do is pick one timeframe and make your trading decision there and stay in that timeframe! And once you have a signal on a different timeframe, you can shift your focus to that timeframe and follow price there.

We have been trading supply and demand strategies for over ten years, and they have stood the test of time remarkably well. Supply and demand is...

3 min read
Choosing the right trading journal is essential for traders wanting to analyze performance, refine strategies, and improve consistency. In this...

3 min read
“95% of all traders fail” is the most commonly used trading related statistic around the internet. But no research paper exists that proves this...