3 min read
Scientist Discovered Why Most Traders Lose Money – 24 Surprising Statistics
“95% of all traders fail” is the most commonly used trading related statistic around the internet. But no research paper exists that proves this...
Everyone knows, what a moving average is. Everyone knows, what volume is. Everyone uses these tools differently in their trading. Volume is used to read the strength of breakouts by a lot of Stock traders. Moving averages are traditionally used either in crossover-based systems or simply to get a grip on market direction and momentum.
To assess whether a breakout or a move is genuine, we can use many tools i.e. the break of support/resistance or a trend line, the RSI closing above 70 or below 30, a close of price outside of the Bollinger Bands, an increase in volume, an Ichimoku-break, price breaking through the moving average, or simply how strong or weak the bar itself closed. As you see, we can use tons of different tools to stack the odds in our favor when assessing the ingenuity of breakouts.
Now there is a tool we can use to combine both a moving average and volume in order to get a read on momentum and breakout strength – the volume weighted moving average. What it does is to incorporate not only the last x periods of price into its calculation but also the average volume during those x periods. That means when the volume is stronger, the VWMA will follow price more closely, and when volume falls off, it will mimic a simple moving average. The VWMA does not make a difference between buying and selling volume, only the strength of volume itself, so it will simply get closer to the close of the day when volume increased on that day, no matter whether it is a bearish or a bullish close.
Important is – if the VWMA is above the SMA, we are moving in an uptrend, and when it is below, we do have bearish implications. Or even simpler, as long as the VWMA is between price and the SMA, we are trending in that direction.
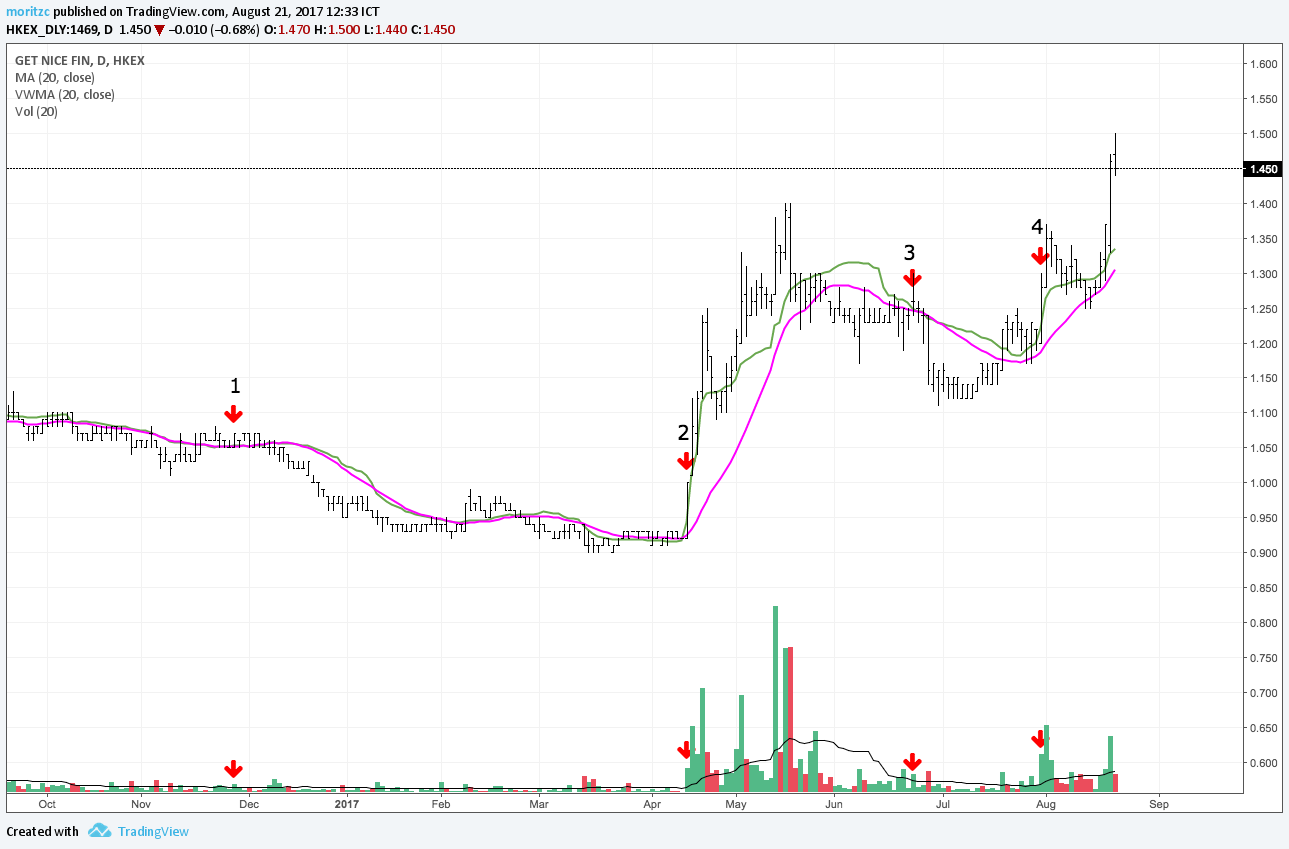
Now to make this tool really useful, we need something else – a second moving average with the same period reading. For this article, we will use an SMA(20) in pink and a VWMA(20) in green plus a volume histogram with an SMA(20) in black applied to it. Let’s take a first look at how they behave in relation to price.

At point #1, the moving averages are moving together, simply because the volume is staying exactly on its 20-day moving average, as well, as you can see on the histogram. The VWMA closes in the middle of that bar while the SMA is pretty much at the bottom. At point #2, we get a divergence of the two MA’s, because on that day the closing volume is roughly 6 times higher than the average of the last 20 days. This strong divergence together with the strong bullish close of the bar and a break of technical levels can be an entry signal for us. At point #3, you can see volume dying down on the histogram and thus our moving averages are joining forces once more. And at point #4 we have the repetition of what happened at #2.
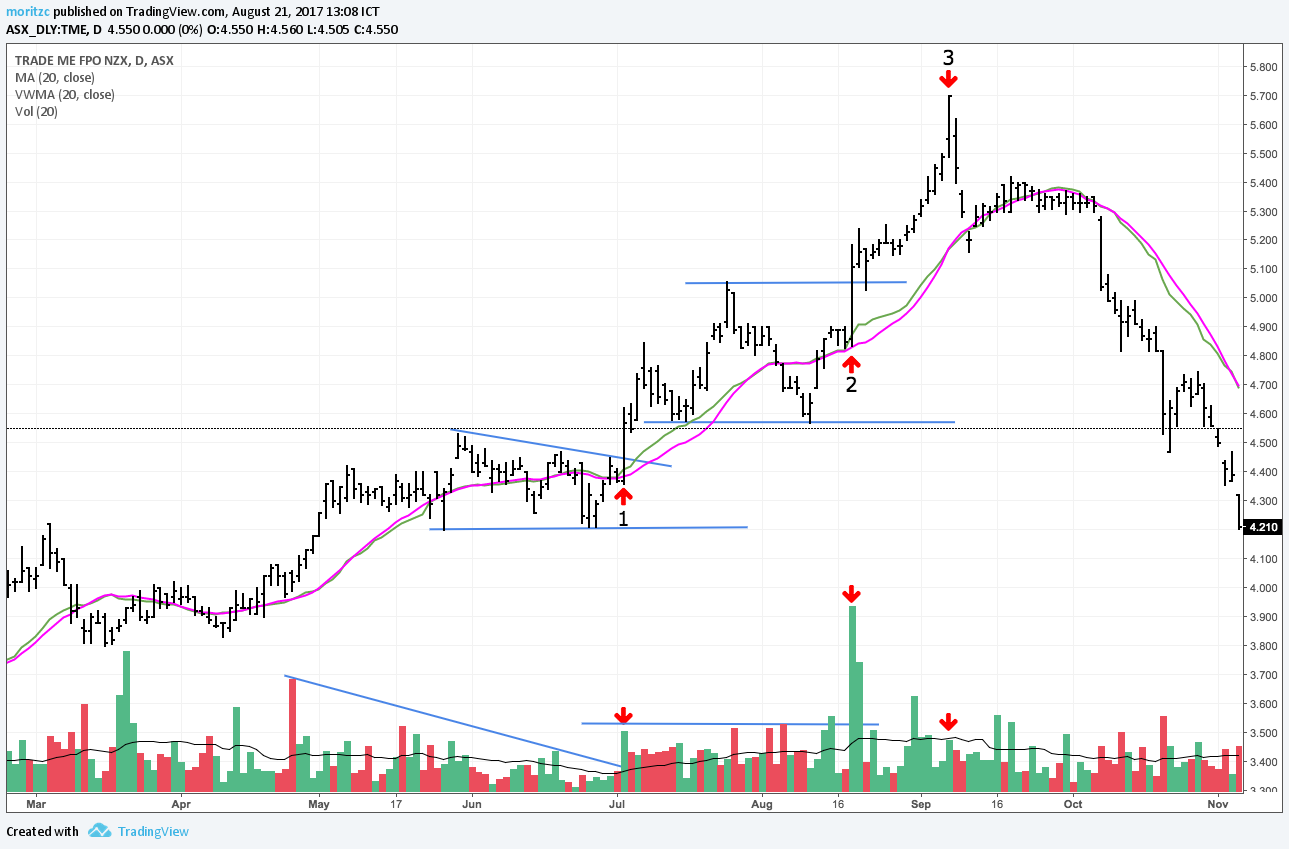
Now, how can we use this really, really nice tool to our advantage? Well, as I already demonstrated in the above chart, it can help us to visually spot emerging trends when breakouts of ranges happen. Secondly, you can detect when a trend is losing steam and it might be time to exit – like in the example below.
At point #1, the VWMA cuts below the SMA while the distance between price and the MA’s is actually growing – this is divergence! As we know, divergence can be a great tool to exit trades at the end of a trend. At point #2, price starts to range while the MA’s become one, this is another great time to exit. And at point 3, finally, price closes multiple times below both MA’s while they mimic each other, this is a sure-fire sign that the trend is dead for now and you should take your cash and run.
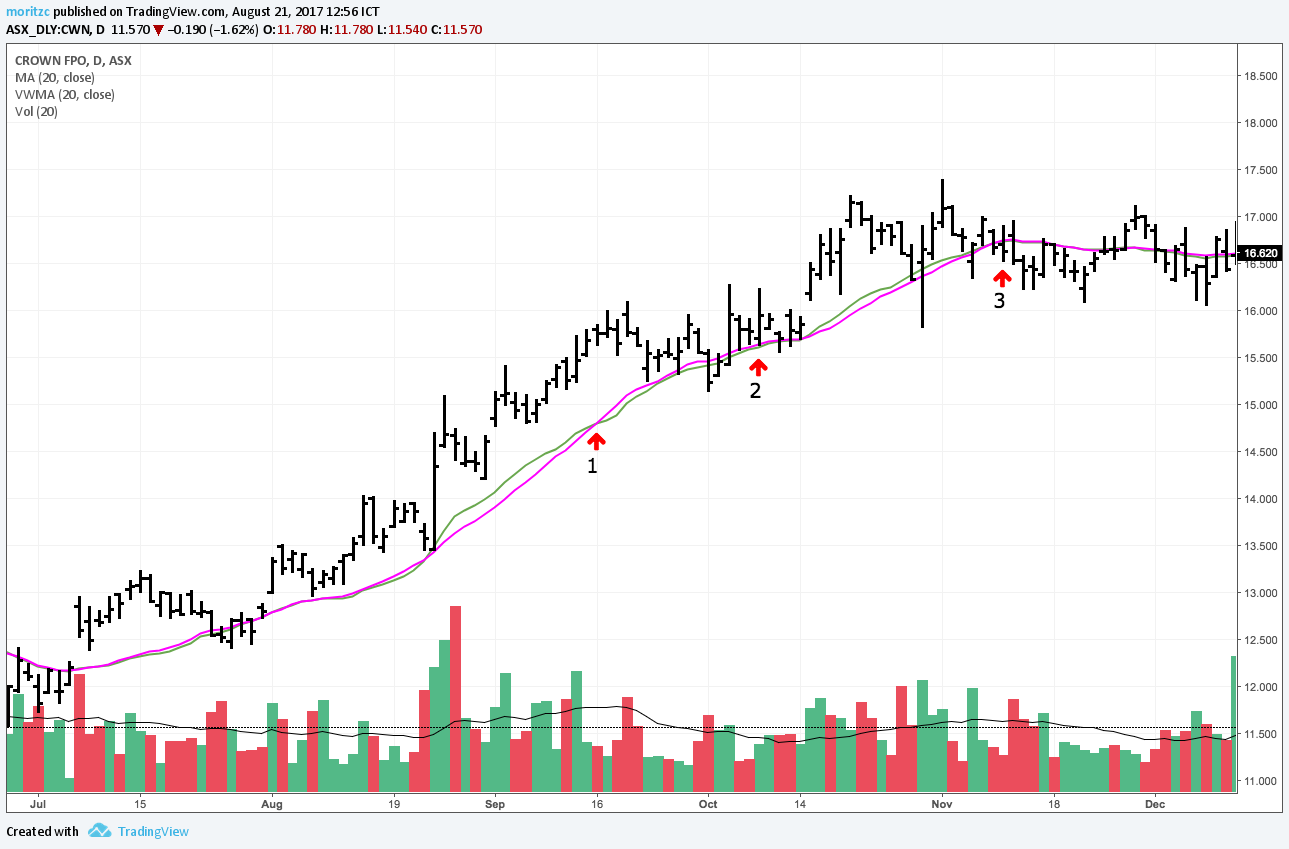
And finally, you can use these two moving averages to buy the dips in trends, as they VWMA will sometimes test the SMA and then distance itself from it once more, this is often a great time to get in should you have missed the initial breakout.
Notice that we are in an uptrend and then start consolidating – we then break out of that consolidation at point #1 with strong volume as you can see on the histogram and thus our MA’s are putting a distance in between them – time to get in! The same happens at point #2. I also drew a trendline and a resistance level on the volume histogram which is something I like to do because during consolidations in trends the volume should die down or at least stay constant without any outliers. When we then get a break of our consolidation on the price chart as well as on the histogram plus a growing distance between our MA’s, we have stacked the odds in our favor nicely.
And as a bonus, look at point #3: the VWMA closed a tiny bit below the SMA, so we got a bearish cross, while price pushed strongly to the top on dying volume. This is a perfect exit signal – and as you can see, the trend broke down brutally right after that. In this case, we really would have exited at the very top of this trend – this happens once per year, maybe, but it always feels awesome to pick tops and bottoms when exiting trades. I would never try this when entering trades because remember, an exit signal can be strong enough for us to quit a trade but it is not automatically strong enough for us to initiate a new trade in the other direction.
We can use the VWMA in combination with a traditional SMA in order to spot emerging trends, get in on existing trends and also to spot the end of a trend. It is easily a huge upgrade on any trend trader’s arsenal which is why I am stunned that so few people are using it. Of course, you can simply use the volume histogram to come to the same conclusions but visually to know what is going on at a quick glance, the VWMA/SMA combination is unbeatable. Give it a try, and you won’t be disappointed, especially when trading breakouts.


external link:


3 min read
“95% of all traders fail” is the most commonly used trading related statistic around the internet. But no research paper exists that proves this...

3 min read
Trendlines can be great trading tools if used correctly and in this post, I am going to share three powerful trendline strategies with you.

3 min read
Choosing the right trading journal is essential for traders wanting to analyze performance, refine strategies, and improve consistency. In this...