Supply and Demand Trading in 2026
We have been trading supply and demand strategies for over ten years, and they have stood the test of time remarkably well. Supply and demand is...
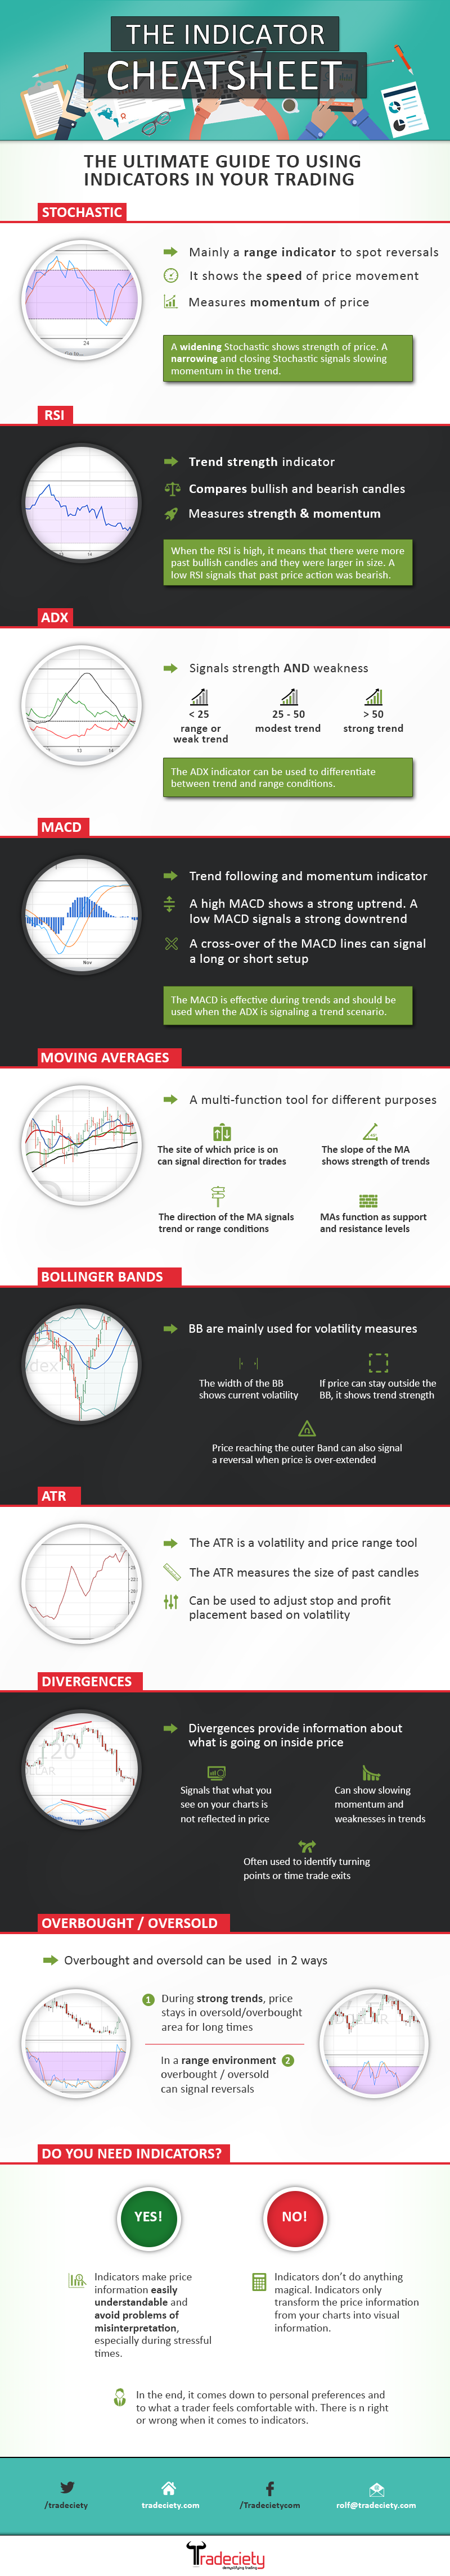
Indicators are very famous tools and used by millions of traders. However, often traders don’t really know what their indicators are doing or how to use them. Over the past articles, we covered and explained many different indicators in depth and I am going to link them up here as well. But, to summarize all the information and make it easily accessible for you, we put together this indicator trading cheat sheet that exactly tells you what different indicators do, what their main goals are and under which conditions to use them.
And if you want to know more about individual indicators, you can check out our in-depth articles:
The Stochastic indicator step by step
Getting to know Bollinger Bands®
The ATR (Averge True Range) volatility indicator
Our ultimate guide to moving averages
Using the ADX indicator to identify trends
An in-depth guide to the RSI indicator
What are divergences? And what is a double divergence?
An introduction to mean reversion trading
right-click and use ‘save target as’ to save the infographic to your computer
external link:


We have been trading supply and demand strategies for over ten years, and they have stood the test of time remarkably well. Supply and demand is...

3 min read
Choosing the right trading journal is essential for traders wanting to analyze performance, refine strategies, and improve consistency. In this...

3 min read
“95% of all traders fail” is the most commonly used trading related statistic around the internet. But no research paper exists that proves this...